Báo cáo lâm nghiệp: "Development and characteristics of microsatellite markers for sugi (Cryptomeria japonica D. Don) derived from microsatellite-enriched libraries" ppt
Bạn đang xem bản rút gọn của tài liệu. Xem và tải ngay bản đầy đủ của tài liệu tại đây (428.27 KB, 7 trang )
569
Ann. For. Sci. 61 (2004) 569–575
© INRA, EDP Sciences, 2004
DOI: 10.1051/forest:2004052
Original article
Development and characteristics of microsatellite markers
for sugi (Cryptomeria japonica D. Don) derived
from microsatellite-enriched libraries
Naoki TANI
a
, Tomokazu TAKAHASHI
b
, Tokuko UJINO-IHARA
a
, Hiroyoshi IWATA
a,c
,
Kensuke YOSHIMURA
a
, Yoshihiko TSUMURA
a
*
a
Department of Forest Genetics, Forestry and Forest Products Research Institute, Matsunosato, Tsukuba, Ibaraki 305-8687, Japan
b
Graduate School of Science and Technology, Niigata University, Ikarashi, Niigata 950-2181, Japan
c
Present address: National Agricultural Research Center, Kannondai, Tsukuba, Ibaraki 305-8666, Japan
(Received 11 July 2003; accepted 18 March 2004)
Abstract – We have developed a series of microsatellite markers for C. japonica. First, DNA fragments including microsatellite sequences
were isolated from two GA-enriched genomic libraries using magnetic beads. After eliminating redundant clones and clones in which the
tandem repeats were located too close to the cloning site to allow primers to be constructed, the remaining sequences could be examined for
their suitability for primer design. Primer sets were designed from each conserved sequence flanking the microsatellites. We found 1 479 unique
sequences in the enriched genomic libraries, of which 962 contained a tandem repeat motif, and we have been able to design 196 primer pairs
using these sequences to date. The potential of these primers to amplify single fragment, and the polymorphism of the sequences they amplify,
were investigated using a panel of 28 plus trees selected from Cryptomeria plantations covering the wide distributional range of the species in
Japan. Forty-two of the microsatellite markers displayed a polymorphic nature throughout this panel of 28 DNA samples. The polymorphic
information coefficients (PICs) ranged from 0.156 to 0.919. There was a significant correlation, between the number of repeats and the size of
the PICs, according to Kendall’s τ rank correlation coefficient analyses.
taxodiaceae / conifer / simple sequence repeat / enrichment / primer
Résumé – Développement et caractéristiques de marqueurs microsatellites pour le sugi (Cryptomeria japonica D. Don) trouvés dans des
banques microsatellites enrichies. Nous avons développé une série de marqueurs microsatellites pour Cryptomeria japonica. Dans un premier
temps, des fragments d’ADN comportant des séquences microsatellites ont été isolées à partir de 2 banques de séquences génomiques enrichies
en GA, grâce à l’utilisation de billes magnétiques. Puis, après avoir éliminé les clones redondants et les clones pour lesquels les séquences en
tandem étaient trop proches du site de clonage pour permettre aux amorces d’être construites, les séquences restantes ont été examinées afin de
determiner si elles convenaient pour la construction d’amorces. Des jeux d’amorces ont été conçus à partir de chaque séquence conservée flan-
quant les microsattelites. Nous avons trouvé 1479 séquences uniques dans les banques génomiques enrichies, parmi lesquelles 962 contenaient
1 motif répété en tandem, et à ce jour, nous avons pu concevoir 196 paires d’amorces en utilisant ces séquences. Les capacités de ces amorces
à amplifier un fragment unique, ainsi que le polymorphisme des séquences que nous avons amplifiées, ont été étudiées à partir d’un échantillon
de 28 arbres « plus » sélectionnés à partir de plantations de Cryptomeria couvrant la totalité de l’aire de répartition au Japon. Quarante-deux de
ces marqueurs microsatellites se sont révélés polymorphes au sein de cet échantillon. Les coefficients d’information sur le polymorphisme
(PIC : Polymorphism Information Coefficient) varient de 0.156 à 0.919. Les analyses de coefficients de corrélation de rangs de Kendall ont mis
en évidence une corrélation significative entre le nombre de répétitions et la valeur des PIC.
taxodiacée / conifère / répétition de séquence simple / enrichissement / amorce
1. INTRODUCTION
Microsatellites, also known as single sequence repeats
(SSRs), occur as tandem arrays of mono-, di-, tri-, tetra- or
penta-nucleotide repeat units in many plant and animal species
[30]. The variability of the number of repeat units at a particular
locus and the conservation of the sequences flanking the tan-
dem repeat make microsatellites valuable, codominant genetic
markers [30]. When microsatellite markers for a particular spe-
cies are developed, their capacity to be amplified by PCR
allows large-scale genotyping on automated DNA analyzers
for the construction of genetic linkage maps, and facilitates
studies of population genetics and reproduction ecology. For
these reasons, microsatellite markers have been developed for
* Corresponding author:
570 N. Tani et al.
use in analyses of a number of coniferous species (see, for
instance, [1, 3, 9, 10, 18, 20, 34, 36]).
Sugi (Cryptomeria japonica) is the most important forest
tree species in Japanese forestry. Plantations of the species are
widely distributed in Japan, from the southern part of Hokkaido
to Yaku-shima island off the coast of Kyushu. C. japonica has
been subjected to intensive genetic investigations, including
the construction of genetic linkage maps [14, 19, 22, 24, 28],
analysis of its genetic population structure and reproductive
systems [21, 27, 29, 31, 33], and development of genetic mark-
ers [14, 20, 32]. In a recent study, Moriguchi et al. [20] devel-
oped 34 microsatellite markers from a microsatellite-enriched
library and cDNA libraries for use in paternity analyses within
seed orchards of C. japonica. However, the number of micro-
satellite markers was insufficient to construct genetic linkage
maps, or for population genetic studies covering desired pro-
portions of the C. japonica genome. Use of multiple pedigrees
is an efficient approach for constructing genetic linkage maps
for species with allogamous characteristics, such as coniferous
species, and microsatellite markers can provide valuable
bridges when integrating independent genetic linkage maps
derived from different pedigrees. Therefore, we have continued
to develop additional microsatellite markers.
2. MATERIALS AND METHODS
2.1. Construction of microsatellite enrichment libraries
We successfully constructed or acquired two microsatellite-
enriched libraries. One, designated CS, was constructed by Genetic
Identification Service Inc. (Chatsworth, USA), and we constructed the
other, named CJS, as follows. Five micrograms of genomic DNA was
extracted from needles of a C. japonica tree growing in a nursery of
the Forestry and Forest Products Research Institute by the modified
CTAB method [23]. It was then purified by equilibrium centrifugation
in CsCl-ethidium bromide gradients [26] to construct an enriched mic-
rosatellite library according to modified methods published by
Armour et al. [2], Fleischer and Loew [12] and Fischer and Bachmann
[11]. The genomic DNA was digested with the restriction enzyme
NdeII, and fragments ranging from 300 to 1,000bp in size were ligated
into Sau3AI linkers (TaKaRa, Kyoto, Japan). DNA fragments with
linkers were resolved in binding buffer (10 mM Tris-HCl, 1 mM
EDTA, 100 mM NaCl, pH 7.5) and hybridized to 5’ biotin-labeled oli-
gonucleotide probes (5’biotin(CT)
15
3’) after denaturation. The DNA
molecules bound to the biotin-labeled probes were subsequently iso-
lated by binding them to streptavidin-coupled (M-280) Dynabeads
®
(Dynal Biotech, Oslo, Norway). After rinsing the beads in two kinds
of washing buffer (2× SSC, 0.1% SDS and 1× SSC, 0.1% SDS), target
DNAs were recovered by denaturing them in boiled water. The result-
ing fragments were then amplified by PCR and digested with NdeII
to remove the linkers. The enriched fragments selected in this way
were ligated into pUC118/BamHI (TaKaRa, Kyoto, Japan) and cloned
into competent cells (Escherichia coli DH5). Plasmids from these
clones were prepared using the Wizard
®
SV96 system (Promega,
Madison, USA) and sequenced using a 3100 DNA sequencer with a
BigDye Terminator kit (PE Applied Biosystems, Foster, USA).
2.2. Primer design, PCR and electrophoresis
Primer pairs were designed using OLIGO 5.0 software (Molecular
Biology Insights, Inc., Cascade, USA). Subsequent PCR amplification
was performed in 20 µL reaction volumes containing 0.2 µM of each
primer, 0.2 mM of each dNTP, 20 mM Tris-HCl (pH 8.4), 50 mM KCl,
1.5 mM MgCl
2
, 0.25 U of Taq DNA polymerase and 0.5–3 ng of tem-
plate DNA using a PTC200 DNA Engine Thermal Cycler with gradi-
ent temperature control (MJ Research, Inc., Waltham, USA). The
thermal program was as follows: 4 min at 94 °C, then 30–35 cycles
of 45 s at 94 °C, a 45 s gradient from 45 to 65 °C and 45 s at 72 °C,
finishing with 5 min at 72 °C. The fragments resulting from the PCR
amplifications were electrophoretically separated in 7.5% polyacry-
lamide gels and stained by ethidium bromide. They were then exam-
ined to identify primer pairs yielding clear single bands and to optimize
the annealing temperature and number of PCR cycles for each pair of
primers selected.
2.3. Plant materials, polymorphism and inheritance
of microsatellite markers in C. japonica
Microsatellite sequences detected from the two enriched libraries
were classified into three categories (perfect, imperfect and compound
repeats), as defined by Weber [35]. The potential value of these prim-
ers for use as microsatellite markers and for evaluating polymorphism
was investigated using a panel of DNAs from 28 plus trees (see Fig. 1)
selected from Cryptomeria japonica plantations covering the species’
wide distributional range in Japan. The segregation of alleles at 42 mic-
rosatellite loci was compared with expected Mendelian ratios by χ
2
tests. For this, a segregating population of 150 trees was produced from
a cross between two full-sib trees originating from a cross between
‘Iwao (female)’ and ‘Yabukuguri (male)’, which are local cultivars of
C. japonica. The DNAs were extracted from needle tissue using a
modified CTAB method [22]. PCR amplifications were carried out
using a GeneAmp PCR System Model 9700 (Applied Biosystems) in
a total volume of 20 µL including 0.2 µM of each primer, 0.2 mM of
each dNTP, 20 mM Tris-HCl (pH 8.4), 50 mM KCl, 1.5 mM MgCl
2
,
0.25 U of Taq DNA polymerase and 0.5–3 ng of template DNA, with
the following temperature profile: 4 min at 94 °C then 30–35 cycles
of 45 s at 94 °C, 45 s at 55–60 °C and 45 s at 72 °C, followed by 5 min
at 72 °C. PCR fragments amplified from these sample DNAs using
the microsatellite primers were electrophoretically separated on 7.5%
polyacrylamide gels, stained by ethidium bromide, and visualized
under a UV illuminator (Fig. 1).
2.4. Data analysis
From the genotype data of the 28 trees comprising the screening
panel, the number of alleles per locus (NA), and polymorphism infor-
mation content, PIC, [4], were obtained for each locus using the pro-
gram G-DIVERSE developed by H. Iwata. The PIC was calculated as
follows:
,
where, p
i
and p
j
refer to the frequency of alleles A
i
and A
j
, respectively,
and summation extends over l alleles.
The relationships between polymorphic parameters (NA and PIC)
and characteristics of the microsatellite sequences, such as the number
of repeats (NOR), the number of nucleotides per repeat (NNR), the
total number of nucleotides (TNN) and the number of nucleotides in
flanking regions of the microsatellites (NNF) were examined using
JMP 4 software (SAS Institute) to calculate Kendall’s rank correlation
coefficients [16].
PIC 2 P
i
P
j
1 P
i
P
j
–()[]
j 1=
i 1–
∑
i 2=
l
∑
=
Microsatellite markers for Cryptomeria japonica 571
3. RESULTS AND DISCUSSION
3.1. Sequences of clones from the two
microsatellite-enriched libraries
We sequenced 1079 clones from the CS library. The data
showed 413 (38.3%) of these clones to be redundant and 665
to be unique, 202 of which included microsatellite sequences.
By contrast, the CJS library showed a low redundancy ratio,
15.8%, and it contained 760 (out of a total of 814) unique
sequences that included microsatellite sequences. Thus, in
total, we obtained 962 unique sequences including microsatel-
lite motif sequences (Tab. I). In addition, we found di-nucle-
otide and tri-nucleotide repeat types of microsatellite motif
permutations in both of our libraries. The microsatellite
sequences were classified into microsatellite motif permuta-
tions according to Echt and May-Marquardt [8]. 46% (CS) and
87% (CJS) of the microsatellite sequences were assigned into
the poly(AG)n category of microsatellite sequence permuta-
tions, which we expected to find, since we used a (CT)n repeat
oligo-nucleotide probe for the enrichment of microsatellite
fragments. Nevertheless, despite using the (CT)n probe, 74 and
142 clones including microsatellite sequences with (AC) per-
mutations were detected in the CS and CJS libraries, respec-
tively. Most of the poly(AC)n sequences (21 in CS and 104 in
CJS) were accompanied with poly(CT)n sequences, explaining
why they were captured in the microsatellite-enriched libraries
by the (CT)n oligo-nucleotide probe. However, the other clones
with poly(AC)n sequences did not include any other microsat-
ellites with different types of motif. A large-scale survey of
microsatellite sequences in a rice genomic library found an esti-
mated 1360 poly(GA)n and 1230 poly(GT)n microsatellites in
the rice genome [25]. If C. japonica genome also possesses
abundant poly(AC)n microsatellites, as the rice genome appears
to do, it is possible that we detected microsatellites with this
type of motif by chance. We also detected two other di-nucle-
otide repeat types of motif and seven tri-nucleotide repeat types
of motif, but the number of microsatellites involved in these
cases was very small (Tab. II).
Microsatellite markers have been developed for various
coniferous species using microsatellite-enrichment methods
(see, for instance, [1, 10, 37]. Our successful construction of
microsatellite-enriched genomic libraries also showed that
enrichment using magnetic particles can promote the efficiency
of the development of large amounts of microsatellite markers
for coniferous species.
3.2. Characterization and polymorphisms
of microsatellite markers
PCR primer pairs were able to design for 196 clones, which
showed clear sequence and have enough sequence length for
the flanking region of SSR. Forty-two new primers that performed
as microsatellite markers were chosen out of the 196 primer
pairs we constructed because they detected polymorphisms
and gave clear banding patterns when subjected to 7.5%
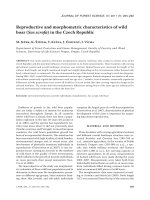
Figure 1. Microsatellite markers, CJS0333 and CS1895, developed for surveying levels of polymorphism in the panel of 28 plus trees, electro-
phoretically separated in 7.5% polyacrylamide gels. M stands for marker lanes. Lanes 1 to 28, numbered from right to left, correspond to: 1,
Hamamatsu 1; 2, Nishikawa 16; 3, Gifu 2; 4, Higashiusuki 14; 5, Gujyo 5; 6, Kusu 12; 7, Fukuokasho 2; 8, Satsuma 3; 9, Ishikawa 5; 10, Syo-
chiku 6; 11, Tone 6; 12, Haara; 13, Kumotoshi; 14, F1 of Kumotoshi × Haara; 15, Minaminasu 3; 16, Takasaki 4; 17, Numata 4; 18, Kuji 3;
19, Inashiki 2; 20, Hiki 13; 21, Nagano 2; 22, Ohi 2; 23, Tenryu 6; 24, Minamiaizu 1; 25, Imaichi 2; 26, Ohtsuki 5; 27, Higashikamo 8; 28,
Nukata 3, respectively.
Table I. Results of sequencing SSR-enriched genomic libraries from
Cryptomeria japonica.
Designation
of genomic
library
Number
of clones
sequenced
Number of clones
with unique
sequences
Number of clones
with unique
sequence and SSRs
CS 1 079 665 202
CJS 967 814 760
Total 2 046 1 479 962
572 N. Tani et al.
polyacrylamide electrophoresis (Fig. 1). The primer sequences
and PCR conditions for these loci are listed in Table III. The
panel of 28 plus trees allowed the polymorphic levels at these
loci to be evaluated using two statistics: the number of alleles
per locus (NA) and the polymorphism information content
(PIC). NA and PIC values generated from the 28 plus trees
ranged from 3 to 20 with an average of 7.38, and from 0.156
to 0.919 with an average of 0.620, respectively (Tab. IV). We
then examined the correlations between two measures of poly-
morphic levels (NA and PIC) on one hand, and two measures
of the length of repeat unit (NOR and NNR), total number of
nucleotides (TNN) and a measure of the number of nucleotides
in flanking regions of microsatellites (NNF) on the other by
Kendall’s rank order tests. The degree of polymorphism,
according to the derived PIC and NA values, was strongly cor-
related to the length of the repeat units (NOR and NNR). How-
ever, there was no correlation between the polymorphic level
and both the total number of nucleotides (TNN) and the length
of the flanking region (NNF; Tab. V). In some previous char-
acterizations of microsatellite sequences, evidence for not only
nucleotide substitutions, but also indels has been detected in
flanking sequences of microsatellites [6, 17]. However, muta-
tions in the flanking regions of the microsatellites do not appear
to have affected the degree of polymorphism amongst the mic-
rosatellite markers we studied at a statistically significant level
according to the Kendall’s correlation analysis. Most of the
length variation of the PCR products from microsatellite mark-
ers might depend upon slippage mutations of the microsatellite
sequences.
3.3. Segregation analysis
Segregation in the sib-crossed pedigree was assessed at
42 microsatellite loci (Tab. IV). Twenty-eight and 14 loci were
found to be polymorphic and monomorphic in the investigated
pedigree, respectively. According to the results of the χ
2
tests,
no statistically significant deviations were detected at 26 mic-
rosatellite loci. However, we detected statistically significant
deviations (at the 5% probability level) at two microsatellite
loci, CS2260 and CS2294. The expected segregation ratio at the
CS2260 locus was 1:1, because one of the parents was a heter-
ozygote and the other was a homozygote. The expected segre-
gation ratio at the CS2294 locus was 1:2:1, because both
parents were heterozygous, with the same genotype. For both
of the microsatellite loci showing evidence of segregation dis-
tortion, we detected heterozygote excess in 150 individuals of
the segregation generation. Inbreeding depression due to the
sib-cross or to random chance may have been responsible for
this segregation distortion. We detected null alleles (non-
amplifying alleles) that may have been due to mutation at the
priming sequence at only four loci [5, 15]. By contrast,
Moriguchi et al. [20] detected null alleles at 12 out of 34 loci
developed (35.3%) in a previous segregation analysis using the
same pedigree as in this study, and deduced that the high rate
of null allele detection was caused by a high mutation rate at
Table II. Summary of numbers of SSRs found in two genomic libraries enrichied by the CT repeat probe. Roman numbers showed a kind of
repeat motif of dinucleotide or trinucleotide. The dinucleotide and trinucleotide repeats have four and six kinds of motif, respectively, thus, the
roman numers are corresponding to their motifs.
Dinucleotide repeat CS CJS
I II III IV Abbreviation I II III IV Total I II III IV Total
AC CA or GT TG (AC) 18 12 32 12 74 15 22 62 43 142
AG GA or CT TC (AG) 66 43 7 11 127 604 410 134 132 1 280
AT TA (self complementary) (AT) 12 3 12 4 16
CG GC (self complementary) (CG) 00 0 4 4 8
Sub-total number of SSRs 204 1 446
Trinucleotide repeat
I II III IV V VI I II III IV V VI Total I II III IV V VI Total
AAC CAA ACA or GTT TTG TGT (AAC) 011
AAG AGA GAA or CTT TCT TTC (AAG) 545331 21 1 4 9 3 3 20
AAT ATA TAA or ATT TAT TTA (AAT) 00
ACC CCA CAC or GGT TGG GTG (ACC) 11 0
ACG CGA GAC or CGT TCG GTC (ACG) 00
ACT CTA TAC or AGT TAG GTA (ACT) 12 1 13 1 1 2
AGC GCA CAG or GCT TGC CTG (AGC) 02 1 3
AGG GGA GAG or CCT TCC CTC (AGG) 9 4 11 24 8 1 3 12
ATC TCA CAT or GAT TGA ATG (ATC) 112 13 1 1 1 3
CCG CGC GCC or CGG GCG GGC (CCG) 00
Sub total number of SSRs 72 41
Total number of SSRs 276 1 487
Microsatellite markers for Cryptomeria japonica 573
Table III. Description of sugi microsatellite markers.
Locus Forward primer
5' to 3'
Reverse primer
5' to 3'
Anneal
temp.
PCR
cycle
DDBJ
accession No.
Motif Putative
size (bp)
a
Repeat
status
CJS0002 CTTTTTTCAAATTTAGTGATGT CCCATGCCCCACTGTCCACC 55 30 AB161634 (TC)12(TC)17 237 Imperfect
CJS0091 GAGAGATAAGAGGGTAGAGGT CAATGCCAACTTAGAAGAC 60 30 AB161635 (GA)43 298 Perfect
CJS0268 CCTTAGAAAGCTATGCCAC GCAACGCATCCATAATACC 60 30 AB161636 (AC)53 352 Perfect
CJS0331 GGAGAGATAGACGACAAAAGAG CCATCTTGCTAATCTGTCC 60 30 AB161637 (GA)6 245 Perfect
CJS0333 AGGAGATTAGGATGGTGGG GGTTTGCCTCTTCTATGAG 60 30 AB161638 (GA)26 264 Perfect
CJS0336 CAGGGAGTGGTTAAGGGAG CTTCCATCTCTTCCCATCTC 60 30 AB161639 (GA)11(GA)40 259 Compound
CJS0356 CTAAAGAATAGATGACTCCAC TATAACGCTTTTGCCCTCA 60 30 AB161640 (GA)64 337 Perfect
CJS0401 GATCTAAACTTGAGCATAAC CAATCCTGTCTCCATACCC 55 30 AB161641 (CG)8(GA)54 222 Compound
CJS0455 GTTACTTTGAAAAATGAGCC AACATCAAGATTAAAGGGAC 58 30 AB161642 (CT)20 166 Perfect
CJS0485 CATATCTAATATCTAATACCTTG TCTCCCTATCTAGCCCTCTG 50 35 AB161643 (GA)9(GA)30(GA)
27
331 Compound
CJS0520 TCCCTTTTGGTATTTTACAC ACTCAAATTGCGATAATCTC 55 30 AB161644 (TG)18 196 Perfect
CJS0527 ATAGAAGAAGAGAAGTAGGG TCATATCGTGTCATGTGTCC 55 30 AB161645 (GA)18 103 Perfect
CJS0537 ATGAAGGGAATGATTGATGG TCTCTCACTTGGGTTCTCTC 55 30 AB161646 (GA)34(AG)6 163 Compound
CJS0584 TGGTTTGCCTTTGGTTGCTC GGACTTTCTATTTACCTCTTGG 60 30 AB161647 (AG)80 329 Perfect
CJS0665 CCAAGCATAGGGAAAAAGAG GGGGAGTAAGGATGACATTT 60 30 AB161648 (GA)45(GA)29 367 Imperfect
CJS0686 ACATGCAAATATAAGTTCACCC TCCACCTCTTTTTCATTCTC 55 30 AB161649 (GA)52 275 Perfect
CJS0838 TATGTAGAAGCGTGTGATGT GATAATTGCCTTTGTTGTCC 58 30 AB161650 (GT)23 170 Perfect
CJS0955 CACACTCCCCGTCTCCGACAG ACCCTGATTCCCCATACACC 58 30 AB161651 (TCT)4(GA)29 137 Compound
CS1218 CATCACATACAAATAGCACC GAAGATTGTCTCACGCACTC 60 30 AB161652 (GT)13 332 Perfect
CS1219 AAGGTGTTGTTTTAAGGAGG CAGCCATCTATTATTTGTGC 60 30 AB161653 (GT)10 103 Perfect
CS1226 CTCTAGTCCTCAATGGTGGT TATTAAGCATTTTCCCTCTC 60 35 AB161654 (CA)14 139 Perfect
CS1281 CCCCCTCTCATTAGTTACCA CAAAAATCAACAAGCCAACC 60 30 AB161655 (CT)15 233 Perfect
CS1289 CATCCACCACTAAATACAAC TCGCTATCCCTTGCCTATCC 60 35 AB161656 (AC)26(A)26 147 Compound
CS1364 TGATTATGGTCGGTGGTCTT GTGATGTGGTGTTATCTTGT 62 30 AB161657 (AC)7 297 Perfect
CS1450 GGCATTAAACCATCAAGACA AGTTGGGCAGAGATCATAAG 62 35 AB161658 (TG)9 401 Perfect
CS1522 AAAGTTTGATTAGGGCAGGG AAACGTGGGTGCTATCCTTC 62 30 AB161659 (AC)16 222 Perfect
CS1525 ATGAAGTGCCCTTGGTTTGT ATCGCCTCCTCTTTTATCCT 60 30 AB161660 (CA)18 200 Perfect
CS1579 ACTCTAGCAGCATTTCTCAC CAGATTTTGTATGAGTGGTT 60 30 AB161661 (TG)11 291 Perfect
CS1671 ACTTGTCCGCTTTTGTTGTT GCCTCAAGGTAGGAGAAGAA 60 30 AB161662 (TG)16 280 Perfect
CS1737 TACCCTCAACCCTTCACCCT TTACCCACCTCTCTTTCCTC 60 30 AB161663 (AG)40 248 Perfect
CS1895 TGAGAGAGGGAGGGAGGGTT GAGTCCTTGTCCCGTTTTGT 60 30 AB161664 (TG)10 405 Perfect
CS1906 AGTCATTCCCAGGCAGTGTC ATCCCTCCACCTCTCCTACC 60 30 AB161665 (TGA)6 346 Perfect
CS2024 AGTAATACAAGATAAGGGAG TCCACCTCTATACCTCTACA 55 30 AB161666 (AG)15(AG)4(AG)
10
314 Imperfect
CS2048 CCCTCTATCTTCATCTCTTC AGGGATAGATATAGGGGTAG 60 30 AB161667 (CT)7 225 Perfect
CS2056 GAGAGACATGGGGGAAGAGG GGTTCTAACACATGAATGGC 60 30 AB161668 (GA)20(GA)7 295 Compound
CS2165 GAGAGAGGTTTGAAGAGAGA CCCTCATCTTCTATCAACTC 60 35 AB161669 (AG)6(GA)30(AG)
40(GA)7(GA)25
395 Compound
CS2169 GTAGAGGAGGGATATAGAGT TCCTTGTCCATCTCTCTTTA 55 30 AB161670 (GA)9 141 Perfect
CS2230 AGACATAAAGAGGGAGGTAGAG TACTCTTGCTGACTGGTCCG 60 30 AB161671 (GA)9 119 Perfect
CS2245 GAGGCAAAGGTAGAGGTGAA CCCTCCCAAGTTCTAAGTAA 60 30 AB161672 (GA)9 167 Perfect
CS2260 GGAGGGTAGATAGAGAAAATAG TCTACCTACCTCTCTTCCCA 60 30 AB161673 (GA)39 206 Perfect
CS2294 TTTCCTCTTCCATCTCACCC TCATGCTCCATTACGAATCT 60 30 AB161674 (CT)30 129 Perfect
CS2484 TGAGAAAGGGAGAGAGGGAT CCCCCTTCTCTTTTTCACTC 60 30 AB161675 (GA)13 158 Perfect
a
Putative PCR fragment sizes were deduced from sequences of genomic clones between forward and reverse primers.
574 N. Tani et al.
the priming sequences in C. japonica. Our low rate of null allele
detection suggests that the high mutation rate at priming
sequences is not pandemic in this species. Null alleles can cause
a number of problems, such as underestimations of the number
of heterozygotes in population genetic studies of natural pop-
ulations, overestimates of the inbreeding rate in mating system
analysis using open-pollinated seeds, and underestimates of
pollen dispersal distance in paternity analyses. Our newly
developed microsatellite markers revealed a lower rate of null
allele detection than the microsatellite markers previously
developed by Moriguchi et al. [20]. Therefore, these markers
are likely to be valuable tools, not only for genetic mapping,
but also for analyses of population genetics and reproduction
ecology in natural populations [7, 13].
Acknowledgements: The authors wish to thank to K. Mikuni, K.
Iwata, M. Ishiki and Y. Taguchi for laboratory assistance. We are
grateful to S. Ueno, T. Sugaya and Y. Moriguchi for helpful advice
about the development of the microsatellite-enriched library. We also
thank to D. Pot and S.C. González-Martínez for translation of the
summary to French. This study was supported by grants from the
Program for Promotion of Basic Research Activities for Innovative
Biosciences (PROBRAIN) and the Pioneer Special Study of the
Ministry of Agriculture, Forestry and Fisheries in Japan.
REFERENCES
[1] Amarasinghe V., Carlson J.E., The development of microsatellite
DNA markers for genetic analysis in Douglas-fir, Can. J. For. Res.
32 (2002) 1904–1915.
[2] Armour J.A.L., Neumann R., Gobert S., Jeffreys A.J., Isolation of
human simple repeat loci by hybridization selection, Hum. Mol.
Genet. 3 (1994) 599–605.
[3] Besnard G., Achere V., Rampant P.F., Favre J.M., Jeandroz S., A
set of cross-species amplifying microsatellite markers developed
from DNA sequence databanks in Picea (Pinaceae), Mol. Ecol.
Notes 3 (2003) 380–383.
[4] Bostein D., White R.L., Skolnick M., Davis R.W., Construction of
a genetic linkage map in man using restriction fragment length
polymorphisms, Am. J. Hum. Genet. 32 (1980) 314–331.
[5] Callen D.F., Thompson A.D., Shen Y., Phillips H.A., Richards R.I.,
Mulley J.C., Sutherland G.R., Incidence and origin of “null” alleles
in the (AC)
n
microsatellite markers, Am. J. Hum. Genet. 52 (1993)
922–927.
Table IV. Polymorphic level and deviation from Hardy-Weinberg
expectation of microsatellite markers with more than two alleles in
28 screening panel samples.
Marker NA PIC Segregation Expected χ
2
Probability
CJS0002 10 0.779 38:28:39:39 1:1:1:1 2.389 0.496
CJS0091 9 0.807 41:35:30:37 1:1:1:1 1.755 0.625
CJS0268 11 0.591 74:74 1:1 0.000 1.000
CJS0331 3 0.160 76:71 1:1 0.170 0.680
CJS0333 10 0.850 39:45:34:31 1:1:1:1 3.027 0.388
CJS0336 9 0.734 Invariant – – –
CJS0356 8 0.754 41:39:39:27 1:1:1:1 3.370 0.338
CJS0401 9 0.817 42:34:32:27 1:1:1:1 3.459 0.326
CJS0455 6 0.540 80:70 1:1 0.667 0.414
CJS0485 9 0.825 31:86:31 1:2:1 3.892 0.143
CJS0520 5 0.408 76:72 1:1 0.108 0.742
CJS0527 3 0.526 Invariant – – –
CJS0537 10 0.837 Invariant – – –
CJS0584 9 0.794 28:40:38:41 1:1:1:1 2.905 0.407
CJS0665 8 0.733 33:32:43:39 1:1:1:1 2.197 0.532
CJS0686 6 0.729 72:78 1:1 0.240 0.624
CJS0838 8 0.736 73:73 1:1 0.000 1.000
CJS0955 5 0.664 72:75 1:1 0.061 0.805
CS1218 3 0.181 Invariant – – –
CS1219 6 0.351 Invariant – – –
CS1226 6 0.731 77:66 1:1 0.846 0.358
CS1281 8 0.768 31:44:40:35 1:1:1:1 2.587 0.460
CS1289 10 0.834 Invariant – – –
CS1364 4 0.433 Invariant – – –
CS1450 3 0.234 Invariant – – –
CS1522 9 0.744 63:87 1:1 3.840 0.050
CS1525 8 0.461 30:75:34 1:2:1 1.101 0.577
CS1579 4 0.438 84:66 1:1 2.160 0.142
CS1671 6 0.394 Invariant – – –
CS1737 10 0.864 42:40:35:31 1:1:1:1 2.000 0.572
CS1895 10 0.801 41:39:29:36 1:1:1:1 2.283 0.516
CS1906 3 0.156 Invariant – – –
CS2024 20 0.919 38:33:37:39 1:1:1:1 0.565 0.904
CS2048 4 0.246 Invariant – – –
CS2056 6 0.727 83:66 1:1 1.940 0.164
CS2165 15 0.908 Invariant – – –
CS2169 7 0.636 65:85 1:1 2.667 0.102
CS2230 3 0.334 Invariant – – –
CS2245 3 0.308 Invariant – – –
CS2260 10 0.859 57:94 1:1 9.066 0.003
CS2284 10 0.823 78:70 1:1 0.432 0.511
CS2294 4 0.601 44:99:8 1:2:1 31.795 0.000
Table V. Rank correlation coefficients [Kendall's (Kendall 1970)],
between two measures of variation (the number of alleles (NA) and
polymorphism information content (PIC)) on one hand, and four
measures of length [the number of repeats (NOR), the number of
nucleotides per repeat (NNR), total number of nucleotides (TNN)
and the number of nucleotides in the microsatellites' flanking regions
(NNF)] on the other.
NOR NNR TNN NNF
NA 0.3973*** 0.4987*** 0.0570 –0.0655
PIC 0.4447*** 0.5230*** 0.1357 –0.1468
Microsatellite markers for Cryptomeria japonica 575
[6] Decroocq V., Favé M.G., Hagen L., Bordenave L., Decroocq S.,
Development and transferability of apricot and grape EST microsa-
tellite markers across taxa, Theor. Appl. Genet. 106 (2003) 912–
922.
[7] Derory J., Mariette S., Gonzaléz-Martínez S.C., Chagn D., Madura
D., Gerbera S., Brach J., Persyn F., Ribeiro M.M., Plomiona C.,
What can nuclear microsatellites tell us about maritime pine genetic
resources conservation and provenance certification strategies?
Ann. For. Sci. 59 (2002) 699–708.
[8] Echt C.S., May-Marquardt P., Survey of microsatellite DNA in
pine, Genome 40 (1997) 9–17.
[9] Echt C.S., May-Marquardt P., Hseih M., Zahorchak R., Characteri-
zation of microsatellite markers in eastern white pine, Genome 39
(1996) 1102–1108.
[10] Elsik C.G., Williams C.G., Low-copy microsatellite recovery from
a conifer genome, Theor. Appl. Genet. 103 (2001) 1189–1195.
[11] Fischer D., Bachmann K., Microsatellite enrichment in organisms
with large genomes (Allium cepa L.), Biotechniques 24 (1998)
796–802.
[12] Fleischer R.C., Loew S., Construction and screening of microsatel-
lite-enriched genomic libraries, in: Ferraris J., Palumbi S. (Eds.),
Molecular zoology: advances, strategies and protocols, Wiley-Liss,
New York, 1995, pp. 459–468.
[13] González-Martínez S.C., Gerber S., Cervera M.T., Martínez-Zapater
J.M., Alía R., Gil L., Selfing and sibship structure in a two-cohort
stand of maritime pine (Pinus pinaster Ait.) using nuclear SSR mar-
kers, Ann. For. Sci. 60 (2003) 115–121.
[14] Iwata H., Ujino-Ihara T., Yoshimura K., Nagasaka K., Mukai Y.,
Tsumura Y., Cleaved amplified polymorphic sequence markers in
sugi, Cryptomeria japonica D. Don, and their locations on a linkage
map, Theor. Appl. Genet. 103 (2001) 881–895.
[15] Jones A.G., Stockwell C.A., Walker D., Avise J.C., The molecular
basis of a microsatellite null allele from the white sands pupfish, J.
Hered. 89 (1998) 339–342.
[16] Kendall M.D., Rank Correlation Methods, 3rd ed., Charles Griffin,
1970, London.
[17] Kölliker R., Jones E.S., Drayton M.C., Dupal M.P., Forster J.W.,
Development and characterisation of simple sequence repeat (SSR)
markers for white clover (Trifolium repens L.), Theor. Appl. Genet.
102 (2001) 416–424.
[18] Kostia S., Varvio S.L., Vakkari P., Pulkkinen P., Microsatellite
sequences in Pinus sylvestris, Genome 38 (1995) 1244–1248.
[19] Kuramoto N., Kondo T., Fujisawa Y., Nakata R., Hayashi E., Goto
Y., Detection of quantitative trait loci for wood strength in Crypto-
meria japonica, Can. J. For. Res. 30 (2000) 1525–1533.
[20] Moriguchi Y., Iwata H., Ujino-Ihara T., Yoshimura K., Taira H.,
Tsumura Y., Development and characterization of microsatellite
markers for Cryptomeria japonica D. Don, Theor. Appl. Genet. 106
(2003) 751–758.
[21] Moriguchi Y., Matsumoto A., Saito M., Tsumura Y., Taira H.,
DNA analysis of clonal structure of an old growth, isolated forest
of Cryptomeria japonica in a snowy region, Can. J. For. Res. 31
(2001) 377–383.
[22] Mukai Y., Suyama Y., Tsumura Y., Kawahara T., Yoshimaru H.,
Kondo T., Tomaru N., Kuramoto N., Murai M., A linkage map for
sugi (Cryptomeria japonica) based on RFLP, RAPD, and isozyme
loci, Theor. Appl. Genet. 90 (1995) 835–840.
[23] Murray M.G., Thompson W.F., Rapid isolation of high molecular
weight plant DNA, Nucleic Acids Res. 8 (1980) 4321–4325.
[24] Nikaido A.M., Ujino T., Iwata H., Yoshimura K., Yoshimaru H.,
Suyama Y., Murai M., Nagasaka K., Tsumura Y., AFLP and CAPS
linkage maps of Cryptomeria japonica, Theor. Appl. Genet. 100
(2000) 825–831.
[25] Panaud O., Chen X.L., McCouch S.R., Frequency of microsatellite
sequences in rice (Oryza sativa L.), Genome 38 (1995) 1170–1176.
[26] Sambrook J., Russell D.W., Molecular Cloning: a Laboratory
Manual, 3rd ed., Cold Spring Harbor Laboratory Press, New York,
2001.
[27] Taira H., Tsumura Y., Tomaru N., Ohba K., Regeneration system
and genetic diversity of Cryptomeria japonica growing at different
altitudes, Can. J. For. Res. 27 (1997) 447–452.
[28] Tani N., Takahashi T., Iwata H., Mukai Y., Ujino-Ihara T., Matsumoto
A., Yoshimura K., Yoshimaru H., Murai M., Nagasaka K., Tsumura
Y., A consensus linkage map for sugi (Cryptomeria japonica) from
two pedigrees, based on microsatellites and expressed sequence
tags, Genetics 165 (2003) 1551–1568.
[29] Tani N., Tsumura Y., Sato H., Nuclear gene sequences and DNA
variation of Cryptomeria japonica samples from the postglacial
period, Mol. Ecol. 12 (2003) 859–868.
[30] Tautz D., Hypervariability of simple sequences as a general source
for polymorphic DNA markers, Nucleic Acids Res. 17 (1989)
6463–6471.
[31] Tomaru N., Tsumura Y., Ohba K., Genetic variation and population
differentiation in natural populations of Cryptomeria japonica,
Plant Species Biol. 9 (1994) 191–199.
[32] Tsumura Y., Suyama Y., Yoshimura K., Shirato N., Mukai Y.,
Sequence-tagged-sites (STSs) of cDNA clones in Cryptomeria
japonica and their evaluation as molecular markers in conifers,
Theor. Appl. Genet. 94 (1997) 764–772.
[33] Tsumura Y., Tomaru N., Genetic diversity of Cryptomeria japo-
nica using co-dominant DNA markers based on sequenced-tagged
sites, Theor. Appl. Genet. 98 (1999) 6396–404.
[34] Vandeven W.T.G., McNicol R.J., Microsatellites as DNA markers
in Sitka spruce, Theor. Appl. Genet. 93 (1996) 613–617.
[35] Weber J.L., Informativeness of human (dC – dA)n (dG – dT)n
polymorphisms, Genomics 7 (1990) 524–530.
[36] Yazdani R., Scotti I., Jansson G., Plomion C., Mathur G., Inheri-
tance and diversity of simple sequence repeat (SSR) microsatellite
markers in various families of Picea abies, Hereditas 138 (2003)
219–227.
[37] Zhou Y., Bui T., Auckland L.D., Williams C.G., Undermethylated
DNA as a source of microsatellites from conifer genome, Genome
45 (2002) 91–99.