Báo cáo lâm nghiệp: "Fine root distribution, seasonal pattern and production in four plantations compared with a natural forest in Subtropical China" docx
Bạn đang xem bản rút gọn của tài liệu. Xem và tải ngay bản đầy đủ của tài liệu tại đây (415.4 KB, 11 trang )
617
Ann. For. Sci. 61 (2004) 617–627
© INRA, EDP Sciences, 2004
DOI: 10.1051/forest:2004062
Original article
Fine root distribution, seasonal pattern and production in four
plantations compared with a natural forest in Subtropical China
Yu-Sheng YANG
a
*, Guang-Shui CHEN
a
, Peng LIN
b
, Jin-Sheng XIE
c
, Jian-Fen GUO
a
a
Dept. of Geography Science, Fujian Normal University, Fuzhou 350007, China
b
Dept. of Life Science, Xiamen University, Xiamen 361005, China
c
Dept. of Forestry, Fujian Agriculture and Forestry University, Fuzhou 350002, China
(Received 12 May 2003; accepted 20 August 2003)
Abstract – Fine root (< 2 mm in diameter) distribution, seasonal pattern and net production were studied during 1999–2001 in 33 year-old
plantations of two coniferous trees, Chinese fir (Cunninghamia lanceolata, CF) and Fokienia hodginsii (FH) and two broadleaved trees,
Ormosia xylocarpa (OX) and Castanopsis kawakamii (CK), and compared with that of an adjacent natural forest of Castanopsis kawakamii
(NF, ~150 year old) in Sanming, Fujian, China. Fine root biomass and necromass were determined by soil coring at a bimonthly interval. Soil
cores were divided into 10 depths: 0 ~ 10, 10 ~ 20, 20 ~ 30, 30 ~ 40, 40 ~ 50, 50 ~ 60, 60 ~ 70, 70 ~ 80, 80 ~ 90, and 90 ~ 100 cm. Litter bags
(18 × 18 cm
2
size, 0.25 mm mesh) were used in determination the decay rates of fine roots (< 0.5 mm, 0.5–1 mm, and 1–2 mm). Mean annual
fine-root production, mortality, decomposition and turnover rate were calculated by the compartment-flow method. Mean fine-root biomass
ranged from 1.49 Mg ha
–1
in the CF to 4.94 Mg ha
–1
in the NF, and decreased in the following order: NF > CK > FH > OX > CF. There were
significant seasonal changes of biomass and necromass in all stands (P < 0.05), while no significant yearly fluctuations were detected (P > 0.05).
In all stands, an early spring (March) peak of fine root biomass was found, and the minimum value occurred mainly in dry summer or cold
winter. For the NF, 59.8% of fine root biomass was found in the top soil of 0–10 cm, a layer that maximum difference of depth distribution
among all stands occurred, where fine root biomass of the NF was 2.37 times, 3.55 times, 8.12 times, and 7.12 times as much as those of the
CK, FH, CF, and OX, respectively. Percentages of original mass lost during the first year of decomposition ranged from 43% to 56% for the
FH to 68% to 80% for the NF. Mean annual root decomposition, mortality and production ranged from 8.47 Mg ha
–1
a
–1
, 8.63 Mg ha
–1
a
–1
and
9.5 Mg ha
–1
a
–1
in the NF to 2.50, 2.49 and 2.51 Mg ha
–1
a
–1
in the CF, ranked as NF > CK > FH > OX > CF. The mean root turnover rate
ranged from 1.48 a
–1
in the FH to 1.78 a
–1
in the NF.
fine root / seasonal pattern / root distribution / root production / root mortality / root turnover / natural forest / monoculture plantation
Résumé – Répartition et production de radicelles et évolutions saisonnières dans quatre plantations en comparaison avec une forêt
naturelle, en Chine tropicale. La répartition, l’évolution selon les saisons et la production nette de radicelles (< 2mm en diamètre) ont été
étudiées de 1999 à 2001 dans deux plantations âgées de 33 ans de deux conifères, le sapin de Chine (Cunninghamia lancolata, CF) et Fokienia
hodginsii (FH) ainsi que dans deux plantations de feuillus, Ormosia xylocarpa (OX) et Castanopsis kawakamii (CK). Celles-ci ont été
comparées à une forêt naturelle voisine de Castanopsis kawakamii (NF, 150 ans) à Samming, Fujian, Chine. La biomasse et la nécromasse de
radicelles ont été obtenues par carottage dans le sol effectué deux fois par mois. Les carottes de sol ont été divisées en 10 éléments selon la
profondeur : 0 ~ 10, 10 ~ 20, 20 ~ 30, 30 ~ 40, 40 ~ 50, 50 ~ 60, 60 ~ 70, 70 ~ 80, 80 ~ 90, et 90 ~ 100 cm. On a utilisé des sacs à litière
(18 × 18 cm
2
, maille de 0,25 mm) pour déterminer le taux de décomposition des radicelles (< 0,5 mm, 0,5–1 mm, 1–2 mm). Les taux de
production moyenne annuelle, de mortalité, de décomposition et de turnover des radicelles ont été calculés par la méthode de « compartment
flow ». La biomasse moyenne de radicelles va de 1,49 Mg/ha dans le CF à 4,94 Mg/ha pour le NF ; elle décroît dans l’ordre suivant: NF > CK >
FH > OX > CF. On a enregistré des différences significatives de biomasse et nécromasse, selon les saisons dans tous les peuplements (P < 0,05),
tandis qu’aucune fluctuation n’a pu être mise en évidence entre années (P > 0,05). Pour tous les peuplements, on enregistre un pic de biomasse
de radicelles au début du printemps (mars), les valeurs minimum intervenant au cours d’étés secs ou d’hivers froids. Pour le NF, 59,8 % de la
biomasse de radicelles se situe dans la zone superficielle du sol (0–10 cm) où les différences de biomasse de radicelles entre peuplements sont
les plus marquées, les valeurs pour NF étant respectivement 2,37 fois, 3,55 fois, 8,12 fois et 17,12 fois plus élevées que celles de CK, FH, CF,
et OX. Les pourcentages de la biomasse d’origine, perdue pendant la première année de décomposition, vont de 43 % à 56 % pour FH, de 68 à 80 %
pour NF. Les moyennes annuelles de décomposition, mortalité et production des racines s’étagent entre 8,47 Mg ha
–1
a
–1
, 8,63 Mg ha
–1
a
–1
et
9,5 Mg ha
–1
a
–1
dans le NF à 2,50, 2,49 et 2,51 Mg ha
–1
a
–1
pour le CF, avec par ordre décroissant, NF > CK > FH > OX > CF. Le taux de
turnover de racines va de 1,48 a
–1
pour FH à 1,78 a
–1
pour NF.
radicelle / variation saisonnière / répartition des racines / production racinaire / mortalité racinaire / turnover racinaire / forêt naturelle /
plantation en monoculture
* Corresponding author: ;
618 Y.S. Yang et al.
1. INTRODUCTION
Fine root productivity often exceeds aboveground produc-
tivity in forest ecosystems, despite the fact that live fine root
biomass constitutes only a small fraction of total stand biomass
[8, 11, 15, 22, 28, 35]. It is widely recognized that the turnover
and decomposition of fine roots and associated mycorrhizae
may contribute substantially more to soil organic matter (SOM)
and nutrient pools than do aboveground litter-fall inputs [1, 7,
11, 22, 35]. Despite a wealth of information on fine roots in dif-
ferent forest ecosystems of the world has been compiled,
largely in temperate and tropical forests, a relative few studies
were carried out in forests of southern China, an area of the most
important world subtropical forests.
In southern China, where high rainfall, steep slopes, and
fragile soil are characteristic, large-scale of native forests have
been converted to monoculture plantations (mainly economical
conifers) following forest land clear-cutting, slash burning, and
soil preparation. Yield decline and land deterioration have
become noticeable during this conversion, and how to mainte-
nance of soil fertility in these managed plantations has received
considerable attention [41–43]. Currently, there is little known
about the effects of forest conversion on fine root dynamics.
The establishment of tree species trials during 1960s at the
Xinkou Experimental Forestry Centre in south-eastern China
provided a unique opportunity to examine how tree plantations
altered fine root performance.
The objective of this study was initiated to determine in four
plantation forests of Cunninghamia lanceolata (Chinese fir,
CF), Fokienia hodginsii (FH), Ormosia xylocarpa (OX) and
Castanopsis kawakamii (CK), and an adjacent natural forest of
Castanopsis kawakamii (NF): (1) fine-root biomass, distribu-
tion and seasonal patterns; and (2) fine-root production and
mortality.
2. MATERIALS AND METHODS
2.1. Site descriptions
The study was carried out from January 1999 to December 2001
in the Xiaohu work-area of the Xinkou Experimental Forestry Centre
of Fujian Agricultural and Forestry University, Sanming, Fujian,
China ( 26° 11’ 30 N, 117° 26’ 00 E). It borders the Daiyun Mountain
on the southeast, and the Wuyi Mountain on the northwest. The region
has a middle subtropical monsoonal climate, with a mean annual tem-
perature of 19.1 °C and a mean relative humidity of 81%. The mean
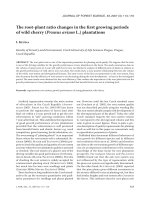
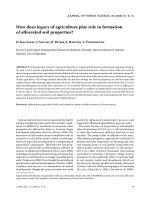
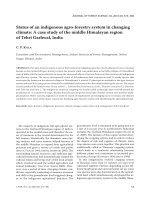
annual precipitation is 1749 mm, mainly occurring from March to
August (Fig. 1). Mean annual actual evapotranspiration is 1585 mm
[38, 40]. The growing season is relatively long with an annual frost-
free period of around 330 days. The parent material of the soil is acid
sandy shale and soils are classified as red soil (humic Planosols in FAO
system). Thickness of the soil usually exceeds 1.0 m. In 1999, five
20 × 20 m
2
plots per forest were randomly established at the mid-slope
position of the CF, FH, OX, CK, and NF.
Selected forest characteristics and some properties of the surface
soil (0–20 cm) of the five sites are described in Table I [40].
The NF represents the evergreen, broadleaved C. kawakamii forest
in mid-subtropical China with high purity (85% of total stand basal
area for C. kawakamii), old age (~ 150 year), and large area (~ 700 ha)
[18, 46]. The floristic composition is very abundant (total 139 species
in a 3100 m
2
quadrate). In addition to C. kawakamii, the overstory also
contained other tree species, such as Pinus massoniana, Schima
superba, Lithocarpus glaber, Symplocos caudate, Machilus velatina,
Randia cochinchinensis, and Symplocos stellaris. In 1966, part of this
NF was clear-cut, slashed and burned. In 1967, the soil was prepared
by digging holes and then 1-year-old seedlings of C. lanceolata (Chinese
fir), F. hodginsii, O. xylocarpa, and C. kawakamii were planted with
density of 3000 trees per hectare.
2.2. Methods
2.2.1. Extraction of fine roots
Fine root biomass was measured by the sequential core method. On
each sampling date, six soil cores (1 m in depth) were randomly col-
lected from each plot (30 per forest) bimonthly during January 1999–
January 2002 using a steel corer (6.8 cm diameter, 1.2 m length). To
avoid length shrinkage caused by soil compaction, each core was taken
by three consecutive coring at the same sampling point, viz. 0–40 cm,
40–80 cm, and 80–100 cm, respectively for each coring. Soil cores
were then cut into different depths (0 ~ 10, 10 ~ 20, 20 ~ 30, 30 ~ 40,
40 ~ 50, 50 ~ 60, 60 ~ 70, 70 ~ 80, 80 ~ 90, and 90 ~ 100 cm) and
store at 4 °C in refrigerators until processed. Cores were washed with
tap water to remove adhering soil and accompanying organic debris.
Figure 1. Temperature and rainfall patterns for the study area. z Monthly rainfall; { Monthly mean temperature.
Fire root distribution, seasonal pattern and production 619
Fine roots were classified by diameter class (< 0.5 mm, 0.5–1mm, and
1–2 mm), trees or undergrowth (shrubs and herbages), and physiolog-
ical status (live or dead) based on color, texture and shape of the root
[11, 22, 28]. Only fine roots of trees were collected and included in
this study. In addition to those of C. kawakamii, fine roots of the NF
included those of other species in the overstory. All fine root samples
were oven-dried (80 °C) to constant weight and weighed.
The dry weight of living fine roots (root biomass) or dead fine roots
(root necromass) was calculated using the following formula [22]:
Fine root biomass (or root necromass) (Mg ha
–1
) = dry weight of
living (or dead) fine roots per core (g) × 10
–6
/(π 6.8(d/cm)/2)
2
× 10
8
.
2.2.2. Fine root decomposition
The litterbag technique was used to quantify the decomposition rate
of fine roots. The fine roots of tree species were collected from each
stand by sieving from the top 0–20 cm soil. In the NF, only roots of
C. kawakamii were collected for decomposition. Roots were gently
and briefly washed in tap water to remove adhering soil particles and
spread on a laboratory table to dry for 24 h at room temperature [23],
and then sorted into three size classes: < 0.5 mm, 0.5–1 mm, and
1–2 mm. Roots which were clearly dead or decaying were discarded
and only roots which appeared live at the time of collection were
included in the litter bags.
In May 1999, the nylon litter bags (18 × 18 cm
2
size and 0.25 mm
mesh) containing 5 g air-dried root samples (a total of 240 bags were
placed at each forest site, 80 for each size) were placed on the sites at
a soil depth of 10 cm at random locations for an 24 months period.
Six bags were retrieved at random for each diameter class from each
forest site after 30, 60, 90, 150, 210, 270, 330, 390, 540, 630, and
720 days of sample placement. Immediately after collection, the litter
bags were placed in individual polyethylene bags and transported to
the laboratory. The residual materials were carefully separated from
the bags, cleaned of adhering plant parts and soil particles, oven-dried
to constant mass at 60 °C, and weighed.
2.2.3. Calculations and statistical analysis
The model for dry mass loss was represented by the following equa-
tion [23]:
x
t
/ x
0
= 100 exp (–kt)
where x
t
is the dry mass remaining at time t, x
0
is the initial weight,
k is the decay constant, and t is the time.
Fine root production, mortality, and decomposition were calcu-
lated with the compartment-flow method, according Kurz and
Kimmins [14]:
LFR
t
= LFR
t–1
+ P
t
– M
t
DFR
t
= DFR
t–1
+ M
t
– D
t
D
t
= (DFR
t–1
+ M
t
)DR
where LFR
t
, DFR
t
, P
t
, M
t
, and D
t
is fine root biomass (living roots),
root necromass (dead roots), production, mortality, and decomposi-
tion, respectively, at t interval, and DR is root decay rate. Then, annual
Table I. Forest characteristics and soil properties of the NF, CK, FH, CF, and OX stands.
Parameters
Forest type
1
CF FH OX CK NF
2
Mean tree age (year) 33 33 33 33 ~ 150
Mean tree height (m) 21.9 21.4 18.4 18.9 24.3
Mean tree diameter at breast height (cm) 23.3 21.6 17.2 24.2 42.2
Stand density (stem ha
–1
) 1117 975 1109 875 255
Stand volume (m
3
ha
–1
) 425.91 379.57 209.01 412.43 398.31
Standing biomass of forest floor (mean ± sd, Mg ha
–1
) 3.15 ± 0.68 2.65 ± 0.81 7.22 ± 1.38 7.44 ± 1.54 7.72 ± 1.86
Soil (A horizon, 0–20 cm depth, mean ± sd
3
Bulk density (g cm
–3
) 1.20 ± 0.09 1.13 ± 0.10 1.15 ± 0.10 1.10 ± 0.12 0.93 ± 0.08
Organic C (mg g
–1
) 16.9 ± 3.1 17.7 ± 2.5 17.5 ± 2.4 17.1 ± 2.0 26.4 ± 3.0
Total N (mg g
–1
) 1.12 ± 0.28 1.37 ± 0.22 1.29 ± 0.19 1.12 ± 0.23 1.88 ± 0.20
C/N ratio 15.1 ± 2.1 12.9 ± 1.8 13.6 ± 2.3 15.3 ± 2.2 14.0 ± 2.5
Hydrolyzable N (mg g
–1
) 0.11 ± 0.02 0.12 ± 0.02 0.13 ± 0.01 0.12 ± 0.02 0.14 ± 0.03
Available P (mg kg
–1
) 4.7 ± 0.8 5.6 ± 0.9 6.8 ± 1.3 5.9 ± 1.1 7.6 ± 1.4
Available K (mg kg
–1
) 100 ± 7 108 ± 9 109 ± 11 121 ± 9 140 ± 15
CEC (cmol kg
–1
) 11.4 ± 0.3 11.9 ± 0.3 12.2 ± 0.2 12.9 ± 0.3 13.5 ± 0.8
Exchangeable bases (cmol kg
–1
) 2.5 ± 0.4 3.2 ± 0.4 3.3 ± 0.3 3.8 ± 0.6 4.4 ± 0.5
Base saturation (%) 22 ± 3 27 ± 4 27 ± 3 29 ± 4 32 ± 3
Soil pH in water 4.8 ± 0.3 5.1 ± 0.3 5.1 ± 0.2 5.3 ± 0.3 5.8 ± 0.3
Leaf-litter decomposition
constant (k) (a
–1
) 1.16 3.92 4.62 4.46 4.52
1
CF, Chinese fir (Cunninghamia lanceolata) plantation forest; FH, Fokienia hodginsii plantation forest; OX, Ormosia xylocarpa plantation forest; CK,
Castanopsis kawakamii plantation forest; NF, natural forest of C. kawakamii. The abbreviations are the same as elsewhere.
2
Castanopsis kawakamii is only involved.
3
Six soils were randomly taken from each plot, totaled 30 soil samples per forest (5 plots per stand).
620 Y.S. Yang et al.
fine root production (P), mortality (M), and decomposition (D) can be
calculated as following:
P = Σ P
t
,
M = Σ M
t,
D = Σ D
t
.
The turnover rate and the mean residence time of fine roots were
calculated by the following equation:
Turnover rate (a
–1
) = Annual root production (Mg ha
–1
a
–1
) / Mean
root biomass (Mg ha
–1
).
Mean residence time (a) = Mean root biomass (Mg ha
–1
) / Annual
root production (Mg ha
–1
a
–1
).
The biomass data were analyzed by one- and two-way analysis of
variance with the Statistical Program for Social Science (SPSS 10.0)
software to determine differences between seasons and between years,
and Newman-Keuls tests were performed for comparisons of mean
values (signification for P < 0.05).
3. RESULTS
3.1. Fine root biomass and necromass
There were significant differences in root biomass and nec-
romass among stands (P < 0.05), except between the OX and
the CF (P > 0.05). Mean fine root biomass during the 3-year
measurement period ranged from 1.48 Mg ha
–1
in the CF to
4.94 Mg ha
–1
in the NF, and decreased in the following order:
NF > CK > FH > OX > CF. Mean fine root necromass varied
annually from 1.29 Mg ha
–1
in the CF to 3.56 Mg ha
–1
in the
NF, and can be ranked as NF > CK > FH > OX > CF. The con-
tribution of < 0.5 mm (very fine roots) roots to total fine root
biomass ranged from 29.4% in the CK to 62.2% in the FH. The
ratio of root necromass to root biomass is quite invariable and
ranged from 0.72 in the NF to 0.87 in the CF (Tab. II).
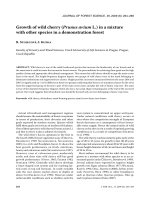
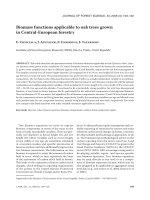
3.2. Seasonal patterns
Seasonal differences in fine root biomass and in necromass
were significant (P < 0.05) in all stands, while there was no sig-
nificant difference detected between years in any stand (P >
0.05) (Fig. 2). The seasonal patterns of root biomass and nec-
romass were quite similar among the five stands. A peak of root
biomass occurred in March in all stands, and the CF stand
showed also a particular significant higher value in September
(Fig. 2). However, there was a difference in the timing of lowest
value among stands, mainly occurred during May–July or
November–January. The maximum root necromass occurred in
May or July, except in the OX stand (September or November)
(Fig. 2), coinciding approximately with the peaks of maximum
rainfall.
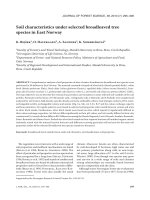
3.3. Vertical distribution
The depth distribution of root biomass varied among stands
(Fig. 3). Fine root biomass was more evenly distributed in soil
profiles in the OX and CF than in the NF, CK, and FH. The max-
imum difference occurred in the top 0–10 cm layer, where the
root biomass of the NF was up to 2.95 Mg ha
–1
, being 2.37 time,
3.55 times, 8.12 times, and 7.12 times as much as that of CK,
Figure 2. Seasonal patterns of fine root biomass and necromass
(Mg ha
–1
) in the NF, CK, FH, CF, and OX stands. Fine root bio-
mass, Fine root necromass.
Fire root distribution, seasonal pattern and production 621
Table II. Mean fine root biomass and necromass (Mg ha
–1
, mean ± SD) in the NF, CK, FH, CF, and OX stands. Values followed by different
letters on the same column indicate significant differences at P <0.05.
Forest
types
Root biomass Root necromass Total roots Ratio necromass /
biomass
1999 2000 2001 Mean 1999 2000 2001 Mean
NF, diameter
1–2 mm 2.12 2.04 2.15 2.10 1.41 1.13 1.25 1.26 3.37
± 0.51 ± 0.45 ± 0.41 ± 0.47 ± 0.73 ± 0.68 ± 0.70 ± 0.67 ± 0.69
0.5–1 mm 1.44 1.39 1.44 1.42 1.16 0.97 1.07 1.07 2.49
± 0.34 ± 0.29 ± 0.20 ± 0.31 ± 0.59 ± 0.56 ± 0.60 ± 0.55 ± 0.76
< 0.5 mm 1.43 1.37 1.45 1.42 1.30 1.08 1.32 1.23 2.65
± 0.29 ± 0.18 ± 0.32 ± 0.30 ± 0.72 ± 0.69 ± 0.71 ± 0.67 ± 0.73
Subtotal 4.99 4.80 5.04 4.94 3.87 3.18 3.64 3.56 8.51 0.72
± 1.06 ± 1.08 ± 1.03 ± 0.99a ± 1.91 ± 1.90 ± 1.93 ± 1.85a ± 1.69a
CK, diameter
1–2 mm 1.39 1.47 1.53 1.47 1.00 0.99 1.04 1.01 2.48
± 0.24 ± 0.20 ± 0.24 ± 0.34 ± 0.42 ± 0.43 ± 0.39 ± 0.39 ± 0.73
0.5–1 mm 0.85 0.85 0.88 0.86 0.85 0.84 0.90 0.86 1.72
± 0.11 ± 0.12 ± 0.12 ± 0.21 ± 0.39 ± 0.39 ± 0.34 ± 0.35 ± 0.60
< 0.5 mm 0.84 0.88 0.91 0.87 0.86 0.86 0.91 0.88 1.75
± 0.12 ± 0.14 ± 0.12 ± 0.22 ± 0.33 ± 0.42 ± 0.34 ± 0.35 ± 0.54
Subtotal 3.08 3.20 3.32 3.20 2.71 2.69 2.85 2.75 5.95 0.85
± 0.44 ± 0.41 ± 0.42 ± 0.41b ± 1.14 ± 1.23 ± 0.98 ± 1.05b ± 0.91b
FH, diameter
1–2 mm 0.71 0.53 0.62 0.62 0.18 0.15 0.16 0.16 0.78
± 0.10 ± 0.12 ± 0.10 ± 0.13 ± 0.05 ± 0.06 ± 0.04 ± 0.05 ± 0.14
0.5–1 mm 0.50 0.38 0.44 0.44 0.26 0.24 0.26 0.25 0.69
± 0.10 ± 0.08 ± 0.09 ± 0.10 ± 0.08 ± 0.13 ± 0.09 ± 0.10 ± 0.14
< 0.5 mm 1.27 0.94 1.10 1.10 1.50 1.14 1.31 1.32 2.42
± 0.30 ± 0.14 ± 0.21 ± 0.26 ± 0.48 ± 0.28 ± 0.34 ± 0.39 ± 0.53
Subtotal 2.48 1.85 2.16 2.16 1.94 1.53 1.73 1.73 3.90 0.80
± 0.46 ± 0.32 ± 0.38 ± 0.45c ± 0.60 ± 0.45 ± 0.46 ± 0.50c ± 0.75c
CF, diameter
1–2 mm 0.55 0.59 0.57 0.57 0.38 0.35 0.37 0.36 0.93
± 0.10 ± 0.15 ± 0.12 ± 0.12 ± 0.10 ± 0.10 ± 0.08 ± 0.10 ± 0.24
0.5–1 mm 0.28 0.26 0.27 0.27 0.36 0.29 0.32 0.33 0.59
± 0.11 ± 0.06 ± 0.10 ± 0.09 ± 0.10 ± 0.08 ± 0.08 ± 0.09 ± 0.19
< 0.5 mm 0.67 0.62 0.64 0.64 0.64 0.56 0.61 0.60 1.25
± 0.23 ± 0.18 ± 0.21 ± 0.20 ± 0.17 ± 0.13 ± 0.13 ± 0.13 ± 0.21
Subtotal 1.51 1.46 1.48 1.48 1.37 1.20 1.29 1.29 2.77 0.87
± 0.39 ± 0.32 ± 0.35 ± 0.34d ± 0.35 ± 0.29 ± 0.26 ± 0.32d ± 0.62d
OX, diameter
1–2 mm 0.46 0.56 0.52 0.51 0.30 0.25 0.27 0.27 0.79
± 0.20 ± 0.17 ± 0.52 ± 0.18 ± 0.11 ± 0.11 ± 0.33 ± 0.12 ± 0.42
0.5–1 mm 0.39 0.38 0.39 0.39 0.29 0.26 0.26 0.27 0.66
± 0.17 ± 0.14 ± 0.62 ± 0.15 ± 0.13 ± 0.13 ± 0.30 ± 0.11 ± 0.60
< 0.5 mm 0.83 0.79 0.79 0.80 0.86 0.65 0.78 0.76 1.56
± 0.18 ± 0.17 ± 0.55 ± 0.53 ± 0.12 ± 0.11 ± 0.32 ± 0.31 ± 0.43
Subtotal 1.68 1.73 1.70 1.70 1.45 1.16 1.31 1.31 3.01 0.77
± 0.78 ± 0.87 ± 0.80 ± 0.77d ± 0.54 ± 0.56 ± 0.54 ± 0.52d ± 0.47d
622 Y.S. Yang et al.
FH, CF and OX, respectively (Fig. 3). While for root necromass,
differences of superficial soil were less announceable. For the
NF, 59.8% of root biomass was found in the top 0–10 cm layer,
compared with 39.1%, 38.5%, 24.5% and 24.4% in the CK, FH,
CF, and OX stand, respectively.
3.4. Fine root production and mortality
Percentages of original mass lost after the first year of
decomposition ranged from 43.8 ~ 56.3% for the FH to 68.3 ~
80.1% for the NF. Roots with a larger diameter had a lower rate
of mass loss (P < 0.05) (Tab. III). The negative exponential
decay model showed a good fit for the decay pattern for all spe-
cies and regressions were highly significant (r
2
> 0.9, P < 0.05).
Mean annual root decomposition, mortality, and production
ranged from 8.470, 8.632, and 9.5 Mg ha
–1
a
–1
in the NF to
2.503, 2.492, and 2.513 Mg ha
–1
a
–1
in the CF stand, and could
be ranked as NF > CK > FH > OX > CF (Tab. IV). The mean
residence time varied from 0.56 a in the NF to 0.68 a in the FH.
4. DISCUSSION
4.1. Fine root biomass
The published values of fine root biomass of the world sub-
tropical forests ranged between 1.1 to 10.6 Mg ha
–1
[16, 17, 36,
37, 39]. The mean fine root biomass in the NF was in the upper
part of this range, and lied in the middle of the range recorded
for the tropical broadleafs evergreen forests (0.6 ~ 22.7 Mg ha
–1
)
[36]. The fine root biomass in the four plantations was lower
than that in the NF, but similar to that recorded in climatically
comparable plantations [17, 36, 39]. Further, the fine root bio-
mass estimate of the FH was higher than those of other sub-
tropical needle evergreen stands [17, 36, 39]. The higher soil
fertility, productivity, and species diversity levels in the NF,
compared with the monoculture plantations, may explain the
higher fine root biomass in the NF (Tab. I).
Rapid recovery of fine root biomass to pre-disturbance lev-
els has been found in some regenerated forests [27, 44], while
Figure 3. Depth distribution of fine root biomass and necromass in the NF, CK, FH, CF, and OX stands (× NF; z CK; { FH; U CF;
c
OX).
Fire root distribution, seasonal pattern and production 623
other studies have shown a gradual increase in fine root growth
and biomass up to at least 20 years following forest removal
[2]. Here, however, none of the four plantations had their fine
root biomass up to 70% of those in the NF after 33 years of for-
est conversion. The reduction in fine root occupancy in the
monoculture plantations, compared with in the natural forest,
might be due to the mono-species, frequent land disturbance,
and high nutrient loss before canopy closure during the early
stage in the plantations [18, 41–43].
4.2. Seasonal pattern
The seasonal pattern in fine roots may be attributed to
changes in soil moisture and soil temperature [12, 19, 21]. Stud-
ies of the seasonal variations in root biomass have reported tree
stands showing no distinct seasonal pattern [24] and those with
one [22] or two [11] statistically significant peaks. Peaks in
standing fine root biomass have been measured in spring [6,
11], summer [6], and fall [34] in temperate climates.
There was detected in these stands a peak of fine root bio-
mass in March, a period prior to an active growth of above-
ground part for most tree species in subtropical China. This
early spring flush of fine root growth might result, not only from
the increase of soil temperature and soil humidity (due to ini-
tiation of rainy season), but also from an abundant supply of
carbohydrates reserved during the former growing season [19,
21]. In the CF, and in a lesser intensity, in FH, another high
value of fine root biomass occurred in September, which might
Table III. Mass loss rates after the second year of decomposition
and the decomposition constant of fine roots in the NF, CK, FH, CF,
and OX stands (litter-bag method).
Forest
type
Diameter
class
(mm)
Mass loss rate
after 2nd year
(%)
95% decay
time
(d)
Decomposition
constant
(day
–1
)(year
–1
)
NF 1–2 90 936 0.0032 1.17
0.5–1 94 768 0.0039 1.42
< 0.5 96.1 666 0.0045 1.64
CK 1–2 86.7 1070 0.0028 1.02
0.5–1 93.5 788 0.0038 1.39
< 0.5 95.1 713 0.0042 1.53
FH 1–2 68.4 1872 0.0016 0.58
0.5–1 74.5 1577 0.0019 0.69
<0.5 80.9 1302 0.0023 0.84
CF 1–2 72.6 1664 0.0018 0.66
0.5–1 79.5 1362 0.0022 0.80
< 0.5 84.6 1152 0.0026 0.95
OX 1–2 87.6 1033 0.0029 1.06
0.5–1 94 768 0.0039 1.42
< 0.5 95.1 713 0.0042 1.53
Table IV. Annual fine root production, mortality and decomposition and turnover rates in the NF, CK, FH, CF, and OX stands.
Forest type Year Decomposition
(Mg ha
–1
a
–1
)
Mortality
(Mg ha
–1
a
–1
)
Production
(Mg ha
–1
a
–1
)
Turnover rate
(a
–1
)
Mean residence
time (a)
NF 1999 9.23 7.89 8.83 1.97
2000 7.92 8.48 8.06 1.68
2001 9.09 9.53 9.50 1.89
Mean 8.75 8.63 8.80 1.78 0.56
CK 1999 4.89 4.59 5.95 1.94
2000 5.00 5.65 5.41 1.69
2001 5.14 5.21 4.91 1.48
Mean 5.01 5.15 5.42 1.70 0.59
FH 1999 3.64 3.78 3.40 1.37
2000 2.85 2.79 2.96 1.60
2001 3.23 3.23 3.24 1.51
Mean 3.24 3.26 3.20 1.48 0.68
CF 1999 2.65 2.57 2.73 1.81
2000 2.33 2.39 2.26 1.54
2001 2.53 2.52 2.55 1.72
Mean 2.50 2.49 2.51 1.69 0.59
OX 1999 2.96 2.95 2.85 1.69
2000 2.36 2.37 2.44 1.41
2001 2.67 2.67 2.65 1.56
Mean 2.66 2.66 2.65 1.55 0.65
624 Y.S. Yang et al.
be associated with an increase of soil moisture, after the dry,
hot August [43, 45]. During the warm summer, the soil water
content could be very low due to high evapotranspiration and
a decrease of rainfall occurred usually on July (Fig. 1). Thus,
the fine roots, in particular, may have subsequently suffered
from drought, e.g., the low rainfall in June 1999, May and July
2000, and July 2001 has resulted in a low level of fine root bio-
mass in the NF, CK, FH, and CF at the May or July sampling
dates (compare Figs. 1 and 2). Surprisingly, roots of the OX
seemed to show no response to monthly rainfall. The decline
in fine root biomass during the winter season may, at least in
part, be mainly related to low temperature conditions. This sea-
sonal pattern of fine root biomass (maximum in early spring and
minimum in dry summer and in cold winter) observed in the
present study were also found by Liao et al. [17], Wen et al.
[37] and Li et al. [16] in subtropical China.
4.3. Vertical distribution
Fine root distribution decreasing with soil depth in the
present study was similar to those in many forest ecosystems
[3, 9, 20, 21, 25, 41]. This may reflect the distribution of nutri-
ents returned to the soil by litterfall, canopy leachates and stem-
flow, and the trophotaxis of fine roots. Ford and Deans [9]
stated that high concentration of fine roots in the surface soil
layers of the forest are related to higher nutrient concentrations
if there is enough moisture, because the decomposition of the
organic litter and release of nutrients on the surface soil, par-
ticularly during periods of active growth. The leaf litter forms
a shelter for the surface roots by providing a microclimate, if
rainfall is not limiting, for the development of new roots. Also
this organic litter is the chief source for nutrients to be recycled.
A significant difference of fine root biomass existed in the
top 10 cm layer between the NF and the plantations, which
might be ascribed to a higher nutrient availability in the topsoil
of the NF (Tab. I) due to a higher amount of organic matter and
nutrients derived from litterfall, and a faster litter decay rate
(Tab. I) as well [40]. Further, the high concentration of fine root
biomass in the topsoil can much benefit the soil fertility by ways
of root exudates, formation of root channel, and return of
organic mass and nutrients through root turnover. Thus, the top-
soil of the NF was characteristic by low soil bulk-density, high
aggregate stability [42], and high level of SOM and nutrients
(Tab. I). However, differences of root distribution among the
four plantations were relatively low and might be mainly
related to the differences of tree characteristics.
The subtropical forests of China are in the risk of nutrient
loss due to high annual rainfall, steep slopes, and fragile soils
(note the acid soil pH; Tab. I). Thus, in this context, the native
forests are dependent upon tight recycling of nutrients [46]. The
fine root system that has developed in the surface layer of the
soil, and that particularly located in the upper 10 cm layer
(Fig. 3), should facilitate rapid uptake of nutrients released by
decomposing litter. In addition, nutrients included in through-
fall plus stemflow would also be intercepted by the roots. The
presence of fine root biomass up to 2.96 Mg ha
–1
in the top 10 cm
soil of the NF is, therefore, much helpful in mopping up the
nutrients. During the conversion of native forests to managed
plantations, clear-cutting, slash-burning, soil preparing, and
intensive tending, etc, are commonly applied, and the topsoil
are frequently disturbed and nutrient and surface soil loss would
become very serious [43]. A rapid recovery of uppermost root dis-
tribution is, therefore, of very much importance in helping
nutrient conservation. As indicated in the present study, a
reduction in the occurrence of fine roots in the uppermost 10 cm
of the soil profile in the plantation forests, compared with in
the NF, would bring a risk of nutrient loss, especially during
the early growth stage.
4.4. Fine root productivity and turnover
Though the soil conditions differed between the NF and the
CK (Tab. I), the decomposition rates of the fine roots of C.
kawakamii was very similar (Tab. III), indicated that here cli-
mate drives the decomposition and there was little chemical
composition and site effect on root decomposition. It is also can
be found that the decay rates of broadleaves (C. kawakamii and
O. xylocarpa) were much higher than those of conifers (F. hod-
ginsii and C. lanceolata), which were also reported by Liao
et al. [17] and Usman et al. [32]. However, whether it is a com-
mon conclusion depends on a large database. The decay rates
of F. hodginsii and C. lanceolata were much higher than those
estimated for other conifers, e.g., by McClaugherty et al. [22]
for red pine (12–25%); Berg [4] for Scot pine (25%); Fogel and
Hunt [8] for Douglas fir (15%), and by Usman et al. [32] for
Pinus roxburghii (26%). The values of annual decay constant
(k, year-based; calculated by the negative exponential model)
fall in the range reported across the world (0.02–1.74) [2, 5, 8,
17, 22, 29, 31, 33], and were comparable with the values for
other subtropical forests (0.6–1.74) [2, 5, 17].
The most commonly used method of estimating fine root
production and mortality involves periodic measurements of
live, and in some cases dead, fine root biomass. Publivcover
and Vogt [25] compared three methods (the max-min, decision
matrix, and compartment flow methods) for estimating forest
fine root production. In their results, the compartment-flow
method was the most accurate and overcomes the problems of
underestimation of production to which the biomass-only
methods are subject. Though difference in estimation method
(Tab. V), fine root production in the NF was much higher than
those in a mixed needle-broadleaf evergreen forest and a broad-
leaf evergreen forest in the Dinghushan in southern subtropical
China (2.42–2.65 Mg ha
–1
a
–1
) [37] and a Castanopsis eyrei
forest (7.37 Mg ha
–1
a
–1
) in Wuyi Mountain in mid-subtropical
China [16]. Further, the value of the NF was similar to that of
a tropical evergreen forest (6.3–9.4 Mg ha
–1
a
–1
) in the Western
Ghats, South India [30] (Tab. V). Root production in the CK
was lower than that in the NF, but higher than that recorded in
tree plantations of the same climate [17, 36, 39]. The FH had
a root production higher than other subtropical needleleaf ever-
green forests, and the estimate of the CF was close to those of
Chinese fir plantations in Huitong and Fujian [17, 36, 39]. Par-
ticularly, the root production in the OX (2.65 Mg ha
–1
a
–1
) was
very similar to that in the CF (2.51 Mg ha
–1
a
–1
) in the present
study, and rather low compared with that found in a broadleaved
plantation of Michelia macclurei in Huitong (4.32 Mg ha
–1
a
–1
)
(Tab. V) [17]. However, the measurement of true decay rates
is the biggest obstacle to accurate estimation of fine root pro-
duction when using the compartment-flow method. In the
present study, a constant decay rate (measured in early summer,
Fire root distribution, seasonal pattern and production 625
which might represent an overestimate of mean value of a year)
were used with this method, thus, the failure to account for the
temperature-dependency of decay rate might cause an overes-
timate of root turnover [14].
Forest conversion has reduced fine root production by 71%
in the CF to 38% in the CK, and reduced fine root mortality by
71% in the CF to 40% in the CK. Given the relevance of fine
root inputs for SOM dynamics, this may represent a substantial
decrease in organic C flow into the soil. The intensity and per-
manence of the change in C inputs is an important land-use
issue that deserves further quantification.
In these forests, mean annual fine root production was nearly
balanced by mean annual mortality, which indicated that there
was little net growth of fine root systems, i.e., it is close to equi-
librium; the annual root production was largely used to annual
root litter production [19]. Studies have indicated that fine root
litter production is similar in magnitude to, or higher, than foliar
litter production [13, 23]. In these forests, the mean annual lit-
terfall was 11.01, 9.54, 7.29, 5.46, and 5.69 Mg ha
–1
a
–1
for the
NF, CK, FH, CF, and OX, respectively [40]. Thus, the ratio of
root litter production to the aboveground litter production
ranged from 0.45 in the FH to 0.78 in the NF. Raich and
Nadelhoffer [26] indicated that fine root litter production is
positively related to aboveground litterfall across world forests.
A significant correlation between the two components could
also be deduced from our results (r = 0.896; P = 0.015; n = 5).
According to Gill and Jackson [10], fine root turnover rates
of world forests were in the range of 0.02 to 2.64 a
–1
, with an
average of 0.56 a
–1
. Our estimates (1.48 ~ 1.78 a
–1
; Tab. IV) fall
in the world range and were significant higher than the global
average, which might be due to the higher temperature of our
study site (Fig. 1). Also, our values were much higher than
those of other subtropical forests [16, 17, 37, 39].
5. CONCLUSION
Conversion of native forest to tree plantations have reduced
fine root biomass in the soil profile, especially in the uppermost
10 cm soil layer, which would increase the risk of nutrient avail-
ability. Also, a decreased in fine root productivity and turnover,
coupled to the decrease in aboveground litter production due
Table V. Fine root productivity in various forest ecosystems.
Forest type Climate Stand age
(a)
Root diameter
(mm)
Sampling soil
depth (cm)
Root production
(Mg ha
–1
a
–1
)
Method Source
Pure forest of C. lanceolata Northern subtropics 11 < 2 45 1.14 Max–min [16]
Pure forest of Michelia macclurei Northern subtropics 11 < 2 45 4.32 Max–min [16]
Mixed forest of C. lanceolata
and M. macclurei
Northern subtropics 11 < 2 45 2.18 Max–min [16]
Castanopsis eyrei Mid-subtropics 76 < 2 40 7.37 Ingrowth core [15]
C. lanceolata Mid-subtropics 27 < 2 100 2.50 Max–min [37]
Natural forest of C. kawakamii Mid-subtropics ~ 150 < 2 20 6.37* Compartment
flow model
The present
study
40 7.95* Compartment
flow model
The present
study
C. kawakamii Mid-subtropics 33 < 2 40 4.41* Compartment
flow model
The present
study
F. hodginsii Mid-subtropics 33 < 2 40 2.53* Compartment
flow model
The present
study
C. lanceolata Mid-subtropics 33 < 2 40 1.79* Compartment
flow model
The present
study
O. xylocarpa Mid-subtropics 33 < 2 40 1.91* Compartment
flow model
The present
study
Monsoon evergreen,
broad-leaved forest
Southern-subtropics – < 2 40 2.65 Max-min [36]
Mixed coniferous and
broad-leaved forest
Southern-subtropics – < 2 40 2.42 Advanced max-min [36]
Moist deciduous forest Tropics – < 3 25 8.30–8.90 Summa of positive
biomass increments
[29]
Semi-evergreen forest Tropics – < 3 25 7.90–8.04 Summa of positive
biomass increments
[29]
Evergreen forest Tropics – < 3 25 6.30–9.40 Summa of positive
biomass increments
[29]
* Productivity of fine roots at different soil depths was calculated according to their respective biomass proportion in total fine root biomass.
626 Y.S. Yang et al.
to forest transformation, may have important consequences for
C sequestration (lower SOM content), nutrient availability, and
then for long-term site productivity. In this context, forest man-
agements which contribute to a rapid occupancy of topsoil by
fine roots should be introduced in monoculture reafforestation.
Acknowledgements: This work was funded by the National Natural
Science Foundation of China (30170770), the Teaching and Research
Award program for MOE P.R.C. (TRAPOYT), the Key Basic
Research Project of Fujian Province (2000F004), and the Natural Sci-
ence Foundation of Fujian Province (B0110025).
REFERENCES
[1] Aber J.D., Melillo J.M., Fine root turnover in forest ecosystems in
relation to quality and form of nitrogen availability: a comparison
of two methods, Oecologia 66 (1985) 317–321.
[2] Arunachalam A., Pandey H.N., Tripathi R.S., Maithani K., Fine
root decomposition and nutrient mineralization patterns in a subtro-
pical humid forest following tree cutting, For. Ecol. Manage. 86
(1996) 141–150.
[3] Bennett J.N., Andrew B., Prescott C.E., Vertical fine root distribu-
tions of western redcedar, western hemlock, and salal in old-growth
cedar-hemlock forests on northern Vancouver island, Can. J. For.
Res. 32 (2002) 1208–1216.
[4] Berg B., Staaf H., Decomposition rate and chemical changes of
Scots pine needle litter. II. Influence of chemical composition
structure and function of Northern Coniferous forests– an ecosys-
tem study, Ecol. Bull. 32 (1981) 373–390.
[5] Bloomfield J., Vogt K.A., Vogt D.J., Decay rate and substrate qua-
lity of fine roots and foliage of two tropical tree species in the
Luquillo Experimental Forest, Puerto Rico, Plant Soil 150 (1993)
233–245.
[6] Burton A.J., Pregitzer K.S., Hendrick R.L., Relationships between
fine root dynamics and nitrogen availability in Michigan northern
hardwood forests, Oecologia 125 ( 2000) 389–399.
[7] Castellanos J., Jaramillo V.J., Sanford R.B. Jr., Kauffman J.B.,
Slash- and -burning effects on fine root biomass and productivity in
a tropical dry forest ecosystem in Mexico, For. Ecol. Manage. 148
(2001) 41–50.
[8] Fogel R., Hunt G., Fungal and arboreal biomass in a western Ore-
gon Douglar-fir ecosystem. Distribution patterns and turnover,
Can. J. For. Res. 9 (1979) 245–256.
[9] Ford E.D., Deans J.D., Growth of a sitka spruce plantation: spatial
distribution and seasonal fluctuations of lengths, weights and car-
bohydrate concentrations of fine roots, Plant Soil 47 (1977) 463–
485.
[10] Gill R.A., Jackson R.B., Global patterns of root turnover for terres-
trial ecosystems, New Phytol. 147 (2000) 13–31.
[11] Grier C.C., Vogt K.A., Keys M.R., Edmonds R.L., Biomass distri-
bution and above and below ground production in a young and
mature Abies amabilis zone ecosystems of the Washington casca-
des, Can. J. For. Res. 11 (1981) 155–167.
[12] Hook P.B., Lauenroth W.K., Burke I.C., Spatial patterns of roots in
a semiarid grassland: abundance of canopy openings and regenera-
tion gaps, J. Ecol. 82 (1994) 485–494.
[13] Joslin J.D., Henderson G.S., Organic matter and nutrients associa-
ted with fine root turnover in a white oak stand, For. Sci. 33 (1987)
330–346.
[14] Kurz W.A., Kimmins J.P., Analysis of some sources of error in
methods used to determine fine root production in forest ecosys-
tems: a simulation approach, Can. J. For. Res. 17 (1987) 909–912.
[15] Le Goff N., Ottorini J.M., Root biomass and biomass increment in
a beech (Fagus sylvatica L.) stand in North-East France, Ann. For.
Sci. 58 (2001) 1–13.
[16] Li L.H., Lin P., Xing X.R., Fine root biomass and production of
Castanopsis eytei forests in Wuyi Mountains, Chin. J. Appl. Ecol.
9 (1998) 337–340 (in Chinese, with English abstract).
[17] Liao L.P., Chen C.Y., Zhang J.W., Turnover of fine roots in pure
and mixed Cunninghamia lanceolata and Michelia macclurei forests,
Chin. J. Appl. Ecol. 6 (1995) 7–10 (in chinese, with english abstract).
[18] Lin P., Qiu X.Z., Study on the Castanopsis kawakamii forest in the
Wakeng area of Sanming city, Fujian province, Acta Phytoecol.
Geobot. Sinica 10 (1986) 241–252 (in Chinese, with English abs-
tract).
[19] López B., Sabaté S., Gracia C.A., Annual and seasonal changes in
fine root biomass of Quercus ilex L., Plant Soil 230 (2001) 125–
134.
[20] López B., Sabaté S., Gracia C.A., Vertical distribution of fine root
density, length density, area index and mean diameter in a Quercus
ilex forest, Tree Physiol. 21 (2001) 555–560.
[21] Makkonen K., Helmisaari H.S., Seasonal and yearly variations of
fine root biomass and necromass in a Scots pine (Pinus sylvestris
L.) stand, For. Ecol. Manage. 102 (1998) 283–290.
[22] McClaugherty C.A., Aber J.D., Melillo J.M., The role of fine roots
in the organic matter and nitrogen budgets of two forested ecosys-
tems, Ecology 63 (1982) 1481–1490.
[23] McClaugherty C.A., Aber J.D., Mellilo J.M., Decomposition dyna-
mics of fine roots in forested ecosystems, Oikos 42 (1984) 378–
386.
[24] Persson H., Root dynamics in a young Scots pine stand in central
Sweden, Oikos 30 (1978) 508–519.
[25] Publicover D.A., Vogt K.A., A comparison of methods for estima-
ting forest fine root production with respect to sources of error, Can.
J. For. Res. 23 (1993) 1179–1186.
[26] Raich J.W., Nadelhoffer K.J., Belowground carbon allocation in
forest ecosystems: global trends, Ecology 70 (1989) 1346–1354.
[27] Raich J., Fine roots regrow rapidly after forest felling, Biotropica 12
(1980) 231–232.
[28] Santantonio D., Hermann R.K., Standing crop production, and tur-
nover of fine roots on dry, moderate, and wet sites of mature Dou-
glas-fir in western Oregon, Ann. Sci. For. 42 (1985) 113–142.
[29] Shan J.P., Tao D.L., Wang S., Study on fine root turnover in mixed
forest of broadleaved and Korea pine in Changbai Mountain, Chin.
J. Appl. Ecol. 4 (1993) 241–245 (in Chinese, with English abstract).
[30] Sundarapandian S.M., Swamy P.S., Fine root biomass distribution
and productivity patterns under open and closed canopies of tropi-
cal forest ecosystems at Kodayar in Western Ghats, South India,
For. Ecol. Manage. 86 (1996) 181–192.
[31] Tripathi S.K., Singh K.P., Nutrient immobilization and release pat-
terns during plant decomposition in a dry tropical bamboo savanna,
India, Biol. Fertil. Soils 14 (1992) 191–199.
[32] Usman S., Singh S.P., Rawat Y.S., Bargali S.S., Fine root decom-
position and nitrogen mineralisation patterns in Quercus leucotri-
chophora and Pinus roxburghii forests in central Himalaya, For.
Ecol. Manage. 131 (2000) 191–199.
[33] Van Vuuren M.M.I., Berendse F., De Visser W., Species and site
differences in the decomposition of litter and roots from wet heath-
lands, Can. J. Bot. 71 (1993) 167–173.
[34] Vogt K.A., Edmonds R.L., Grier C.C., Seasonal changes in bio-
mass and vertical distribution of mycorrhizal and fibrous-textured
conifer roots in 23- and 180-year-old Abies amabilis stands, Can. J.
For. Res. 11 (1981) 223–229.
[35] Vogt K.A., Grier C.C., Vogt D.J., Production, turnover, and nutrient
dynamics of above- and belowground detritus of world forests,
Adv. Ecol. Res. 15 (1986) 303–377.
[36] Vogt K.A., Vogt D.J., Palmiotto P.A., Boon P., O’Hara J., Asbjornsen
H., Review of root dynamics in forest ecosystems grouped by cli-
mate, climatic forest type and species, Plant Soil 187 (1996) 159–
219.
Fire root distribution, seasonal pattern and production 627
[37] Wen D.Z., Wei P., Kong G.H., The productivity and turnover of
fine roots of southern subtropical forest in Dinghu Mountains, Acta
Bot. Sin. 23 (1999) 361–369
(in Chinese, with English abstract).
[38] Yang Y.S., Chen G.S., Guo J.F., Lin P., Decomposition dynamic of
fine roots in a mixed forest of Cunninghamia lanceolata and Tsoon-
giodendron odorum in mid-subtropics, Ann. For. Sci. 61 (2004)
65–72.
[39] Yang Y.S., Chen G.S., He Z.M., Chen Y.X., Guo J.F., Production,
distribution and nutrient return of fine roots in a mixed and a pure
forest in subtropical China, Chin. J. Appl. Environ. Biol. 8 (2002)
223–233.
[40] Yang Y.S., Guo J.F., Chen G.S., Xie J.S., Cai L.P., Lin P., Litter-
fall, nutrient return, and leaf-litter decomposition in four planta-
tions compared with a natural forest in subtropical China, Ann. For.
Sci. 61 (2004) 465–476.
[41] Yang Y.S., Guo J.F., Chen G.S., He Z.M., Xie J.S., Effects of slash
burning on nutrient removal and soil fertility in Chinese fir and
evergreen broadleaved forests of mid-subtropical China, Pedos-
phere 13 (2003) 87–96.
[42] Yang Y.S., Li Z.W., Liu A.Q., Studies on soil fertility for natural
forest of Castanopsis kawakamii replaced by broadleaf plantation,
J. Northeast For. Univ. 21 (1993) 14–21 (in Chinese, with English
abstract).
[43] Yang Y.S., Studies on the sustainable management of Chinese fir
plantations, China Forestry Publishing House, Beijing, 1998 (in
Chinese).
[44] Yin X., Pery J.A., Dixon R.K., Fine-root dynamics and biomass
distribution in a Quercus ecosystem after harvest, For. Ecol.
Manage. 27 (1989) 159–177.
[45] Yu X.T., Silviculture of Chinese fir, Fujian Science and Techno-
logy Press, Fuzhou, 1996, pp. 24–35 (in Chinese).
[46] Zhang H.B., Forests in Fujian, China Forestry Publishing House,
Beijing, 1993 (in Chinese).
To access this journal online:
www.edpsciences.org