Poverty Impact Analysis: Approaches and Methods - Chapter 0 docx
Bạn đang xem bản rút gọn của tài liệu. Xem và tải ngay bản đầy đủ của tài liệu tại đây (402.37 KB, 50 trang )
INTRODUCTION
Poverty Impact Analysis: Approaches
and Methods
Introduction
Background
At the start of this century, poverty remains a global problem of huge
proportions. Of the world’s 6.0 billion people, 2.8 billion live on less than
$2 a day and 1.2 billion on less than $1 a day (World Bank 2000). The latest
poverty estimates show an improvement, but the challenge to further reduce
poverty remains daunting. In the Asia and Pacifi c region, for instance, about
1.9 billion people still live on less than $2 a day, and over 620 million survive
on less than even $1 a day. This condition is unacceptable and therefore
fi ghting poverty is the most urgent challenge (ADB 2006b). The good news
is that most of the Asian Development Bank’s (ADB’s) developing member
countries (DMCs) are on track to achieve the Millennium Development Goal
(MDG) No. 1: Halving poverty by 2015 (ADB 2005a). This, however, means
that the poverty rate for the DMCs in 2015 would still be around 17 percent,
as the starting point of their poverty rate in 1990 was about 34 percent.
In order to reduce poverty and achieve maximum benefi t for the poor,
there must be global actions by international communities to complement
similar actions by countries and local communities. Fortunately, concerns
over poverty reduction are evident among various stakeholders at all levels.
At the global level, this is refl ected by worldwide acceptance of the human
development paradigm, in which people are at the center of development,
bringing about development of the people, by the people, and for the
people.
1
This position is further strengthened by national and international
commitments of countries to achieve the MDGs.
2
1
The United Nations Development Program (UNDP) launched the Human Development
Report in 1990 with the single goal of putting people back at the center of the
development process in terms of economic debate, policy, and advocacy. The goal was
both massive and simple, with far-ranging implications—going beyond income to assess
the level of people’s long-term well-being.
2
The United Nations (UN), in its Millennium Summit in September 2000, unanimously
adopted the MDGs that enshrine poverty reduction as the overarching objective of
development. There are altogether eight MDGs, namely: eradicate extreme poverty and
hunger, achieve universal primary education, promote gender equality, reduce child
mortality, improve maternal health, combat HIV/AIDS and malaria, provide access to
safe water, and ensure environmental sustainability (Detailed information about the
MDGs can be found on />Application of Tools to Identify the Poor
2 Poverty Impact Analysis: Approaches and Methods
Poverty reduction has become the ultimate goal of many institutions,
including ADB, that make considerations on pro-poor growth, growth
inclusiveness, and other pro-poor policies very important in their operations.
The overall policy paradigm favored by international agencies is pro-poor
growth combined with targeted poverty-focused interventions (Fujimura
and Weiss 2000).
3
Multilateral development banks—refl ecting a serious
commitment—have spent billions of dollars and other resources in their
programs and projects
4
for helping the poor. However, not much is known
about the actual impact on the poor of these efforts. This information
gap is partly due to the lack of good and comprehensive poverty impact
evaluations.
ADB’s Goal of Poverty Reduction
ADB views poverty as an unacceptable human condition that can and
must be eliminated by public policy and action. Poverty is a deprivation of
minimum essential assets and opportunities to which every human being is
entitled. Everyone should have access to basic education and primary health
services. Poor households have the right to sustain themselves by their labor,
and be reasonably rewarded, and be afforded some protection from external
shocks (ADB 1999).
Beyond income and basic services, individuals and societies are also poor—
and tend to remain so—if they are not empowered to participate in making
the decisions that shape their lives. Poverty is thus better measured in terms
of basic education, health care, nutrition, water and sanitation, in addition to
income, employment, and wages. Such measures must also serve as a proxy
for other important intangibles such as feelings of powerlessness and lack of
freedom to participate (ADB 1999).
In November 1999, poverty reduction was formally adopted as ADB’s
primary goal. The poverty reduction strategy followed a framework
comprising three pillars—pro-poor sustainable economic growth, social
development, and good governance. Hence, ADB adopted an approach
that aims to systematically reduce poverty through policy reforms, building
physical and institutional capacity, and improving the design of projects and
programs in targeting poverty more effectively.
3
Growth is pro-poor when it is labor absorbing and accompanied by policies and programs
that mitigate inequalities and facilitate income and employment generation for the poor,
particularly women and other traditionally excluded groups (ADB 2004). See also other
ADB publications on the pro-poor growth issue.
4
Programs and projects are used interchangeably in this book to refer an array of activities
designed to improve the quality of life in its many aspects.
Poverty Impact Analysis: Tools and Applications
Introduction 3
All ADB loans and technical assistance are expected to contribute to
poverty reduction. Each proposal is subjected to an assessment of its poverty
impact, and the logical framework that accompanies each proposal will
commence with poverty reduction as its ultimate objective. Accordingly,
projects or programs may be designed to accelerate pro-poor growth or focus
directly on poverty.
5
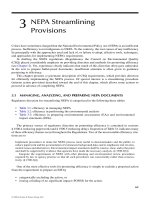
Figure 1 shows how ADB’s operational cycle in reducing
poverty would work with poverty impact analysis (PIA) playing an important
role in poverty-focused project identifi cation, poverty analysis concept paper,
poverty analysis and monitoring progress, and fi nally on poverty impact. Box
1 provides an example of pro-poor checks for intervention in ADB projects
to ensure that the poor are not left behind, while Box 2 summarizes the
benchmark criteria for preparing effective pro-poor projects.
In view of ADB’s adoption of its poverty reduction strategy, which was
further enhanced in 2004, there remains an urgent need for tools that provide
mechanisms by which PIA can be conducted. This is at the core of ADB’s
Operational Cycle, as depicted in Figure 1, in which monitoring progress and
impact analysis should be an integral part of each stage of the operational
cycle.
Current methodologies to measure poverty impacts by examining net
present value (NPV) distribution to the poor of a project’s benefi ts,
6
present
only a partial analysis of how interventions affect the poor, ignoring the
project’s effects on the overall economy and on other aspects of the lives of
the poor. The current practices also rely very much on household income and
expenditure survey data.
7
This approach can be overly demanding on time
5
Subsequently, ADB took several initiatives, including major revisions in important policies,
new operational business processes, and reorganization of its operational structure,
to effectively implement the poverty reduction strategy (ADB 2004). The ADB poverty
reduction strategy indicates that all public sector loans will aim to reduce poverty,
directly or indirectly. The strategy also specifies a target: from 2001 onward, not less
than 40 percent of lending volume should be directed at fighting poverty, including
core poverty interventions (ADB. 2000. Loan Classification System: Conforming to the
Poverty Reduction Strategy. Manila).
6
See De Guzman (2005) and ADB 2001a for more details about this issue, especially
the discussion on the poverty impact ratio of a project.
7
Household income and expenditure data across countries available for PIA include data
from living standards measurement surveys, household income and expenditure surveys,
household expenditure surveys, socioeconomic surveys, and rapid monitoring surveys.
Application of Tools to Identify the Poor
4 Poverty Impact Analysis: Approaches and Methods
and resources. Household surveys’ geographical coverage is usually so broad
as to make project PIA in a specifi c location diffi cult and impractical.
8
Furthermore, the timing of household surveys may not be in line with
program implementation. Most household surveys in developing countries
are not conducted annually and their main purpose is not necessarily to
analyze poverty-related issues. Accordingly, the surveys may not have the
necessary detailed information on income and expenditure. In addition, the
surveys may have specifi c topics or modules such as health, education, and
others that could make them less useful for PIA, especially if the modules are
not related directly to the project’s concerns. As a result, the timing, topics,
and coverage of the household surveys may not be directly related to PIA.
In addition, as there is no standard method for assessing impact, each
assessment has to be specifi cally designed for each project, country, institution,
or stakeholder group. This situation requires using a survey and tool designed
specifi cally for assessing a particular project or policy intervention.
8
Household surveys in Indonesia, for instance, are designed to generate reliable poverty
indicators at the provincial level. In some cases, the indicators can still be estimated
with a high degree of confidence at district level in Java and other populated islands.
The similar geographical representation is also observed in the Philippines and other
developing countries. Accordingly, any effort to generate poverty indicators for smaller
areas using the existing household surveys must involve adding a substantial number
of household samples at the start of the data-collection stage.
Box 1 Propoor Checks for Asian Development Bank’s Projects
In line with ADB’s thrust to reduce poverty, the project officers should ensure that project-
induced growth effects lead to poverty reduction in two contexts: macroeconomic, public
expenditure, and governance and at geographical disaggregated levels.
The macroeconomic context includes controlled inflation and fiscal stabilization that
could have an adverse impact on the poor. Public services are often translated into a
measure of welfare as an approximation of true benefit incidence. Tax incidence analysis
can be applied in combination with public spending analysis. For the institutional or
governance context, governance indicators can be divided into neutral and proactive
indicators. Neutral indicators include accountability and credibility of the institutions
in terms of finances, efficiency, and anticorruption framework and enforcement, while
proactive indicators include asset distribution, voice of the poor, social and environmental
protection, social safety net systems, etc.
In the context of geographical disaggregated levels, the project analyst is responsible
for collecting and complementing information specific to local situations and examining
whether the project environment is conducive to facilitating the poor’s access to services
generated by the project.
Source: ADB 2001a.
Poverty Impact Analysis: Tools and Applications
Introduction 5
Motivation for and Impediments to Conducting PIA
PIA
9
has received considerable attention in recent years partly due to the
previous experience in pro-poor programs.
10
The interest in PIA has also been
fueled by mounting pressure on governments and donor agencies to broaden
their development strategies to address issues such as poverty, environmental
quality, and the economic, social, and political participation of women in
developing countries. Resource constraints have also heightened interest in
the use of more cost-effective analysis to help identify the more cost-effective
and equitable ways of delivering services to priority target groups, including
the poor.
Good PIAs will help multilateral development banks better allocate their
resources in the future. This is particularly important for the developing
countries, where resources are relatively scarce. Knowledge about project
impact is essential and has great bearing on the availability of resources.
9
The terms poverty impact analysis and poverty impact assessment are used interchangeably
in this book. One might argue, however, that poverty impact analysis covers more aspects
than poverty impact assessment, which is also quite often considered as more ex post
than poverty impact analysis.
10
Empirical evidence shows that the portfolio performance of projects supported by the
World Bank from 1981 to 1990, for instance, deteriorated steadily with the share of
projects having “major problems” increasing from 11 to 20 percent (World Bank 1991a).
Such figures may not even indicate the real size of the problem, as they refer only to
project implementation with no account of how well the projects are able to sustain
the delivery of services over time or to produce their intended impacts.
Country Operational Strategy
Partnership Agreement
Country Assistance Plan
Poverty-focused Project Identification
Project Preparatory Technical Assistance
High-Level Forum
Poverty Analysis
Poverty Analysis Concept Paper
Monitoring
Progress and Impact
Project Implementation
Project Processing
Figure 1 Operational Cycle of the Asian Development Bank
Source: ADB 1999.
Application of Tools to Identify the Poor
6 Poverty Impact Analysis: Approaches and Methods
The poor also benefi t from good evaluations, which weed out defective anti-
poverty programs and identify the effective ones (Ravallion 2005).
There have been many attempts to conduct PIAs but they mostly suffer
from insuffi cient analytical rigor, faulty questions, and use of wrong time
frames (Baker 2000). As a result, there is no comprehensive PIA of any
project which can be used as an example on how PIAs should be conducted.
The case studies of PIAs included in Baker (2000), for instance, were selected
not for their exemplary features but as an attempt to cover a broad mix
of country settings, types of projects, and evaluation methodologies, from
Box 2 Benchmark Criteria for Preparing Effective Propoor Projects
The criteria for preparing effective propoor projects can be examined with questions
such as whether the project has drawn on evidence about and addressed the causes of
poverty, explicitly addressed poverty reduction, been developed to reduce possible adverse
impacts on poor people, been aligned with poverty-focused policy reforms and institution
building, been a part of integrated project and programs, addressed and assessed the
possibility that the project will crowd out other poverty reduction projects, assessed the
extent of the situation of the poor in general and that of target groups in particular, and
carried out incidence assessments on poverty impact distribution and benefits.
Based on these criteria, the following checklists are recommended to identify weaknesses
and shortcomings in the project design:
The project selection, design, and implementation arrangements should incorporate
key social issues and the views of major stakeholders, as determined through a
participatory process.
The project’s social impact should be disaggregated by social group, including
gender and adequate provision should be made to mitigate any adverse impacts.
The project should be consistent with the ADB’s poverty reduction strategy and its
design should ensure that the project benefits the target beneficiaries.
The project’s direct and indirect impacts on the poor should be clearly articulated
and quantified.
There should be adequate arrangements for monitoring and evaluating social
impacts, including poverty impacts that include a baseline survey, clearly specified
targets, provision for data collection on outcome indicators, and ex post evaluation
of project impact.
In addition, the project design should comply with ADB policies on indigenous
peoples, involuntary resettlement, and cultural property.
•
•
•
•
•
•
Source: Summarized from ADB 2001a.
Poverty Impact Analysis: Tools and Applications
Introduction 7
a range of evaluation activities carried out by the World Bank, other donor
agencies, research institutions, and private consulting fi rms.
11
One main reason for the lack of a comprehensive evaluation—defi ned
here to include cost-benefi t, monitoring, process, and impact evaluations—
is the diffi culty in conducting such evaluation (Baker 2000). This is true
even for a project specifi cally designed to assist the poor.
12
Getting the key
stakeholders to agree to actually implement the comprehensive evaluation
is the fi rst problem. Second, PIA is technically very complex and diffi cult,
especially in identifying a project’s benefi ciaries and actual impact. This is
compounded by the more diffi cult tasks of isolating and then measuring the
actual impact, which should be attributed only to the project and free from
biases due to “selection” of participants or other factors. The biases may
arise from observable or unobservable factors, spillover effects, and data and
measurements (Ravallion 2005).
There are also other major issues contributing to the diffi culties in
conducting PIAs such as the following:
PIAs can be very costly and time consuming, which may not be
consistent with the main purpose of the project since the money spent
for conducting PIAs could be used to further help the poor.
PIA results can be politically sensitive, especially if the results turn
out to be negative.
In developing a comparison group necessary for PIA, there might be
compelling ethical objections for excluding an equally needy group
such as the elderly, malnourished, unemployed, and uneducated from
participating in a program under evaluation.
There is always a timing issue—whether PIA should be conducted ex
ante, ex post, or at both junctures.
Regarding methodology, there is the diffi cult task of answering
questions of “with” and “without” as well as “before” and “after” the
project. This is essentially providing the project’s counterfactual, which
is intrinsically unobserved since it is physically impossible to observe
someone in two conditions at the same time, i.e., participating and not
participating in the program (Ravallion 2005). In addition, there is no
single method that dominates others, thus, anyone designing policy-
11
The Organisation for Economic Co-operation and Development (OECD, 1986) has
estimated that an average donor agency conducts 10 to 30 evaluation activities a
year, while the United States Agency for International Development (USAID) and the
World Bank conduct as many as 250 (Baum and Tolbert 1985). The OECD study also
concluded that interest in evaluation generally tends to be stronger among those
allocating resources than among those using them.
12
As a result, many have given up doing the ex ante impact evaluation and concentrate
instead on improving the quality of project at entry (Gajewski and Luppino 2004).
•
•
•
•
•
Application of Tools to Identify the Poor
8 Poverty Impact Analysis: Approaches and Methods
relevant evaluations should be open minded about methodology,
including the use of quantitative or qualitative methods, or both
(Baker 2000, Ravallion 2005).
Whatever approach and methodology are used, there is an issue on
the availability and quality of data necessary for conducting a PIA.
Key Issues in Poverty Impact Analysis
The fi rst thing to note about PIA is that there is no standard way of doing
it. The design of each PIA should be unique, depending on many factors
such as the main purpose of the project or program, data availability, local
capacity, budget constraints, and time frame. PIA should be made part of a
comprehensive evaluation, which includes cost-benefi t, monitoring, process,
and impact evaluations (Baker 2000, Bourguignon and Pereira da Silva
2003a). PIA can also be a part of other impact assessments such as economic
and environmental assessments. PIA should occur at strategic junctures of
and follow closely a program’s life cycle—ex ante, mid-term, terminal, and
ex post. Therefore, PIA should ideally begin at the earliest stage of project
design and continue through the disbursement cycle and beyond (JICA
2004). The best ex post evaluations, for instance, should be designed ex ante,
often side by side with program implementation (Ravallion 2005).
ADB’s Guidelines for the Economic Analysis of Projects (ADB 1997) states that
the main purpose of PIA is to bring about better allocation of resources.
In addition, PIA should include sensitivity and risk analyses to enhance
project quality at entry. In this context, learning from PIAs of previous
projects to design better projects in the future can also be seen as enhancing
project quality at entry. ADB also recognizes the diffi culties in conducting
PIA, especially given the variety of projects across sectors with their own
characteristics. This is highlighted further in Box 3.
PIA is used essentially to examine whether a project or program has
generated the intended effects on the targeted low-income group. For a
pro-poor project, this means answering the question of whether the project
really benefi ts the poor. The poor may be characterized by low skill,
illiteracy, unemployment, working in low-productivity sectors, located in
underdeveloped regions, or belonging to certain ethnic groups. In the case
of complex targets, there would be primary, secondary, and other targets.
This is consistent with ADB’s view on poverty as a multidimensional issue
including, for instance, lacking access to employment, health care, and
education. Accordingly, poverty analysis cannot be conducted in isolation
but it should include many aspects as summarized in Box 4.
•
Poverty Impact Analysis: Tools and Applications
Introduction 9
Box 3 Variety of Projects and Difficulties in
Conducting Poverty Impact Analysis
One obvious limitation in the distribution analysis of PIA is that it cannot cover all types
of projects. The use of distribution and poverty analysis for projects in sectors such as
power, water, and irrigation, where full benefit-cost analyses are regularly applied, may
be a natural extension of the current work.
But economic internal rate of returns (EIRR) are rarely calculated in social sectors such
as health and primary education. Such projects can be subject to cost-effectiveness
analysis. Alternative criteria can also be applied to poverty-focused projects where
monetary estimation of benefits is not possible and beneficiaries must be measured in
terms, of number of poor patients or poor pupils, for instance.
Between these edges, there will be a range of intermediate situations where there may
be technical difficulties in conducting distribution and poverty analysis. Projects for which
the methodologies are very difficult to apply include institution building and private sector
development. This is due to the difficulty in relating investment expenditures with tangible
outputs and income flows.
Source: Summarized from ADB 2001a.
Box 4 Poverty Analysis Coverage
In the poverty analysis of a country, the following information should be covered:
Macroeconomic stability and its trend, including inflation and exchange rates and
their impact on the poor in urban and rural settings.
Asset distribution, including landownership with geographical breakdown and its
implication on the poor’s capability to participate in market activities.
Labor market condition, such as market competitiveness and the location and
density of labor-intensive industries and small and medium enterprises and their
implications for employment of the poor.
Public spending and tax incidence, preferably with geographical breakdown.
Government antipoverty programs, including their magnitude, location, sectors, and
types.
Social safety nets for the poor, preferably with geographical breakdown.
Effectiveness of the regulatory regimes and implications on the poor, such as the
existence and enforcement status of anticorruption laws.
Indicators of risk-coping capacity of the poor and social indicators, such as education
levels and health status, preferably with geographical breakdown.
Support of civil society and the private sector, including the existence of
nongovernment and community-based organizations that represent and promote
the interests of the poor, with geographical breakdown.
Ongoing and planned external assistance, including the existence of targeted
poverty reduction initiatives, preferably with geographical breakdown.
•
•
•
•
•
•
•
•
•
•
Source: Summarized from ADB 2001a.
Application of Tools to Identify the Poor
10 Poverty Impact Analysis: Approaches and Methods
PIA results also serve as instruments for public accountability to the donor
community and general public about the relevance and management of the
project or program. A systematic and comprehensive PIA can ensure that
benefi ts of the programs reach the right benefi ciaries.
The implementation of PIA should start by identifying the main objective
of the project, followed by identifi cation of the intended benefi ciaries. The
next steps are measuring the project’s impact, to ensure that the impact is due
to the project only, and that the measurement used is the right one. These are
key issues that must be taken into account in conducting PIA.
Identifi cation and Measurement of Impact
After identifying the project’s benefi ciaries (i.e., the poor), the next crucial
step in conducting PIA is how to identify and measure the impact. Some of
the issues related to this step are discussed below.
Impact is different from output or outcome. A project’s impact is
a consequence of its output and outcome. PIA studies the impact of an
intervention on the fi nal welfare outcomes for the target groups, rather than
the project outputs or project implementation process. More generally,
project impact evaluation establishes whether the intervention had a welfare
effect on individuals, households, and communities, and whether the effect
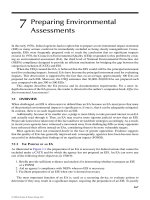
can be attributed to the project. Figure 2 is a simplifi ed framework of the
project implementation process, emphasizing how impact is different and
goes beyond output. The misunderstanding over what constitutes impact
results in the fact that many impact analyses actually examine project outputs
or outcomes. In some cases, the impact analyses even refer to input, such as
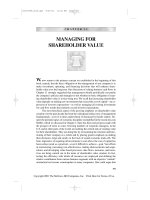
measuring the number of a project’s participants and benefi ciaries. Figure 3
shows a sample framework of impact analysis on the effect of education on
women. The difference between impact and other project components may
be deduced from the fi gure.
Identifying, isolating, and measuring impact are diffi cult tasks. Project
impact could depend greatly on the project purpose and only effects that result
from project implementation should be measured in a PIA. The project’s
impact should not be mixed with the impact of other interventions or factors.
In some cases, the project impact simply cannot be measured quantitatively.
The social impact of education on women identifi ed in Figure 3, for instance,
cannot be completely measured. Impacts on attitude and control over own
life, for instance, cannot be fully represented by quantitative indicators.
Poverty Impact Analysis: Tools and Applications
Introduction 11
Some benefi ts cannot be represented as monetary units. The standard
procedure of measuring poverty impact by estimating project benefi ts that
accrue to the poor suggested by cost-benefi t analysis (i.e., estimating the NPV
of the benefi ts that go to the poor) may not refl ect the actual impact of the
project on the poor. Box 5 summarizes a distributional analysis of project
impact which is calculated and presented as poverty impact ratio.
The transmission mechanism is not always straightforward. The
transmission mechanism of impact, i.e., how project benefi ts reach the
benefi ciaries, can take different forms that can be very diffi cult to trace.
There are direct and indirect effects, as well as multi-round effects or even
general equilibrium effects of the project that should be taken into account in
measuring the overall project impact.
Project impacts can materialize in the short or long term. It is important
that the impacts should be examined in the right time frame. The time frame
used for measuring a food subsidy program to boost school attendance of
targeted pupils, for instance, should be different from the time frame used for
measuring programs with more long-term impacts, such as training and other
employment-generation programs for the labor force.
Timing is always an issue in conducting PIA. At what stage the impact
analysis should be conducted—either ex ante or ex post, or both—needs to be
determined. As mentioned before, a good PIA should consider the project life
cycle, following closely its different stages, i.e., ex ante, mid-term, terminal,
and post evaluations (JICA 2004).
Figure 2 Simplified Model of Project Monitoring and the Evaluation Framework Process
Source: Nguyen and Bloom 2006.
Ultimate objective of
the project
Specific welfare effects of
project on target group
Goods and services
produced by the project
Actions undertaken to
implement the project
Financial, human, and
material resources
Impact Evaluation
Implementation Monitoring
Impact
Outcomes
Outputs
Activities
Inputs
Application of Tools to Identify the Poor
12 Poverty Impact Analysis: Approaches and Methods
Methodology for Conducting Poverty Impact Analysis
The choice of methodology used in PIA is not straightforward because the
methods are not mutually exclusive. There is always a trade-off for each
method selected. In addition, no method is perfect and no single method
dominates, making a triangulation of methods a good option. In general,
the methods available can be classifi ed into quantitative and qualitative
methods.
Quantitative Methods. Quantitative methods are analytically more
thorough than qualitative methods and can facilitate project impact
comparison. Theoretically, the most accurate quantitative method is the
experimental design, in which the program benefi ciaries of a concerned
project are randomly assessed. Therefore, the design can answer questions of
impact with and without the intervention, as well as impact before and after
the project. The experimental designs are considered the optimum approach
to estimating project impact, providing the most robust of the evaluation
methodologies. There may, however, be some practical objections to their
implementations as summarized in Box 6.
In practice, the experimental designs are conducted by randomly allocating
the intervention among eligible benefi ciaries such that the assignment
Figure 3 Sample Impact Analysis Framework
Note: This is a framework for the analysis of the impacts of education on women.
Source: Valadez and Bamberger 1994.
Culture
Economic Impacts
Social Impacts
Urban
Rural
Labor Force Participation
Employment Opportunities
Informal Sector
and Self-employment
Skills
Nonmarket and Household
Production
Attitudes
Control Over Own Life
Impact of Own Income
Educational
Accessibility
Education
Quality
Poverty Impact Analysis: Tools and Applications
Introduction 13
Box 5 Steps to Conduct a Distributional Analysis of a Project: Calculating
the Poverty Impact Ratio
In calculating the poverty impact ratio (PIR), the following procedure is suggested:
1. Set out financial data by showing the inflows (revenue and loan receipts) and
outflows (investment, operating costs, loan interest and principal repayment, and
taxes both on profits and purchased inputs).
2. Discount each annual inflows and outflows to derive present values for each category
and a net present value (NPV) (discount rate is normally set at 12 percent). The
NPV will be the income change due to the project.
3. Identify the economic value to be used for each project input/output category.
The ratio between economic value and financial value for actual transaction is the
conversion factor (CF) for the items concerned. Normally where CF=1, economic
appraisal is in domestic price numeraire. However, if a world price numeraire is
required to calculate economic value, all financial values from steps 1 and 2 must
be converted to world prices by using the standard conversion factor.
4. Express all project items in economic terms. This can be done by applying CF to
revalue the financial data from step 1.
5. Allocate any difference between financial and economic values to particular groups
to get the net benefit generated by the project. The net benefits to different groups
must add up to the economic NPV of the project, since this measures the total net
benefits of the project. This can be seen as an identity: Economic NPV= Financial
NPV+(Economic NPV-Financial NPV).
6. In analyzing poverty impact, estimate the net benefits for each group affected by
the project that belong to the poor category. Groups vary according to projects but
typically include consumers, workers, producers, government, and the rest of the
economy.
For the government, the counterfactual is estimated by calculating what proportion of
government expenditure diverted from other uses by the project under consideration
would have otherwise benefited the poor. Similarly, if a project generates government
income, a proportion will benefit the poor—indirectly caused by the project.
7. Finally, add all net benefits going to the poor and divide by the total net benefits
(economic NPV). This is the PIR.
Caution on the Interpretation of PIR
PIR is not a summary indicator for PIA. It is a proportion of NPV accruing to the
poor against the total project NPV. PIR does not inform poverty impact ranking or
efficiency of poverty reduction among alternative projects designs.
A project should maximize NPV going to the poor (absolute poverty impact) or the
NPV going to the project cost (efficiency of poverty impact) not PIR.
While PIR is superior to headcount, PIR is usually sensitive to assumptions which are
uncertain. Sensitivity tests are therefore recommended with respect to uncertain
parameters.
•
•
•
Source: Summarized from ADB 2001a.
Application of Tools to Identify the Poor
14 Poverty Impact Analysis: Approaches and Methods
process will create comparable groups: the treatment and control groups.
Both groups are statistically equivalent to one another and, theoretically,
the control group made through this random assignment serves as a perfect
counterfactual to the treatment group, free from selection bias that exists in
most other designs. Having control and treatment groups also allows the
evaluators to clearly determine the impact on the targeted benefi ciaries. The
main benefi t of using experimental designs is the simplicity in interpreting
the results as the program impact can be measured by the difference between
the means of the samples of the treatment and control groups.
Other quantitative methods are classifi ed as nonrandomized designs
that include matching methods or constructed controls, double difference
or difference-in-difference, instrumental variables or statistical control, and
refl exive comparison. Detailed information about each method is beyond
the scope of this book.
Qualitative Methods. Qualitative and participatory methods can also be
used to assess project impact. These techniques often provide critical insights
into benefi ciaries’ perspectives, the value of programs to benefi ciaries, the
processes that may have affected outcomes, and a deeper interpretation
of results observed in quantitative analysis. As there is no constraint on
predetermined categories of analysis, qualitative methods permit an in-depth
and detailed study of issues.
Box 6 Implementing Experimental Designs: Some Challenges
Even though there is a little doubt that experimental design will generate the most
plausible results of impact analysis, its implementation could give rise to some problems
such as:
It could be unethical, owing to the denial of program benefits or services to otherwise
eligible members of the population for the sake of the study;
It could be politically or even socially difficult to provide an intervention to one group
and not to others;
It could be technically difficult to identify who should be in the nontreatment
(control) group. If the scope of the programs, projects, and policy changes are too
broad, this may mean that there will be no control group;
Individuals in the control group may change their identifying characteristics during
the experiment that could invalidate or contaminate the assessment results;
It may be difficult to ensure that the assignment of the project participants is truly
random; and
It can be expensive and time consuming in certain situations, particularly in data
collection.
•
•
•
•
•
•
Source: Summarized from Baker 2000, Bourguignon and Pereira da Silva 2003, Ravallion 2005, and JICA 2004.
Poverty Impact Analysis: Tools and Applications
Introduction 15
Qualitative techniques are used with the intention of determining impact
by relying on something other than the counterfactual to make a causal
inference (Mohr 1995). The focus of this method is on understanding processes,
behaviors, and conditions as they are perceived by the individuals or groups
being studied (Valadez and Bamberger 1994). For example, qualitative
methods and particularly participant observation can provide insight into
the ways in which households and local communities perceive a project and
how they are affected by it. It should be noted that some qualitative data
can also be quantifi ed in a limited manner, enabling the development of
different measures. Moreover, the validity and reliability of the qualitative
method depend on the methodological skill, sensitivity, and training of the
evaluator.
According to Patton (1984), a typical qualitative evaluation will provide:
a detailed description of the program implementation;
an analysis of major program processes;
descriptions of different types of participants and participations;
descriptions of how the programs have affected participants;
observed changes (or lack of them), outcomes, and impacts; and
an analysis of program strengths and weaknesses as viewed by
different stakeholders of the project.
Different methods require different data and information that may
depend on answers to the questions: Who will need the information and
use the evaluation fi ndings? What kind of information is needed? How is
the information going to be used and for what purpose is the evaluation
conducted? When is the information needed? What are the resources
available for the evaluation?
Recent developments in evaluation have led to an increase in the use of
multiple methods, including combinations of qualitative and quantitative
approaches to ensure robustness and to provide for contingencies in
implementation. A qualitative method, for instance, can be incorporated in a
quantitative approach to allow for the triangulation of fi ndings.
Counterfactual and Non-Counterfactual Methods of PIA
Another way of looking at PIA is that it can be done using counterfactual
or non-counterfactual methods but the non-counterfactual method may
systematically contain bias. The counterfactual approach removes bias by
providing the appropriate comparison. Therefore, to ensure methodological
rigor, PIA must be able to estimate or construct the counterfactual to provide
the condition of what would have happened had the project never taken
place. Box 7 summarizes how to minimize selection and other biases in
PIA.
•
•
•
•
•
•
Application of Tools to Identify the Poor
16 Poverty Impact Analysis: Approaches and Methods
To develop a counterfactual, it is necessary to isolate the effects of
interventions from other factors. This could be accomplished by using a
comparison or control group, i.e., those who do not participate in a program or
receive benefi ts. They are subsequently compared with the treatment group,
i.e., those who participate in the program or receive benefi ts. Randomized or
nonrandomized designs can be used to develop the counterfactual which is at
Box 7 Minimizing Selection and Other Biases in Poverty Impact Analysis
A major concern in PIA is how to measure project impact correctly. This process includes
properly identifying the beneficiaries and measuring the impact. The impact measurement
must be obtained through methods that eliminate or minimize bias.
Bias is essentially the difference between the actual and the expected or observed
impact. The program effect is the difference between outcomes of with and without the
project. A failure to provide a counterfactual, i.e., the condition without the project, will
make the PIA biased. Bias can also originate from measurement and research design
issues. Design issues include selection bias, which literally means errors because of
bias in selecting the beneficiaries. Selection bias is due to un-observables, which are
either not known by the researcher or are not easily measured. The problem of selection
bias arises because of missing data on common factors affecting both participation and
outcomes. Other external factors may also produce bias, such as the existence of trends,
interfering events, and maturation.
An example of selection bias is shown in figure 2.3 in which project impact on increasing
female participation in the labor market is measured. If the model used in the impact
assessment uses data on female workers and their wages, the result assessment might
be biased. This is because the decision to work among women might not be made
randomly. The women’s reservation wage might be greater than the wage offered in the
market, preventing them from working. This bias can be corrected by introducing some
variables that strongly affect the reservation wage but not the outcome of project (the
offer wage) such as the number of children at home.
Randomized design may solve the selection bias by basically generating the perfect control
group whose access to the program was randomly denied. The random assignment does
not actually remove the selection bias but it balances the bias between the participant
and nonparticipant groups.
In nonrandomized designs, various statistical techniques can be used to create the
representative control group. This includes matching, double differences, and instrumental
variables. In principle, these methods try to copy the random design condition by modeling
the selection processes to arrive at an unbiased estimate using nonexperimental data.
The general idea is to compare program effects on participants and nonparticipants by
holding the selection process constant. The validity of these models depends on how well
the models are specified.
Source: Summarized from Baker 2000 and Rossi, Lipsey, and Freeman 2004.
Poverty Impact Analysis: Tools and Applications
Introduction 17
the core of evaluation design. As mentioned before, it is diffi cult to develop
a counterfactual, especially in isolating the program impact from the impact
of other events. In addition, the counterfactual can be affected by history,
selection bias, and other contaminations.
Developing counterfactuals using a quantitative approach of randomized
design is best for measuring impacts in scenarios of with and without, before
and after, and their combinations. Impact analysis using an economic
modeling approach such as a computable general equilibrium (CGE) model
can also produce a counterfactual by generating scenarios of impact with and
without the policy or project.
Different Measures of Impact
The impact of a project can be measured in different ways. As in conducting
PIA, there is no standard way of measuring the impact. To some extent, the
measurement of impact depends on the main purpose and characteristics of
the project and the target benefi ciaries. Moreover, the impact measurement
on the poor is not limited to Foster-Greer-Thorbecke (FGT) poverty
indicators such as the headcount ratio (HCR), poverty gap index (PGI), and
poverty severity index (PSI), but it may refl ect a broader concept of poverty
measures, including measures such as improvements in education, morbidity,
employment, and basic services.
In addition, there could also be non-poverty income measures of benefi ts
obtained by the targeted benefi ciaries. The impact of a rural road project,
for instance, can be in the form of reducing travel time, transport costs,
and other costs. The impact can also be refl ected in the growing number or
availability of economic facilities that can be accessed by the benefi ciaries.
The framework for measuring impact of an education project on women
shows that the impact can take the form of economic and other social impacts
(Figure 3).
Measuring project impact is also different from measuring project results
or output, and the impact could be intended or could be by-products.
Accordingly, as mentioned before, a project could have main, secondary,
and other targets. Furthermore, project impact can be measured in terms
of total, average, or marginal, and the effect can be measured at individual,
household, or other social group level.
How a project impact is channeled to the benefi ciaries—its transformation
mechanism—is also an important issue in PIA. Project impact can be channeled
through market and nonmarket mechanisms, in formal or informal ways.
Labor and factor markets are examples of market channels through which
Application of Tools to Identify the Poor
18 Poverty Impact Analysis: Approaches and Methods
projects can affect employment levels and wages. In commodity markets,
changes may be refl ected in the fl uctuations of supply and demand of
products as well as on their prices. Nonmarket channels can be in the form of
transfers that affect access to services.
Developing Tools for Poverty Impact Analysis
To address the limitations of current PIA methodologies and related issues
described above, the Economics and Research Department (ERD) of ADB
developed a new PIA approach by conducting a series of research studies
under regional technical assistance (RETA) 6073 for developing tools for
assessing the effectiveness of ADB’s operations in reducing poverty, and
RETA 6042 for poverty mapping in some selected DMCs. The studies could
subsequently help ADB better understand the interlinked nature of poverty
impacts at macro and household levels; and to be able to conduct PIA with
suffi cient analytical rigor by examining the general impacts at the macro
level and more specifi c effects at the micro or household level.
The importance of including PIA in project and policy analysis has long
been recognized by ADB, as summarized in Box 8. The problems with
methodologies, however, remain—especially given the types of questions that
must be considered in poverty-reducing projects.
The research for and development of PIA tools and their applications are
presented in this book. The tools were developed by maximizing available
information from various censuses and surveys. As mentioned before, the
availability and quality of data have become one of the main issues in the
PIA, especially with regard to the timeliness and appropriateness of the
geographical aggregation. On the other hand, there is also a concern that
the existing impact assessments have not been maximizing the existing data
available in each country (ADB 2001a). The method currently in use of
examining the distribution of NPV benefi ts, for instance, only needs limited
data on the share of the poor among the project benefi ciaries. Therefore, ADB
research discussed in this book answers both concerns by demonstrating that
rigorous impact assessment can still be conducted in a second-best situation,
where not all desirable data are readily available.
The fi ve different PIA tools developed by ERD and discussed in this book
(Figure 4) are:
poverty predictor modeling (PPM) for identifying the poor at the
household level;
poverty mapping for identifying the poor over geographical areas or
developing poverty indicators at lower-level administrative regions
that cannot be produced using household survey data;
•
•
Poverty Impact Analysis: Tools and Applications
Introduction 19
CGE modeling for assessing the economy-wide effects and
distributional implications of wide-ranging issues on the economy
with representative household groups (RHGs);
CGE-microsimulation modeling for conducting assessments such
as those in CGE modeling but with a complete household data set
instead; and
the poverty reduction integrated simulation model (PRISM), which
is essentially an integration of CGE-microsimulation and poverty
mapping with its dynamic, interactive, and user-friendly geographic
information system (GIS) application.
•
•
•
Box 8 Poverty Impact Analysis for
Propoor Projects in the Asian Development Bank
The ADB, as early as the 1970s, recognized the importance of including beneficiary
identification and distribution impact analysis in project analysis (ADB 1978). Poverty
intervention projects are subjected to specific analysis of poor beneficiaries, in addition to
the standard criteria using economic internal rate of return or net present value . Ideally,
a consistent yardstick could be applied to rank all interventions by using a weighting
system, but the methodological problems fall short of this theoretical ideal. Due to the
diverse nature of poverty interventions, efficiency-based analysis is the common practice
in standardized PIA.
Economic analysis uses a money-metric measure, calculating project effects of economic
benefits and costs in monetary units. Hence, poverty can be defined as income or
consumption as opposed to headcounts. For ADB appraisals, the poverty line should
be the national poverty line agreed upon by ADB and the developing member country
concerned. However, if household surveys are not available, proxy indicators that correlate
to poverty can be used.
Initial issues that should be considered in the pre-project preparatory stage of poverty
intervention include:
Description of envisaged poverty impact by defining, identifying, and estimating
poverty and its correlates. The description also explains the mechanism through
which the poor are affected, i.e., as consumers through lower prices, nonpaying
users, workers through new jobs, and producers using services of the project as
inputs.
Explanation of critical assumptions required to conduct PIA (e.g., policies for
targeting, uptake by the poor, willingness to pay by the poor, financial sustainability
of project).
Explanation of the risks involved in achieving poverty objectives, such as benefit
leakages to nonpoor, financial difficulties, and available measurements.
Detailed socioeconomic assessment and questions on poverty impact.
•
•
•
•
Source: Summarized from ADB 2001a.
Application of Tools to Identify the Poor
20 Poverty Impact Analysis: Approaches and Methods
The first two tools are for identifying the poor, and can be used at the
project level while the three other tools are more relevant for PIA at the
national or sector level given the data aggregation used in the models. In
some cases, the modeling coverage of the three tools can be expanded at the
provincial level, if the database is available. The use of the correct tool and
appropriate aggregation level is very important since PIA can be done at
national, regional, sectoral, and household levels.
The poor can be identified at the household level or over a geographical
area. Household poverty indicators can also be used as a basis for estimating
poverty indicators of a small geographical area provided the sample size of
the household survey used is representative. The development of household
poverty indicators is done by implementing PPM, while the area approach is
developed through the application of poverty mapping.
Poverty Predictor Modeling
Poverty indicators at national or other aggregated levels available from
official publications are often not suitable for PIAs of specific programs,
projects, or policies. Therefore, there is a need to develop tools that can be
used to generate poverty indicators for a small geographical area relevant to
the PIA. In this context, PPM was developed to identify the poor household
based solely on predictor variables. PPM is based on a regression analysis
Figure 4 Tools for Poverty Impact Analysis Developed by
ADB’s Economics and Research Department
Poverty Mapping
Modeling
and GIS Application
Computable General
Equilibrium Modeling
Poverty Predictor
Modeling
Other Research
CGE-MicroSimulation
Poverty Reduction
Integrated Simulation
Modeling
Poverty Impact
Analysis
Source: Author’s framework.
Poverty Impact Analysis: Tools and Applications
Introduction 21
of household income and expenditure and other predictor variables that can
accurately predict household income and poverty status. The data used are
from the national household income and expenditure surveys. The estimated
regression coeffi cients form the basis for indirectly estimating household
income and poverty status based solely on the predictor variables.
The predictor variables should be easy to collect and not be computed
from a large number of variables nor rely heavily on respondent recall
(ADB 2001a). As a result, the predictor variables can be transformed into
a short questionnaire, which can be used for developing household poverty
indicators that would be very useful for PIA and monitoring. PPM, therefore,
provides an effi cient way of collecting baseline data and following up with
poverty measures necessary for PIA.
13
In this context, PPM can be used for
developing a practical alternative to the time-consuming and expensive way
of collecting income and expenditure data through a complete household
survey.
The implementation of PPM was pilot-tested in the People’s Republic
of China (PRC), Indonesia, and Viet Nam through small-scale surveys to
examine their appropriateness and effectiveness. The number of samples
included in the pilot surveys in the three countries were around 600, 1000,
and 500 households, respectively. In each country, the household samples
consisted of the newly selected households and the households selected in
the previous national household survey, the results of which were used in
the PPM. This was to ensure that the PPM results were representative and
applicable to the new households.
Overall, PPM results can be used for: (i) estimating household poverty
indicators; (ii) selecting program participants by using a proxy means test, in
which all potential participants are assigned based on a score calculated as a
function of observed characteristics (Ravallion 2005); (iii) targeting directly
poor households by identifying variables highly correlated to income and
expenditure that are easy to measure, not expensive to collect, and less prone
to manipulation; and (iv) conducting PIA and monitoring of a project.
The idea of using only poverty predictor variables to derive poverty
estimates is actually not new. It had previously been attempted by the World
Bank (Africa Region) in collaboration with the United Nations Development
Program (UNDP) and the United Nations Children’s Fund (UNICEF).
13
This is in line with the need to develop cost-effective and rapid monitoring data–collection
instruments, along with recommended administrative procedures for national agency
cooperation, sampling methods, standard questionnaires, data processing programs
and manuals, and guidelines for statistical analysis and poverty assessment based on
non-income data.
Application of Tools to Identify the Poor
22 Poverty Impact Analysis: Approaches and Methods
This is documented in the Core Welfare Indicators Questionnaire (CWIQ)
survey.
14
In this survey, data on income or expenditure were not collected,
but variables strongly correlated to poverty. CWIQ survey results can be
used to estimate the proportion of the poor within the project-affected area.
This information is useful for identifying the likely effects of the project on
the poor and other groups. The CWIQ survey is primarily designed for use
in a limited geographic area to collect data needed for project monitoring
and evaluation.
In addition to PPM, a different way to assess household poverty status is
also introduced in the pilot surveys, such as by classifying the households into
poor and nonpoor based on assessments made by respondent, enumerator,
neighbor, and village chief. Results of these assessments could complement
the survey result and be useful as a basis for setting priorities in poverty-
targeting programs.
The use of proxy indicators in poverty targeting, however, raises the
possibility of misidentifying a poor household as nonpoor (under coverage)
or a nonpoor household as poor (leakage). Therefore, further refi nement
and pilot surveys of the PPM may be necessary before the PPM results are
implemented across countries or regions, considering the extent of variations
among them. It should be noted here that PPM was developed using national
data sets and pilot-tested in some small regions. Therefore, PPM results
may not be representative for each region covered in the national survey.
Nonetheless, the overall results show the potential use of PPM.
Poverty Mapping and the GIS.
Poverty mapping is used to generate poverty estimates for geographical areas
that the household survey cannot produce. The main purpose of poverty
mapping is to maximize the rich information of surveys and the wider coverage
area of censuses to estimate reliable poverty indicators of more disaggregated
areas. The estimation is based on a modeling relationship between poverty
indicators and some common variables available in both surveys and
censuses. The results are then used to estimate more disaggregated poverty
indicators from census data.
14
CWIQ Survey was first conducted in 1997 in Ghana. Its variations have been implemented
in many African countries. For details see poverty/
databank/survnav/default.cfm and plannedsurveys/index.
php?request=SURVEY_BROWSE.
Poverty Impact Analysis: Tools and Applications
Introduction 23
Poverty mapping technique has been implemented successfully in a number
of countries and its application is not limited to poverty but also includes
other welfare indicators such as child malnutrition and unemployment.
The application of poverty mapping to Indonesian data results in reliable
estimates of district poverty indicators in both urban and rural areas. The
results have also been interfaced with a GIS application of the Poverty
Reduction Information System for Monitoring and Analysis (PRISMA) to
provide an interactive tool that can be used to conduct spatial analysis of
poverty in relation to other variables. In the application, poverty indicators
are presented as dynamic maps, which can be combined with graphs of
other variables to produce graphical representations of the poverty and other
variables concerned. The maps use a “traffi c-light classifi cation system”, in
which red, yellow, and green colors represent high, average, and low poverty
incidences. Users can change the default cut-off points to refl ect their own
preferences.
CGE Modeling
ERD has been developing individual country CGE models for the PRC,
Indonesia, and the Philippines to examine the economy-wide effects and
distributional implications of wide-ranging policies or shocks, or both, on
the economy, sectors, factor markets, and income and consumption of
RHGs included in the models. These models provide tools for PIA at the
macroeconomic, sectoral, and RHG level. Some desirable characteristics
such as reasonable disaggregation on sectors, factors, and households useful
for poverty and income distributional analysis have already been included
in the models. The models were also developed specifi cally for economies
concerned with some common characteristics such as open economies with
a possibility of substitution between imported and domestically produced
products (Armington specifi cation), and other country-specifi c characteristics.
These features are important for making PIA results more meaningful. The
CGE modeling for Indonesia is to address issues related to trade liberalization,
while for the PRC, it is for assessing the effects of infrastructure development
on poverty reduction. The Philippine CGE is used as a basis for PRISM.
CGE-Microsimulation Modeling
In this modeling approach, the CGE models for the Philippine and Indonesian
economies are linked to their corresponding household data sets in a top-
down method. In this way, microsimulation at the household level can be
conducted as part of the CGE model simulations. In doing so, the poverty
Application of Tools to Identify the Poor
24 Poverty Impact Analysis: Approaches and Methods
and other economic impacts of simulations introduced in the models can be
traced at the household level. As a result, the commonly used FGT class of
poverty measures such as the HCR, PGI, and PSI can be calculated before
and after the simulations along with other results from CGE modeling at the
macro, sectoral, foreign sector, and factor market.
The CGE-microsimulation of the Philippine economy was integrated in
the PRISM, while the model for Indonesia is used for assessing the economic
and poverty effects of trade liberalization, by highlighting the more complete
results for poverty indicators from the CGE-microsimulation compared with
those of the CGE model.
PRISM: An Integrated Modeling Approach
The latest tool developed by ERD is the PRISM.
15
It is an online modeling
tool that combines the CGE-microsimulation model with a poverty-mapping
GIS application to view poverty impacts by region. All complexities of the
modeling aspects have been interfaced in a user-friendly way, so that users can
run simulations and conduct analyses with ease. Users can run various “what
if” scenarios of important issues related to taxes, foreign sector economy,
factor market, and household income. The impacts can be examined on the
macro economy, the external sector, the factor market, household income,
and poverty. All simulation results are presented in graphs and tables that
can easily be downloaded or copied to other computer program applications.
Moreover, the poverty impacts of the simulations are also presented in an
interactive GIS map on a dual-window viewing system to enable a poverty
impact comparison between two different scenarios.
Other Research
In addition to the series of research studies described above, ERD has also
been conducting independent research, outside the technical assistance
support, which can also be useful for PIA. These activities include research
on applied econometric and CGE models to address various policies relevant
to ADB and DMCs. Detailed information about research topics studied by
ERD can be found on the ERD website ( />default.asp). Moreover, ERD has also systematically developed a survey data
depository of DMCs for further research.
15
PRISM is available at the ADB portal http://prism/adb_prism.
Poverty Impact Analysis: Tools and Applications
Introduction 25
Modeling Developments of the Tools
Identifi cation of the Poor
The poor are usually identifi ed using a benchmark level of income or
consumption. The most widely used data for measuring poverty in developing
countries is household consumption expenditure. The main reason for this
is that income data are hard to collect and are not accurate. On the other
hand, expenditure data is available for different kinds of products, such as
for food and nonfood commodities. Like income, expenditure data is also
expressed in monetary units making it very intuitive, easily understood on
a comparative scale, and useful in providing a basis for developing poverty
indicators.
16
For calculating poverty indicators using a poverty line, the poverty line is
commonly based on certain expenditure equivalents to food, nonfood, and
total poverty lines. The HCR, PGI, and PSI indicators can then be calculated
based on the poverty line.
Collecting data on household consumption expenditure, however, is not
simple. It involves plenty of effort, time, and resources. In addition, it also
demands patience and cooperation from respondents. The survey enumeration
for each household, for instance, may take as long as a week or more. To
record in-house consumption of food during the survey reference period,
respondents have to note all kinds of food expenditures by considering the
food available at the beginning and at the end of the survey reference period.
This is to ensure that the actual consumption by family members inside the
house is recorded. Enumerators also need to ensure that food consumed
outside the house is included in the enumeration to constitute the total food
consumption.
For nonfood commodities, data collection would involve a longer memory
recall, ranging from consumption for one month to one year, depending
on the type of nonfood products. Memory recall will affect data quality—in
general, the longer the recall period the more likely respondents will forget,
hence reducing data quality.
Considering the problems and diffi culties in conducting household
surveys mentioned above, researchers have tried to develop a proxy variable
16
The ratio of expenditures on food to total expenditure, for instance, has been widely
used in various demand analysis and is known as the Engle ratio. The ratio can
be used as a welfare indicator, showing that the higher the income, the lower the
ratio.