Aerodynamics for engineering students - part 8 pps
Bạn đang xem bản rút gọn của tài liệu. Xem và tải ngay bản đầy đủ của tài liệu tại đây (1.85 MB, 67 trang )
viscous
flow
and
boundary
layers
41
9
20
15
E
&
10.
Therefore
-
/
5
5
x
0.241
Ca
I
5
or, in terms of Reynolds number
Re,,
this becomes
-k
Laminar growt
I
X
6
=
0.383
~
(Re,)115
(7.81)
The developments of laminar and turbulent layers for a given stream velocity are
shown plotted in Fig.
7.23.
In order
to
estimate the other thickness quantities for the turbulent layer, the
following integrals must be evaluated:
(c)
_-_-
-
0.175
- -
8
10
Using the value for
I
in Eqn (a) above
(I
=
=
0.0973)
and substituting appropri-
ately for
6,
from Eqn
(7.81)
and for the integral values, from Eqns
(b)
and (c), in Eqns
(7.16), (7.17)
and
(7.18),
leads to
0.0479~
(Re,)
'I5
0.0372~
(Re,)
'I5
0.0761~
(Re,)
'I5
6*
=
0.1256
=
~
19
=
0.09736
=
~
6**
=
0.1756
=
~
(7.82)
(7.83)
(7.84)
x
(metres)
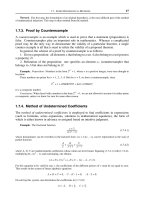
Fig.
7.23
Boundary layer
growths
on
flat plate at free stream speed
of
60rnls-l
420
Aerodynamics for Engineering Students Aerodynamics for Engineering Students
Pi
0.9
0.8
0.7
-
0.6
0.5
-
0.4
-
0.3
-
-
-
U
-
0
0.1
0.2
0.3
0.4
0.5
0.6
0.7
0.8
1.0
0.9
0.8
0.7
-
0.6
0.5
-
0.4
-
0.3
-
-
-
U
-
0
0.1
0.2
0.3
0.4
0.5
0.6
0.7
0.8
1.0
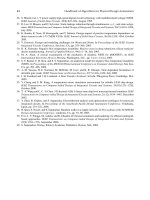
Fig.
7.24
Turbulent velocity profile
The seventh-root profile
with
the
above
thickness quantities indicated
is
plotted
in
Fig.
7.24.
Example
7.4
A wind-tunnel working section is to be designed to work with no streamwise
pressure gradient when running empty at an airspeed of 60m
s-'.
The working section is 3.6m
long and has a rectangular cross-section which is 1.2 m wide by 0.9 m high. An approximate
allowance for boundary-layer growth is to be made by allowing the side walls
of
the working
section to diverge slightly. It is to be assumed that, at the upstream end of the working
section, the turbulent boundary layer is equivalent to one that has grown from zero
thickness over a length
of
2.5 m; the wall divergence is to be determined
on
the assumption
that the net area of flow is correct at the entry and exit sections
of
the working section.
What must be the width between the walls at the exit section if the width at the entry section
is exactly 1.2 m?
For the seventh-root profile:
At entry,
x
=
2.5 m. Therefore
U
x 60
x
2.5
Re,=-=
-
102.7
x
lo5
v
14.6
x
10W-
=
25.2
Viscous
flow
and boundary layers
421
1.e.
At exit,
x
=
6.1 m. Therefore
Rei/'
=
30.2
1.e.
0.0479
x
6.1
30.2
s*=
=
0.00968
m
Thus
S*
increases by (0.009 68
-
0.004 75)
=
0.004 93 m.
This
increase in displacement thick-
ness
OCCUTS
on all four walls, i.e. total displacement area at exit (relative to entry)
=
0.00493
x
2(1.2
+
0.9)
=
0.0207m2.
The allowance is to be made
on
the two side walls only
so
that the displacement area on side
walls
=
2
x
0.9
x
=
1.88" m2, where A* is the exit displacement per wall. Therefore
A"
=-
0207
=
0.0115m
1.8
This is the displacement for each wall,
so
that the total width between side walls at the exit
section
=
1.2+2
x
0.0115
=
1.223m.
7.7.6
Drag coefficient for a flat plate with wholly turbulent
boundary layer
The local friction coefficient
Cf
may now be expressed in terms of
x
by substituting
from Eqn
(7.81)
in Eqn
(7.80).
Thus
'I4
(Re,)'/20
0.0595
(;L)
(0.383~)'~~
-
(ReX)'l5
Cf
=
0.0468
-
whence
(7.85)
(7.86)
The total surface friction force and drag coefficient for
a
wholly turbulent boundary
layer on a flat plate follow as
C,
=
i'
Cfd(:)
=
i'0.0595($-) 115x-1/5d(3
(7.87)
=
(&)
115x~.~595
[;i
5
(z)
x
415
]
=
0.0744Re-'I5
0
and
cD,
=
0.1488Re-'I5 (7.88)
422
Aerodynamics
for
Engineering
Students
Fig.
7.25
Two-dimensional surface friction drag coefficients for a flat plate. Here
Re
=
plate Reynolds
number, i.e.
U,L/v;
Ret
=
transition Reynolds number, i.e.
U,xt/vl,
CF
=
F/$pU$L;
F
=
skin friction
force per surface (unit width)
These expressions are shown plotted in Fig.
7.25
(upper curve). It should be clearly
understood that these last two coefficients refer to the case of a flat plate for which
the boundary layer is turbulent over the entire streamwise length.
In practice, for Reynolds numbers
(Re)
up to at least
3
x
lo5,
the boundary layer
will be entirely laminar. If the Reynolds number is increased further (by increasing
the flow speed) transition to turbulence in the boundary layer may be initiated
(depending
on
free-stream and surface conditions) at the trailing edge, the transition
point moving forward with increasing
Re
(such that
Re,
at transition remains
approximately constant at a specific value,
Ret,
say). However large the value of
Re
there will inevitably be a short length of boundary layer near the leading edge that
will remain laminar to as far back on the plate as the point corresponding to
Re,
=
Ret.
Thus, for a large range of practical Reynolds numbers, the boundary-
layer flow on the plate will be partly laminar and partly turbulent. The next stage is to
investigate the conditions at transition in order to evaluate the overall drag coeffi-
cient for the plate with mixed boundary layers.
7.7.7
Conditions at transition
It is usually assumed for boundary-layer calculations that the transition from lam-
inar to turbulent flow within the boundary layer occurs instantaneously. This is
obviously not exactly true, but observations of the transition process do indicate
that the transition region (streamwise distance) is fairly small,
so
that as a
first approximation the assumption is reasonably justified. An abrupt change in
momentum thickness at the transition point would imply that dO/dx is infinite. The
viscous
flow
and boundary layers
423
simplified momentum integral equation
(7.66)
shows that this in turn implies that the
local skin-friction coefficient
Cf
would be infinite. This is plainly unacceptable on
physical grounds,
so
it follows that the momentum thickness will remain constant
across the transition position. Thus
eLt
=
OT,
(7.89)
where the suffices
L
and T refer to laminar and turbulent boundary layer flows
respectively and t indicates that these are particular values at transition. Thus
The integration being performed in each case using the appropriate laminar or
turbulent profile. The ratio of the turbulent to the laminar boundary-layer thick-
nesses is then given directly by
(7.90)
Using the values of
Z
previously evaluated for the cubic and seventh-root profiles
(Eqns (ii), Sections 7.6.1 and
7.7.3):
6~~
0.139
6~~
0.0973
-
1.43
-
(7.91)
This indicates that on a flat plate the boundary layer increases in thickness by about
40%
at transition.
It is then assumed that the turbulent layer, downstream of transition, will grow as
if it had started from zero thickness at some point ahead of transition and developed
along the surface
so
that its thickness reached the value
ST,
at the transition position.
7.7.8
Mixed boundary layer flow on
a
flat plate
with zero pressure gradient
Figure
7.26
indicates the symbols employed to denote the various physical dimen-
sions used. At the leading edge,
a
laminar layer will begin to develop, thickening with
distance downstream, until transition to turbulence occurs at some Reynolds number
Ret
=
U,x,/v.
At transition the thickness increases suddenly from
6~~
in the laminar
layer to
ST,
in the turbulent layer, and the latter then continues to grow as if it had
started from some point on the surface distant
XT,
ahead of transition, this distance
being given by the relationship
for the seventh-root profile.
The total skin-friction force coefficient
CF
for one side of the plate of length
L
may
be found by adding the skin-friction force per unit width for the laminar boundary
layer of length
xt
to that for the turbulent boundary layer of length
(L
-
xt),
and
424
Aerodynamics
for
Engineering Students
I,
C
0
c
Hypothetical posit ion
%
for start
of
turbulent
layer
Q
Turbulent layer boundary
Laminar layer
/
L-x+
or
(I p)c
L
(or
c)
Fig.
7.26
dividing by
$pUkL,
where
L
is here the wetted surface area per unit width. Working
in terms of
Ret,
the transition position is given by
V
xt
=
-Ret
u,
(7.92)
The laminar boundary-layer momentum thickness at transition is then obtained from
Eqn
(7.70):
0.646xt
eLt
=
-
-
(Ret
1
that, on substituting for
xt
from Eqn
(7.92),
gives
V
eLt
=
0.646
-
(Ret)
lI2
u,
(7.93)
The corresponding turbulent boundary-layer momentum thickness at transition then
follows directly from Eqn
(7.83):
(7.94)
The equivalent length of turbulent layer
(xT,)
to
give this thickness is obtained from
setting
=
eTt;
using Eqn
(7.93)
and
(7.94)
this gives
115
0.646~~
(L)’”=
0.037~~~
Ua3xt
leading to
Viscous
flow
and boundary layers
425
Thus
(7.95)
v
518
XT~
=
35.5-Ret
UCCl
Now, on a flat plate with
no
pressure gradient, the momentum thickness at transition
is a measure of the momentum defect produced in the laminar boundary layer
between the leading edge and the transition position by the surface friction stresses
only.
As
it is
also
being assumed here that the momentum thickness through transi-
tion is constant, it is clear that the actual surface friction force under the laminar
boundary layer of length
xt
must be the same as the force that would exist under
a turbulent boundary layer of length
XT~.
It then follows that the total skin-friction
force for the whole plate may be found simply by calculating the skin-friction force
under a turbulent boundary layer acting over a length from the point at a distance
XT,
ahead of transition, to the trailing edge. Reference to Fig. 7.26 shows that the total
effective length of turbulent boundary layer is, therefore,
L
-
xt
+
XT,.
Now, from Eqn (7.21),
Cfdx
I;
=
g'-xt+xT'
where
Cf
is given from Eqn (7.85) as
0.0595
115
(Rex)
,15
-
0.0595
(&)
x-lI5
Thus
1
(IJ)
'I5:
[x4,5]
L-xt+xTt
F
=
-pU;$
x
0.0595
-
2
Now,
CF
=
F/$pU$,L,
where
L
is the total chordwise length of the plate, so that
=
0.0744(~)
v
(y
U,L
-
-
uoox
UL
V V
i.e.
518
415
(Re
-
Ret
+
35.5Ret
)
0.0744
Re
CF
=
-
(7.96)
This result could have been obtained, alternatively, by direct substitution of the
appropriate value
of
Re
in Eqn (7.87), making the necessary correction for effective
chord length (see Example 7.5).
The expression enables the curve of either
CF
or
CD~,
for the flat plate, to be
plotted against plate Reynolds number
Re
=
(U,L/v)
for a known value of the
transition Reynolds number
Ret.
Two such curves for extreme values of
Ret
of
3
x
lo5
and
3
x
IO6
are plotted in Fig. 7.25.
It should be noted that Eqn (7.96) is not applicable for values
of
Re
less than
Ret,
when Eqns (7.71) and (7.72) should be used. For large values of
Re,
greater than
about lo8, the appropriate all-turbulent expressions should be used. However,
426
Aerodynamics
for
Engineering Students
Eqns
(7.85) and (7.88) become inaccurate for Re
>
lo7.
At higher Reynolds numbers
the semi-empirical expressions due to Prandtl and Schlichting should be used, i.e.
Cf
=
[210glo(Re,)
-
0.65]-2.3
(7.97a)
0.455
(log,, Re)2.58
CF
=
(7.97b)
For the lower transition Reynolds number
of
3
x
lo5
the corresponding value
of
Re, above which the all-turbulent expressions are reasonably accurate, is
lo7.
Example
7.5
(1) Develop an expression for the drag coefficient of a flat plate of chord
c
and
infinite span at zero incidence in a uniform stream of air, when transition occurs at a distance
pc
from the leading edge. Assume the following relationships for laminar and turbulent
boundary layer velocity profiles, respectively:
(2)
On a
thin
two-dimensional aerofoil of 1.8 m chord in an airstream of 45 m
s-',
estimate the
required position of transition to give a drag per metre span that is 4.5N less than that for
transition at the leading edge.
(1) Refer
to
Fig.
7.26
for notation.
From Eqn
(7.99,
setting xt
=
pc
Equation
(7.88)
gives the drag coefficient for an all-turbulent boundary layer as
C,
=
0.1488/Re''5. For the mixed boundary layer, the drag is obtained as for an all-turbulent
layer
of
length [XT,
+
(1
-
p)c].
The corresponding drag coefficient (defined with reference to
length [XT~
+
(1
-
p)c])
is then obtained directly from the all-turbulent expression where
Re
is
based
on
the same length
[m,
+
(1
-p)c].
To relate the coefficient to the whole plate length
c
then requires that the quantity obtained should now be factored by the ratio
[XTt
+
(1
-p)c1
C
Thus
1415
-
-
[FxT~
+
(1
-p)Re
0.1488[x~,
+
(1
-p)cI4/'
-
-
(
v
)4/5
+c
Dz
N.B.
Re
is here based
on
total plate length
c.
Substituting from Eqn (i) for XT,, then gives
CD,
=-
0'1488
[35.5p5I8Re5I8
+
(1
-p)ReI4l5
Re
This
form of expression (as an alternative to Eqn
(7.96))
is convenient for enabling a quick
approximation to skin-friction drag to be obtained when the position of transition is likely to
be fixed, rather than the transition Reynolds number, e.g. by position of maximum thickness,
although strictly the profile shapes will not be unchanged with length under these conditions
and neither will
U,
over the length.
viscous
flow
and boundary layers
427
(2)
With transition at the leading edge:
0.1488
CDF
=Re'/5
In this case
Uc
45
x
1.8
v
14.6
x
Re=-=
=
55.5 io5
Re'f5
=
22.34
and
0.1488
CD,
=-
22.34
=
0.006 67
The corresponding aerofoil drag is then
DF
=
0.006 67
x
0.6125
x
(45)'
x
1.8
=
14.88
N.
With transition at
pc, DF
=
14.86
-
4.5
=
10.36N,
i.e.
C,
=
10.36
x
0.006 67
=
0.004 65
14.88
Using this value in (i), with
ReSi8
=
16 480,
gives
0.1488
0.004 65
=
[35.5p5f8
x
16480
+
55.8
x
lo5
-
55.8
x
I05pj4f5
55.8
x
105
i.e.
55.8
465
5f4
-
55.8
x
lo5
=
(35.6
-
55.8)105
(
0.1488
)
5.84
-
55.8
x
1oSp
=
or
55.8~
-
5.84~~1~
=
20.2
The solution
to
this (by successive approximation) is
p
=
0.423,
i.e.
pc
=
0.423
x
1.8
=
0.671
m behind leading edge
Example
7.6
A
light aircraft has a tapered wing with root and tip chord-lengths of
2.2
m and
1.8
m respectively and
a
wingspan of
16
m. Estimate the skin-friction drag of the wing when the
aircraft is travelling at
55
m/s. On the upper surface the point
of
minimum pressure is located at
0.375
chord-length from the leading edge. The dynamic viscosity and density
of
air may
be taken as
1.8
x
The average wing chord is given by
F
=
0.5(2.2
+
1.8)
=
2.0m,
so
the wing
is
taken
to
be
equivalent to a
flat
plate measuring
2.0m
x
16m.
The overall Reynolds number based
on
average chord is given by
kg
s/m
and
1.2
kg/m3 respectively.
1.2
x
55
x
2.0
Re
=
=
7.33
x
106
1.8
x
10-5
Since this is below
lo7
the guidelines at the end of Section
7.9
suggest that the transition point
will be very shortly after the point of minimum pressure,
so
xt
0.375
x
2.0
=
0.75m; also
Eqn
(7.96)
may be used.
Ret
=
0.375
x
Re
=
2.75
x
lo6
428
Aerodynamics
for
Engineering Students
So
Eqn (7.96) gives
CF
=
0'0744
(7.33
x
lo6
-
2.75
x
lo6
+
35.5(2.75
x
106)5/8}4/5
=
0.0023
7.33
x
106
Therefore the skin-friction drag of the upper surface is given by
1
2
D
=
-~U&~SCF
=
0.5
x
1.2
x
552
x
2.0
x
16
x
0.0023
=
133.8N
Finally, assuming that the drag of the lower surface is similar, the estimate for the total skin-
friction drag for the wing is 2
x
133.8
N
270N.
7.8
Additional examples
of
the application
of
the momentum integral equation
For the general solution
of
the momentum integral equation it is necessary to resort
to computational methods, as described in Section 7.11. It is possible, however, in
certain cases with external pressure gradients to find engineering solutions using the
momentum integral equation without resorting to a computer. Two examples are
given here. One involves the use of suction to control the boundary layer. The other
concerns determining the boundary-layer properties at the leading-edge stagnation
point of an aerofoil. For such applications Eqn (7.59) can be written in the alter-
native
form
with
H
=
@/e:
Cf
-
Vs
9
due de
2
U,
Ue dx dx
-
-
-+
(H
+
2)
t-
(7.98)
When, in addition, there is no pressure gradient and no suction, this further reduces
to the simple momentum integral equation previously obtained (Section 7.7.1, Eqn
(7.66)), i.e. Cf
=
2(d9/dx).
Example
7.7
A
two-dimensional divergent duct has a total included angle, between the plane
diverging walls, of 20". In order to prevent separation from these walls and also to maintain a
laminar boundary-layer flow, it is proposed to construct them of porous material
so
that
suction may be applied
to
them.
At
entry
to
the diffuser duct, where the flow velocity
is
48ms-' the section is square with a side length of 0.3m and the laminar boundary layers
have a general thickness
(6)
of 3mm. If the boundary-layer thickness is to be maintained
constant at this value, obtain an expression in terms of
x
for the value of the suction vel-
ocity required, along the diverging walls. It may be assumed that for the diverging walls
the laminar velocity profile remains constant and is given approximately by
0
=
1.65j3
-
4.30jj2
+
3.65j.
The momentum equation for steady flow along the porous walls is given by Eqn (7.98) as
If the thickness
6
is to remain constant and the profile also, then
0
=
constant and dO/dx
=
0.
Also
Viscous
flow
and boundary
layers
429
i.e.
aa
-
=
4.959
-
8.607
+
3.65
8j
(E)
=
3.65
W
Equation (7.16) gives
(1
-
1.65j3
+
4.30j2
-
3.65J)dY
=
0.1955
Equation (7.17) gives
=
6'
u(l
-
a)dy
=
(3.657
-
17.657'
+
33.05~~
-
30.55j+
+
14.2~~
-
2.75j+)d7
=
0.069
-
2.83
H=-=
6*
0.1955
e
0.069
Also
6
=
0.003 m
section, i.e.
Diffuser duct cross-sectional area
=
0.09
+
0.06~ tan
10"
where x
=
distance from entry
A
=
0.09
+
0.106~
and
A/Ae
=
1
+
1.178~
where
suffix
i
denotes the value at the entry section.
Also
A,
U,
=
A U,
A
48
u Iu
-
e
-
A
-
1
+
1.178~
Then
-=
due -48
x
1.178(1
+
1.178~)-'
dx
Finally
14.6
x
3.65
+
48
x
1.178
x
4.83
x
0.003
x
0.069
0.003
(1
+
1.178~)'
v,
=
0.0565
(1
+
1.178~)~
=
0.0178
+
m
s-'
Thus the maximum suction
is
required at entry, where
V,
=
0.0743 m
s-l.
For bodies with sharp leading edges such as flat plates the boundary layer grows
from zero thickness. But in most engineering applications, e.g. conventional aero-
foils, the leading edge
is
rounded. Under these circumstances the boundary layer has
a
finite thickness at the leading edge,
as
shown in Fig. 7.27a. In order to estimate the
430
Aerodynamics
for
Engineering Students
Boundary-layer
edge
Boundary-layer edge
Stagnation
point
(b)
point
(a)
Fig.
7.27
Boundary-layer
flow
in the vicinity
of
the
fore
stagnation point
initial boundary-layer thickness it can be assumed that the flow in the vicinity
of
the
stagnation point is similar to that approaching a flat plate oriented perpendicularly
to the free-stream, as shown in Fig. 7.27b. For this flow
U,
=
ex
(where
c
is
a constant) and the boundary-layer thickness does not change with
x.
In the example
given below the momentum integral equation will be used to estimate the initial
boundary-layer thickness
for
the flow depicted in Fig. 7.27b.
An
exact solution to the
NavierStokes equations can be found for
this
stagnation-point flow (see Section
2.10.3). Here the momentum integral equation is used to obtain an approximate
solution.
Example
7.8
Use the momentum integral equation (7.59) and the results (7.64a', b', c') to
obtain expressions
for
6,6*,
0
and
Cf.
It may be assumed that the boundary-layer thickness
does not vary with
x
and that
Ue
=
cx.
Hence
0
=
const.
also
and Eqn (7.59) becomes
Substituting Eqns (7.64a', b', c') leads to
Multiplying both sides by Slvcx and using the above result for
A,
gives
After rearrangement this equation simplifies to
or
0.00022A3
+
0.01045Az
-
0.3683A
+
2
=
0
Viscous
flow
and boundary layers
431
It
is
known
that
A
lies
somewhere
between
0
and
12
so it
is
relatively easy
to
solve
this
equation
by
trial
and
error
to
obtain
A
=
7.052
+
S
=
E
=
2.6556
Using Eqns
(7.64a’,
b’,
c’)
then
gives
Once
the
value
of
c
=
(dU,/dx),=,
is
specified
(see
Example
2.4)
the
results
given
above
can
be
used
to
supply initial
conditions
for
boundary-layer
calculations over aerofoils.
7.9
Laminar-turbulent transition
It was mentioned in Section 7.2.5 above that transition from laminar to turbulent
flow usually occurs at some point along the surface. This process is exceedingly
complex and remains an active area of research. Owing to the very rapid changes
in both space and time the simulation of transition is, arguably, the most challenging
problem in computational fluid dynamics. Despite the formidable difficulties how-
ever, considerable progress has been made and transition can now be reliably
predicted in simple engineering applications. The theoretical treatment of transition
is beyond the scope of the present work. Nevertheless, a physical understanding of
transition is vital for many engineering applications of aerodynamics, and accord-
ingly a brief account of the underlying physics of transition in a boundary layer
on
a flat plate is given below.
Transition occurs because of the growth of small disturbances in the boundary
layer. In many respects, the boundary layer can be regarded as a complex nonlinear
oscillator that under certain circumstances has an initially linear wave-like response
to external stimuli (or inputs). This is illustrated schematically in Fig. 7.28. In free
flight or in high-quality wind-tunnel experiments several stages in the process can be
discerned. The first stage is the conversion of external stimuli or disturbances into
low-amplitude waves. The external disturbances may arise from a variety of different
sources, e.g. free-stream turbulence, sound waves, surface roughness and vibration.
The conversion process is still not well understood. One of the main difficulties is that
the wave-length of a typical external disturbance is invariably very much larger than
that of the wave-like response of the boundary layer. Once the low-amplitude wave is
generated it will propagate downstream in the boundary layer and, depending on the
local conditions, grow or decay. If the wave-like disturbance grows it will eventually
develop into turbulent flow.
While their amplitude remains small the waves are predominantly two-dimen-
sional (see Figs 7.28 and 7.29). This phase of transition is well understood and was
first explained theoretically by Tollmien* with later extensions by Schlichtingt and
many others. For this reason the growing waves in the early so-called linear phase of
transition are known as
Tollmien-Schlichting waves.
This linear phase extends for
some 80% of the total transition region. The more advanced engineering predictions
*
W.
Tollmien (1929) Uber die Entstehung der Turbulenz.
I.
Mitt. Nachr. Ges. Wiss. Gottingen, Math.
Phys.
Klasse,
pp.
2144.
+
H.
Schlichting (1933) Zur Entstehung der Turbulenz bei der Plattenstromung.
Z.
angew. Math. Mech.,
13,
171-1 74.
flow
and boundary
layers
433
are, in fact, based on modern versions of Tollmien's linear theory. The theory is
linear because it assumes the wave amplitudes are
so
small that their products can be
neglected. In the later nonlinear stages of transition the disturbances become increas-
ingly three-dimensional and develop very rapidly. In other words as the amplitude
of
the disturbance increases the response of the boundary layer becomes more and more
complex.
This view of transition originated with Prandtl* and his research team at Gottingen,
Germany, which included Tollmien and Schlichting. Earlier theories, based on
neglecting viscosity, seemed to suggest that small disturbances could not grow in
the boundary layer. One effect of viscosity was well known. Its so-called dissipative
action in removing energy from
a
disturbance, thereby causing it to decay. Prandtl
realized that, in addition to its dissipative effect, viscosity also played
a
subtle but
essential role in promoting the growth of wave-like disturbances by causing energy to
be transferred to the disturbance. His explanation is illustrated in Fig.
7.30.
Consider
a small-amplitude wave passing through a small element of fluid within the boundary
Small-amplitude wave
(
b)
No
viscosit u'and
v'90
degrees
out
of
(
c
)
With -ity phase difference exceeds
phase.
u#
=
0
90Ou'v'<
0
Fig.
7.30
Prandtl's explanation for disturbance growth
*
L.
F'randtl(l921) Bermerkungen uber die Enstehung der Turbulenz,
Z.
mgew.
Math.
Mech.,
1,431436.
434
Aerodynamics for Engineering Students
layer, as shown in Fig. 7.30a. The instantaneous velocity components of the wave are
(u',
v')
in the
(x,
y)
directions,
u'
and
v'
are very much smaller than
u,
the velocity in
the boundary layer in the absence of the wave. The instantaneous rate of increase in
kinetic energy within the small element is given by the difference between the rates at
which kinetic energy leaves the top of the element and enters the bottom, i.e.
I
tau
aY
-pu
v
-
+
higher order terms
In the absence of viscosity
u'
and
v'
are exactly
90
degrees out of phase and the
average of their product over a wave period, denoted by
u",
is zero, see Fig. 7.30b.
However, as realized by Prandtl, the effects of viscosity are to increase the phase
difference between
u'
and
v'
to slightly more than
90
degrees. Consequently, as shown
in Fig. 7.30c,
u"
is now negative, resulting in a net energy transfer to the disturbance.
The quantity
-pa
is, in fact, the Reynolds stress referred to earlier in Section 7.2.4.
Accordingly, the energy transfer process is usually referred to as
energy production by
the Reynolds stress.
This mechanism is active throughout the transition process and,
in fact, plays a key role in sustaining the fully turbulent flow (see Section 7.10).
Tollmien was able to verify Prandtl's hypothesis theoretically, thereby laying the
foundations of the modern theory for transition. It was some time, however, before
the ideas of the Gottingen group were accepted by the aeronautical community. In
part this was because experimental corroboration was lacking.
No
sign of Tollmien-
Schlichting waves could at first be found in experiments on natural transition.
Schubauer and Skramstadt* did succeed in seeing them but realized that in order
to study such waves systematically they would have to be created artificially in
a controlled manner.
So
they placed a vibrating ribbon having a controlled frequency,
w,
within the boundary layer to act as a wave-maker, rather than relying on natural
sources of disturbance. Their results are illustrated schematically in Fig. 7.31. They
found that for high ribbon frequencies, see Case (a), the waves always decayed. For
intermediate frequencies (Case (b)) the waves were attenuated just downstream of the
ribbon, then at a greater distance downstream they began to grow, and finally at still
greater distances downstream decay resumed. For low frequencies the waves grew
until their amplitude was sufficiently large for the nonlinear effects, alluded to above,
to set in, with complete transition to turbulence occurring shortly afterwards. Thus, as
shown in Fig. 7.31, Schubauer and Skramstadt were able to map out a curve of non-
dimensional frequency versus
Re,(=
U,x/v)
separating the disturbance frequencies
that will grow at a given position along the plate from those that decay. When
disturbances grow the boundary-layer flow is said to be
unstable
to
small disturbances,
conversely when they decay it is said to be
stable,
and when the disturbances neither
grow nor decay it is in a state of
neutralstability.
Thus the curve shown in Fig. 7.31 is
known as the
neutral-stability boundary
or curve. Inside the neutral-stability curve,
production of energy by the Reynolds stress exceeds viscous dissipation, and vice versa
outside. Note that a
critical Reynolds number Re,
and
critical frequency
wc
exist. The
Tollmien-Schlichting waves cannot grow at Reynolds numbers below
Re,
or at
frequencies above
w,.
However, since the disturbances leading to transition to turbu-
lence are considerably lower than the critical frequency, the transitional Reynolds
number is generally considerably greater than
Re,.
The shape of the neutral-stability curve obtained by Schubauer and Skramstadt
agreed well with Tollmien's theory, especially at the lower frequencies of interest for
*
G.B.
Schubauer and
H.K.
Skramstadt (1948) Laminar boundary layer oscillations and transition on
a
flat plate.
NACA
Rep.,
909.
Viscous
flow
and boundary layers
435
t
Vibrating
I
Boundary-layer edge
ribbon TdJrnien-Schlichting waves
(a)
eutral-stability boundary
(C)
I
I
ux
-1.
Y
4
-
Turbulent
flow
Fig.
7.31
Schematic
of
Schubauer and Skramstadt’s experiment
transition. Moreover Schubauer and Skramstadt were also able to measure the
growth rates of the waves and these too agreed well with Tollmien and Schlichting’s
theoretical calculations. Publication of Schubauer and Skramstadt’s results finally
led to the Gottingen ‘small disturbance’ theory of transition becoming generally
accepted.
It was mentioned above that Tollmien-Schlichting waves could not be easily
observed in experiments
on
natural transition. This is because the natural sources
of disturbance tend to generate wave packets in an almost random fashion in time
and space.
Thus
at any given instant there is
a
great deal of ‘noise’, tending to obscure
the wave-like response of the boundary layer, and also disturbances having a wide
range of frequencies are continually being generated. In contrast, the Tollmien-
Schlichting theory is based on disturbances with
a
single frequency. Nevertheless,
providing the initial level of the disturbances is low, what seems to happen is that the
boundary layer responds preferentially,
so
that waves of a certain frequency grow
most rapidly and are primarily responsible for transition. These most rapidly grow-
ing waves are those predicted by the modern versions
of
the Tollmien-Schlichting
theory, thereby allowing the theory to predict, approximately at least, the onset
of
natural transition.
It has been explained above that provided the initial level
of
the external distur-
bances
is
low, as in typical free-flight conditions, there is a considerable difference
between the critical and transitional Reynolds number. In fact, the latter
is
about
3
x
lo6
whereas
Re,
N
3
x
lo5.
However, if the initial level of the disturbances rises,
for example because of increased free-stream turbulence or surface roughness, the
436
Aerodynamics
for
Engineering Students
downstream distance required for the disturbance amplitude to grow sufficiently for
nonlinear effects to set in becomes shorter. Therefore, the transitional Reynolds
number
is
reduced to a value closer to
Re,.
In fact, for high-disturbance environ-
ments, such as those encountered in turbomachinery, the linear phase
of
transition
is by-passed completely and laminar flow breaks down very abruptly into fully
developed turbulence.
The Tollmien-Schlichting theory can also predict very successfully how transition
will be affected by an external pressure gradient. The neutral-stability boundaries for
the flat plate and for typical adverse and favourable pressure gradients are plotted
schematically in Fig.
7.32.
In accordance with the theoretical treatment
Re6
is used as
the abscissa in place of
Re,.
However, since the boundary layer grows with passage
downstream
Res
can still be regarded as a measure of distance along the surface.
From Fig.
7.32
it can be readily seen that for adverse pressure gradients not only is
(Res),
smaller than for a flat plate, but a much wider band of disturbance frequencies
are unstable and will grow. When it is recalled that the boundary-layer thickness
also
grows more rapidly in an adverse pressure gradient, thereby reaching a given critical
value of
Res
sooner, it can readily be seen that transition is promoted under these
circumstances. Exactly the converse is found for the favourable pressure gradient.
This circumstance allows rough and ready predictions to be made for the transition
Fig.
7.32
Schematic plot
of
the effect
of
external pressure gradient on the neutral stability boundaries
Viscous
flow
and boundary layers
437
Minimum
pressure
"'1'"
-in
1
uQ
1
.o
I
Fig.
7.33
Modern laminar-flow aerofoil and its pressure distribution
point on bodies and wings, especially in the case of the more classic streamlined
shapes. These guidelines may be summarized as follows:
(i) If
lo5
<
ReL
<
lo7
(where
ReL
=
U,L/v
is based
on
the total length or chord
of
the body or wing) then transition will occur very shortly downstream of the
point of minimum pressure. For aerofoils at zero incidence or for streamlined
bodies of revolution, the point of minimum pressure often, but not invariably,
coincides with the point of maximum thickness.
(ii) If for an aerofoil
ReL
is kept constant increasing the angle of incidence advances
the point of minimum pressure towards the leading edge on the upper surface,
causing transition to move forward. The opposite occurs on the lower surface.
(iii) At constant incidence an increase
in
ReL
tends to advance transition.
(iv) For
ReL
>
lo7
the transition point may slightly precede the point of minimum
The effects of external pressure gradient
on
transition also explain how it may be
postponed by designing aerofoils with points of minimum pressure further aft.
A typical modern aerofoil of this type is shown in Fig.
7.33.
The problem with this
type
of
aerofoil is that, although the onset of the adverse pressure gradient is
postponed, it tends to be correspondingly more severe, thereby giving rise to bound-
ary-layer separation. This necessitates the use
of
boundary-layer suction aft of the
point of minimum pressure in order
to
prevent separation and to maintain laminar
flow. See Section
7.4
and
8.4.1
below.
pressure.
7.10
The
physics
of
turbulent boundary layers
In this section, a brief account is given of the physics of turbulent boundary layers.
This is still very much a developing subject and an active research topic. But some
classic empirical knowledge, results and methods have stood the test of time and are
worth describing in a general textbook
on
aerodynamics. Moreover, turbulent flows
are
so
important for engineering applications that some understanding of the rele-
vant flow physics
is
essential for predicting and controlling flows.
438
Aerodynamics
for
Engineering Students
7.10.1
Reynolds averaging and turbulent stress
Turbulent flow is a complex motion that is fundamentally three-dimensional and
highly unsteady. Figure 7.34a depicts a typical variation of a flow variable,
f
,
such as
velocity or pressure, with time at a fixed point in a turbulent flow. The usual
approach in engineering, originating with Reynolds*, is to take a time average. Thus
the instantaneous velocity is given by
f
=f+f'
(7.99)
where the time average is denoted by
(
-
)
and
(
)I
denotes the fluctuation (or deviation
from the time average). The strict mathematical definition of the time average is
T
7
=
lim
-
f(x,
y,
z,
t
=
to
+
t')dt'
T-w
(7.100)
where
to
is the time at which measurement is notionally begun. For practical meas-
urements
T
is merely taken as suitably large rather than infinite. The basic approach
is often known as
Reynolds averaging.
Fig.
7.34
*
Reynolds,
0.
(1895)
'
On
the
dynamical
theory
of
incompressible
viscous
fluids and
the
determination
of
the
criterion',
Philosophical Transactions
of
the Royal Society
of
London,
Series
A,
186,
123.
Viscous
flow
and boundary layers
439
We will now use the Reynolds averaging approach on the continuity equation
(2.94) and x-momentum Navier-Stokes equation (2.95a). When Eqn (7.99) with
u
for
fand similar expressions for
v
and
w
are substituted into Eqn (2.94) we obtain
dii
av
aiit
dd
dv'
dw'
-+-+-+-+-+-=O
ax
ay
az
ax
ay
az
(7.101)
Taking
a
time average
of
a fluctuation gives zero by definition,
so
taking a time
average
of
Eqn (7.101) gives
Subtracting Eqn (7.102) from Eqn (7.101) gives
aul
avl
awl
-+-+-=o
ax
ay
dz
(7.102)
(7.103)
This result will be used below.
(2.95a) to obtain
We now substitute Eqn (7.99) to give expressions for
u,
v,
w
and
p
into Eqn
We now take a time average of each term, noting that although the time average
of
a
fluctuation is zero by definition (see Fig. 7.34b), the time averageof a product
of
fluctuations
is
not, in general, equal to zero (e.g. plainly
u"
=
uR
>
0,
see Fig.
7.34b). Let
us
also assume that the turbulent boundary-layer flow
is
two-dimensional
when time-averaged,
so
that no time-averaged quantities vary with
z
and
W
=
0.
Thus
if we take the time average of each term
of
Eqn (7.104), it simplifies to
-
*
The term marked with
*
can be written as
Y
=O
from
Eqn
(7.103)
am
(7.105)
=O
no
variation
with
z
440
Aerodynamics
for
Engineering Students
So
that Eqn (7.105) becomes
where we have written
(7.106)
dii
-
aii
-
dX
dY
axx
=
p-
-
pu'2;
axy
=
p-
-
pdv'
This notation makes it evident that when the turbulent flow is time-averaged
-pz
and
-pa
take
on
the character of a direct and shear stress respectively. For
this
reason, the quantities are known as
Reynolds stresses
or
turbulent stresses.
In fully
turbulent
flows,
the Reynolds stresses are usually very much greater than the viscous
stresses. If the time-averaging procedure is applied to the full three-dimensional
Navier-Stokes equations
(2.95),
a Reynolds stress tensor is generated with the form
-p
("
u'v'
p
w)
(7.107)
It
can be seen that, in general, there are nine components of the Reynolds stress
comprising
six
distinct quantities.
u'v'
u'w'
mww"
7.10.2
Boundary-layer equations
for
turbulent
flows
For the applications considered here, namely two-dimensional boundary layers
(more generally, two-dimensional shear layers), only one of the Reynolds stresses
is significant, namely the Reynolds shear stress,
-pa.
Thus for two-dimensional
turbulent boundary layers the time-averaged boundary-layer equations (c.f.
Eqns
7.7
and 7.14), can be written in the form
(7.108a)
(7.108b)
The chief difficulty of turbulence is that there is
no
way of determining the Reynolds
stresses from first principles, apart from solving the unsteady three-dimensional
NavierStokes equations. It is necessary to formulate semi-empirical approaches
for modelling the Reynolds shear stress before one can begin the process of solving
Eqns (7.108a,b).
The momentum integral form of the boundary-layer equations derived in Section
7.6.1 is equally applicable to laminar or turbulent boundary layers, providing it is
recognized that the time-averaged velocity should be used in the definition of
momentum and displacement thicknesses.
This
is the basis of the approximate
methods described in Section 7.7 that are based
on
assuming a 1/7th. power velocity
profile and using semi-empirical formulae for the local skin-friction coefficient.
7.10.3
Eddy viscosity
Away from the immediate influence of the wall which has a damping effect on the
turbulent fluctuations, the Reynolds shear stress can be expected to be very much
Viscous
flow
and boundary layers
441
greater than the viscous shear stress. This can be seen by comparing rough order-
of-magnitude estimates of the Reynolds shear stress and the viscous shear stress, i.e.
-
dii
-puv
c.f.
p-
ay
Assume that
u"
N
CU;
(where
C
is a constant), then
w
1/Re
where
S
is the shear-layer width.
So
provided
C
=
O(1)
then
showing that for large values of
Re
(recall that turbulence is a phenomenon that
only occurs at large Reynolds numbers) the viscous shear stress will be negligible
compared with the Reynolds shear stress. Boussinesq* drew an analogy
between viscous and Reynolds shear stresses by introducing the concept of the
eddy
viscosity
ET:
viscous
shear
stress
Reynolds shear
stress
Boussinesq, himself, merely assumed that eddy viscosity was constant everywhere
in the flow field, like molecular viscosity but very much larger. Until comparatively
recently, his approach was still widely used by oceanographers for modelling turbu-
lent flows.
In
fact, though,
a
constant eddy viscosity is a very poor approximation for
wall shear flows like boundary layers and pipe flows. For simple turbulent free shear
layers, such as the mixing layer and jet (see Fig.
7.39,
and wake it is a reasonable
assumption to assume that the eddy viscosity varies in the streamwise direction but
not across a particular cross section. Thus, using simple dimensional analysis
Prandtlt and ReichardtS proposed that
ET=
K,
x
AU
X
6
(7.1
10)
n
is often called the
exchange coefficient
and it varies somewhat from one type
of
flow
to another. Equation
(7.110)
gives excellent results and can be used to determine
the variation of the overall flow characteristics in the streamwise direction (see
Example
7.9).
The outer
80%
or
so
of the turbulent boundary layer is largely free from the effects
of the wall. In this respect it is quite similar to a free turbulent shear layer. In this
v
v v
const.
Velocity
difference
across shear layer shear-layer width
*
J.
Boussinesq (1872)
Essai
sur
la thkorie des earn courantes.
Mirnoires
Acad.
des
Science,
Vol.
23,
No.
1,
Pans.
L.
Prandtl(l942) Bemerkungen
mr
Theorie der freien Turbulenz,
ZAMM,
22,241-243.
H.
Reichardt (1942) Gesetzmassigkeiten der freien Turbulenz,
VDZ-Forschungsheft,
414,
1st Ed., Berlin.
442
Aerodynamics
for
Engineering Students
Nozzle exit
Inviscid jet boundary
,_I_____ ___
U
J_
El
Average edge of turbulent jet
(a) Inviscid jet
profile
\-
v
Mixing-layer region
(b) Real turbulent jet
Fig.
7.35
An
ideal inviscid jet compared with a
real
turbulent jet near the nozzle exit
outer region it
is
commonly assumed, following Laufer (1954), that the eddy viscosity
can be determined by a version of Eqn (7.110) whereby
ET
=
Kueb*
(7.111)
Example
7.9
The spreading rate
of
a mixing layer
Figure 7.35 shows the mixing layer in the intial region
of
a jet. To a good approximation
the external mean pressure field for a free shear layer is atmospheric and therefore constant.
Furthermore, the Reynolds shear stress is very much larger than the viscous stress,
so
that,
after substituting Eqns (7.109) and (7.1 lo), the turbulent boundary-layer equation (7.108b)
becomes
The only length scale is the mixing-layer width,
6(x),
which increases with
x,
so
dimensional
arguments suggest that the velocity profde does not change shape when expressed in terms of
dimensionless
y,
i.e.
Viscous
flow
and boundary layers
4.43
This is known as making a similarity assumption. The assumed form of the velocity profile
implies that
where
F’(q)
dF/dq.
Integrate Eqn (7.108a) to get
so
a5
ax
V
=
UJ
-
G(q)
where
G
=
/
qF’(q)dq
The derivatives with respect to y are given by
aii
%dii
U.
-_
=
2
F’(q)
_-
ay-aydq
6
d2u
%d
aii
(
-
)
=ZF”(v)
ay*
-
aydq
ay
The results given above are substituted into the reduced boundary-layer equation to obtain,
after removing common factors,
_
-
v
Fn.
of
qonly
Fn.
of
x
only
Fn’
Of
’I
Only
Fn.
of
x
only
The braces indicate which terms are functions of x only or
q
only.
So,
we separate the variables
and thereby see that, in order for the similarity form of the velocity to be a viable solution, we
must require
1
d6
After simplification the term
on
the left-hand side implies
d6
-=const. or
6xx
dx
Setting the term, depending
on
q,
with
F”
as numerator, equal to a constant leads to a
differential equation for
F
that could be solved to give the velocity profile.
In
fact, it
is
easy
to derive a good approximation to the velocity profile,
so
this is a less valuable result.
When a turbulent (or laminar) flow
is
characterized by only one length scale
-
as in the
present case
-
the term sev-similarity is commonly used and solutions found this way are called
similarity solutions. Similar methods can be used to determine the overall flow characteristics
of other turbulent free shear layers.
7.10.4
Prandtl’s mixing-length theory
of
turbulence
Equation
(7.11
1)
is
not
a
good approximation in the region
of
the turbulent bound-
ary layer
or
pipe flow near the wall. The eddy viscosity varies with distance from the
wall
in
this region.
A
commonly used approach
in
this near-wall region is based on