Dust Explosions in the Process Industries Second Edition phần 4 doc
Bạn đang xem bản rút gọn của tài liệu. Xem và tải ngay bản đầy đủ của tài liệu tại đây (3.89 MB, 66 trang )
Case histories 189
Figure
2.25
Sequence
of
nine impact energy pulses from nine successive explosions in the Harbin
Linen Textile Plant, Harbin, P.
R.
China, 15th March 1987, postulated on the basis of a seismic record
of the event (From
Xu
Bowen
et
al.,
1988)
190
Dust Explosions in the Process Industries
2.9.3
EXPLOSION
INITIATION AND DEVELOPMENT, SCENARIO 2
This alternative scenario originates from the investigation
of
Zhu Hailin (1988), who
found evidence
of
an initial smouldering dust fire caused by a live 40
W
electrical portable
light lamp lying in a flax dust layer
of
6-8
cm thickness in a ventilation room. He also
found evidence
of
flame propagation through the underground tunnels for the dust
collection ducting. On the basis
of
his analysis, Zhu suggested that the explosion was
initiated in the eastern dust collectors
(5
in Figure 2.24) from which it transmitted to nine
units
of
the central dust collecting plant (1 and 2 in Figure 2. 24) via the ducting in the
underground tunnels. Severe room explosions were initiated when the ducting in the
tunnel ruptured, and the resulting blast dispersed large quantities of dust in the
workrooms into explosible clouds that were subsequently ignited. From the eastern dust
collectors the explosion also propagated into the underground flax stores.
It is not unlikely that even this scenario could be developed further in such a way as to
agree with the evidence from the seismic recording.
2.9.4
ADDITIONAL REMARK
The investigation
of
the Harbin disaster exposed the great difficulties in identifying the
exact course
of
events
of
major explosions creating massive damage. In addition to causing
pain and grief, loss
of
life also means loss
of
eye
witnesses. Besides, the immediate need
for fire fighting and rescue operations, changes the scene before the investigators can
make their observations. Also, the explosion itself often erases evidence, e.g.
of
the
ignition source.
This
problem was also shared by the experts who investigated the Harbin explosion, and
it seems doubtful that the exact course
of
events will ever be fully resolved.
However, the Harbin disaster unambiguously demonstrated the dramatic consequences
of
inadequate housekeeping in industrial plants where fine dust that can give dust
explosions, is generated.
2.1
0
FIRES AND EXPLOSIONS
IN
COAL DUST PLANTS
2.1
0.1
METHANE EXPLOSION
IN
17000
rn3
COAL
SILO
AT ELKFORD, BRITISH
COLUMBIA, CANADA,
IN
1982
As
mentioned in Section 1.5, handling and storage
of
coal can, in addition to the dust
explosion hazard, also present a gas explosion risk, due to release
of
methane from some
types
of
coal.
An
account
of
such an explosion was given by Stokes (1986).
The silo
of
height
48
m and diameter 21 m that exploded, was used for storage and
load-out of cleaned, dried metallurgical coal. The capacity
of
the silo was 15000 tonnes.
Case
histories
19
1
Prior to the explosion accident, a methane detector had been installed in the roof of the
silo. The detector activated a warning light in the silo control room when a methane
concentration
of
1%
was detected, and an alarm light was activated when detecting 2%
methane.
A
wet scrubber was located in the silo head house to remove dust from the
dust-laden air in the silo during silo loading. A natural ventilation methane stack was also
located in the silo roof to vent any build-up
of
methane gas from the silo.
The explosion occurred early in the morning on
1st
May, 1982, devastating the silo roof,
head house, and conveyor handling system. Witnesses stated that a flash was noticed in
the vicinity
of
the head house, followed seconds later by an explosion which displaced the
silo top structures. This was followed by an orange-coloured fire ball that rolled down the
silo walls and extinguished prior to reaching the base of the silo. Fortunately, neither
injury nor death resulted, and damage to surrounding structures was minimal, although
large blocks
of
concrete and reinforcing steel had been thrown several hundred metres
from the silo. However, the plant itself had suffered substantial damage.
The silo was full of coal 24 hours prior to the explosion. During the evening before the
explosion, 10
OOO
tonnes
of
coal were discharged. At the same time, conveying of
deep-seam coal into the silo commenced and continued until the explosion occurred. At
the time
of
the explosion, there were approximately 12
300
tonnes
of
coal in the silo,
of
which 7600 tonnes were deep-seam coal. Testing had shown that this quality
of
coal has a
high methane emission rate and produced a low volatile coal dust. Clouds in air of this dust
could not be ignited unless the air was mixed with methane.
The ignition source was not identified, but the following three possible sources were
considered:
0
Spontaneous combustion
of
the stored coal.
An electrical or mechanical source.
Hot coal from the thermal dryer.
During ten years of operation, with coal being stored in different environments for
varying lengths
of
time, spontaneous combustion had never presented a problem, and
consequently was not considered to be a probable source
of
ignition. During demolition
of
the damaged silo, all electrical and mechanical components were recovered and inspected
and did not show any evidence
of
being the ignition source. Stokes (1986) did not exclude
the remaining possibility that hot coal from the thermal dryer was the source
of
ignition.
2.1
0.2
METHANVCOAL DUST EXPLOSION IN
A
COAL STORAGE
SILO
AT
A
CEMENT
WORKS
AT
SAN BERNARDINO COUNTY, CALIFORNIA, USA
This incident was reported by Alameddin and Foster (1984). A fire followed by an
explosion occurred inside a coal silo
of
900 tonnes capacity while the silo was nearly
empty, and the remaining
85
tonnes
of
coal were being discharged. Prior to the explosion,
a hot-spot
of
0.6 m
X
1.0 m had been detected on the lower part of the silo wall by means
of
an infrared heat detector. The hot-spot originated from smouldering combustion in the
coal in the silo. This process liberated methane, carbon monoxide and other combustible
gases from the coal. The explosion probably resulted from ignition
of
a mixture
of
combustible gas and airborne coal dust in the space above the bulk coal by the
192
Dust Explosions in the Process industries
smouldering fire or glow when it reached the surface of the coal deposit. (See Figure 1.9 in
Chapter
1.
)
It was concluded that the supply of carbon dioxide from the top, which was used for
suppressing the fire and preventing explosion, was insufficient to prevent the development
of an explosible atmosphere in the space above the bulk coal.
In order to prevent similar accidents in the future, it was recommended that a carbon
dioxide system be installed in both the top and bottom of the coal silo. Sufficient inerting
gas should be added for development of a slight positive pressure inside the silo. The
inerting gas must be of sufficient quantity to insure a nonexplosible atmosphere above the
coal and sufficient pressure to prevent a sudden inrush of fresh air into the silo.
2.1
0.3
GAS AND DUST EXPLOSION IN
A
PULVERIZED COAL PRODUCTION/
COMBUSTION PLANT IN
A
CEMENT FACTORY IN LAGERDORF IN
F.
R.
GERMANY, IN OCTOBER
1980
According to Patzke
(1981),
who described this explosion accident, the explosion occurred
while coal of about
30%
volatiles was milled at a rate of
55
tonnes per hour. The start-up
of the cement burner plant followed a compulsory break of at least 20 minutes of the
milling operation to allow all airborne dust
to
settle out. A few seconds after the main gas
valve had been opened, there was a violent explosion. The probable reason was a failure
in the system for electric ignition of the gas. Within the period of six seconds before the gas
valve was reclosed automatically, about
1
m3 of gas had been discharged to the
atmosphere of the hot combustion chamber and become mixed with the air to an
explosible gas cloud. The temperature of the walls of the chamber was sufficiently high to
ignite the gas, and a gas explosion resulted. The blast and flame jet from this comparat-
ively mild initial explosion was vented into the milling system where a large, turbulent dust
cloud was generated and ignited, resulting in a violent secondary dust explosion.
Various parts of the milling plant, some unvented and some vented, had all been
designed to withstand the pressure generated in an extensive dust explosion. Furthermore,
a passive device for explosion isolation of the type shown in Figure 1.82 in Chapter
1
had
been installed upstream of an electrostatic dust filter.
Apart from deformation of some explosion vent doors, the dip tubes of two cyclones,
and the coal feeder upstream of the mill, the plant had been able to withstand the
explosion without being damaged. The passive explosion isolation device effectively
protected the electrostatic filter from becoming involved in the system.
2.1
0.4
FURTHER EXPLOSION/FIRE INCIDENTS INVOLVING COAL
Anderson (1988) gave a step-by-step account of the process
of
extinction of a smould-
ering fire in a
50
m3 coal dust silo in Arvika in Sweden, in August 1988. It was necessary to
pay attention to the
risk
of explosion of combustible gases driven out of the coal by the
heat from the fire.
Case
histories
193
First gaseous carbon dioxide was loaded into the silo at the top to build up a lid
of
inert
atmosphere immediately above the coal deposit. Then all the coal was discharged carefully
through the exit at the silo bottom. In this particular case, supply
of
carbon dioxide at the
silo bottom was considered superfluous.
Wibbelhoff (1981) described a dust explosion in a coal dust burner plant of a cement
works in
F.
R.
Germany, in March 1981. Prior to the explosion, an electrical fault had
caused failure
of
an air blower. The explosion occurred just after restart of the repaired
blower. During the period in which the blower was out of operation, dust had accumulated
on the hot surfaces inside the furnace and ignited, and as soon as the blower was restarted,
the glowinghurning dust deposits were dispersed into a dust cloud that exploded
immediately.
Pfaffle (1987) gave a report
of
a dust explosion in the silo storage system of a pulverized
coal powder plant in Dusseldorf, F.
R.
Germany, in July 1985. The explosion occurred
early in the morning in a 72 m3 coal dust silo. The silo ruptured and burning material that
was thrown into the surroundings initiated a major fire, which was extinguished by means
of
water. Fortunately no persons were killed or injured in this primary accident. However,
during the subsequent cleaning-up process, a worker was asked to free the damaged silo of
ashes by hosing it down with water. It then appeared that a glowing fire had developed in
the dust deposit that was covered by the ashes. The worker had been warned against
applying the water jet directly to the smouldering fire, but for some reason he nevertheless
did this. The result was an intense dust flame that afflicted him with serious third degree
burns. The smouldering fire was subsequently extinguished by covering its surface with
mineral wool mats, and subsequently soaking the whole system with water containing
surface-active agent.
2.1
1
DUST EXPLOSION IN
A
SILICON POWDER GRINDING
PLANT
AT
BREMANGER, NORWAY,
IN
1972
In this serious explosion accident, five workers lost their lives and four were severely
injured. The explosion that occurred in the milling section
of
the plant, was extensive,
rupturing
or
buckling most
of
the process equipment and blowing out practically all the
wall panels
of
the factory building. Figure 2.26 gives a flow chart
of
the plant. Figure 2.27
shows the total damage
of
the entire grinding plant building, whereas Figure 2.28 gives a
detailed view
of
the extensive damage.
Eye-witnesses reported that the flame was very bright, almost white. This is in
accordance with the fact that the temperature
of
silicon dust flames, as of flames
of
aluminium and magnesium dust, is very high due to the large amounts
of
heat released in
the combustion process per mole of oxygen consumed. (See Table 1.1 in Chapter 1.).
Because
of
the high temperature, the thermal radiation from the flame is intense, which
was a main reason for the very severe burns that the nine workers suffered.
The investigation after the accident disclosed a small hole in a steel pipe for conveying
Si-powder from one
of
the mechanical sieves to a silo below.
An
oxygedacetylene cutting
torch with both valves open was found lying on the floor about
1
m from the pipe with the
194
Dust Explosions in the Process Industries
Figure
2.26
Flow chart of dry part of plant for production of refined silicon products at Bremanger,
Norway. The grinding plant that was totally damaged in the explosion in
1972
is shown to the right in
the chart
Figure
2.27
Totally destroyed milling section of
silicon powder production plant at Bremanger, Nor-
way, after the dust explosion in October
1972
Case histories
195
Figure
2.28
Bremanger, Norway, October
1972
Detailed view
of
the extensive material damage caused
by
the silicon dust explosion at
hole. According to Kjerpeseth
(1990)
there was strong evidence
of
the small hole having
been made by means of the cutting torch just at the time when the explosion occurred. At
the moment
of
the explosion, part
of
the plant was closed down due to various repair
work. However, the dust extraction system was operating, and this may in part explain the
rapid spread
of
the explosion throughout the entire plant. The interior
of
the pipe that was
perforated had probably not been cleaned prior to the perforation. In view
of
the high
temperature and excessive thermal power
of
the cutting torch, and not least the fact that it
supplied oxygen to the working zone, a layer of fine dust on the internal pipe wall may well
have become dispersed and ignited as soon as the gas flame had burnt its way through the
pipe wall. The blast from the resulting primary silicon dust explosion then raised dust
deposits in other parts of the plant into suspension and allowed the explosion to propagate
further until it eventually involved the entire silicon grinding building.
The grinding plant was not rebuilt after the explosion.
2.1
2
TWO
DEVASTATING ALUMINIUM DUST EXPLOSIONS
2.12.1
MIXING SECTION
OF
PREMIX
PLANT
OF
SLURRY
EXPLOSIVE
FACTORY AT GULLAUG, NORWAY,
IN
1973
The main source of information concerning the original investigation of the accident
is
Berg
(1989).
The explosion occurred during the working hours, just before lunch, while
ten workers were in the same building. Five of these lost their lives, two were seriously
injured, two suffered minor injuries, whereas only one escaped unhurt.
A
substantial part
of
the plant was totally demolished, as illustrated by Figure
2.29.
196
Dust Explosions in the Process Industries
Figure
2.29 Scene of total demolition after aluminium dust explosion in the premix plant of a slurry
explosive factory at Cullaug, Norway, in August
1973
(Courtesy of
E.
Berg, Dyno Industries, Cullaug,
Norway)
The premix preparation plant building was completely destroyed. Debris was found up
to
75
m from the explosion site. The explosion was followed by a violent fire in the
powders left in the ruins
of
the plant and in an adjacent storehouse for raw materials.
The explosion occurred when charging the 5.2 m3 batch mixer, illustrated in Figure
2.30. It appeared that about 200 kg
of
very fine aluminium flake, sulphur and some other
ingredients had been charged at the moment
of
the explosion. The total charge
of
the
formulation in question was 1200 kg.
The upper part
of
the closed vertical mixing vessel was cylindrical, and the lower part
had the form
of
an inverted cone. The feed chute was at the bottom of the vessel. The
mixing device in the vessel consisted
of
a vertical rubber-lined screw surrounded by a
rubber-lined earthed steel tube. The powders to be mixed were transported upwards by
the screw, and when emerging from the top outlet of the tube, they dropped to the surface
of
the powder heap in the lower part
of
the vessel, where they became mixed with other
powder elements and eventually re-transported to the top.
The construction materials of the mixer had been selected
so
as to eliminate the
formation of mechanical sparks. This was probably why both the screw and the internal
wall
of
the surrounding earthed steel tube were lined with rubber.
During operation the
5.2
m3 vessel was flushed with nitrogen, the concentration of
oxygen in the vessel being controlled by a direct reading oxygen analyser. According to
the foreman’s statement, the oxygen content at the moment of explosion was within the
specified limit.
After the explosion, the central screw part of the mixer, with the mixer top, was
retrieved, as shown in Figure 2.31, about 12
m
away from the location that the mixer had
prior
to
the explosion. More detailed investigation
of
the part of the screw that was
shielded by the steel tube, revealed, as shown in Figure 2.32, that the screw wings had
been deformed bi-directionally as if an explosion in the central part had expanded
violently in both directions. This evidence was considered as a strong indication
of
the
explosion having been initiated inside the steel tube surrounding the screw. The blast and
Case histories 797
Figure
2.30
Cross section of mixer for producing
dry
premix for slurry explosives at Cullaug, Norway,
in 7973 (Courtesy of
E.
Berg, Dyno Industries, Cullaug, Norway)
Figure
2.31
Top of 5.2
m3
premix mixer, and 3.3
m
long mixing screw with surrounding steel tube
(see
Figure 2.30), as found after the explosion
12
m
away from location of the mixer prior to the
explosion (Courtesy of
E.
Berg, Dyno Industries,
Cullaug,
Norway)
198
Dust Explosions in the Process Industries
Figure
2.32
Section of screw after splitting and removal of surrounding steel tube, showing
bi-directional deformation of the screw wings from the explosion centre. Part of rubber lining of steel
tube removed from upper half of tube (Courtesy of
E.
Berg, Dyno Industries, Gullaug, Norway)
flame from this primary explosion in turn generated and ignited a larger dust cloud in the
main space inside the mixer, and finally the main bulk
of
the powder in the mixer was
thrown into suspension and ignited when the mixer ruptured, giving rise to a major
explosion in the workrooms.
Subsequent investigations at Chr. Michelsen Institute, Bergen, Norway, revealed that
clouds in air of the fine aluminium flake powder was both extremely sensitive to ignition
and exploded extremely violently. The minimum electric spark ignition energy was
of
the
order of
1
mJ, and the maximum rate
of
pressure rise in the Hartmann bomb
2600
bark.
Both these values are extreme. The thickness
of
the aluminium flakes was about 0.1 pm,
which corresponds to a specific surface area of about 7.5 m2/g. (See Section 1.1.1.3 in
Chapter 1.)
The investigation further disclosed that the design
of
the nitrogen inerting system of the
mixer was inadequate. First the nitrogen flow was insufficient to enable reduction
of
the
average oxygen concentration to the specified maximum level of 10 vol% within the time
allocated.
Secondly, even if the flow had been adequate, both the nitrogen inlet and the oxygen
concentration probe were located in the upper part
of
the vessel, which rendered the
measured oxygen concentration unreliable as an indicator
of
the general oxygen level in
the mixer. It is highly probable that the oxygen concentration in the lower part of the
mixer, and in particular in the space inside the tube surrounding the screw, was
considerably higher than the measured value. This explains why a dust explosion could
occur in spite of the use of a nitrogen inerting system.
The final central concern of the investigators was identification of the probable ignition
source. In the reports from 1973 it was concluded that the primary explosion in the tube
surrounding the screw was probably initiated by an electrostatic discharge. However, this
conclusion was not qualified in any detail. In more recent years the knowledge about
various kinds
of
electrostatic discharges has increased considerably (see Section 1.1.4.6).
It now seems highly probable that the ignition source in the 1973 Gullaug explosion was a
Case histories 199
propagating brush discharge, brought about by the high charge density that could be
accumulated on the internal rubber lining
of
the steel tube surrounding the screw, because
of
the earthed electrically conducting backing provided by the steel tube itself. The
discharge could then have occurred through a hole in the lining (see Figure 1.14).
2.1
2.2
ATOMIZED ALUMINIUM POWDER PRODUCTION PLANT
AT
ANGLESEY, UK, IN
1983
This accident has been discussed in detail by Lunn (1984), and the following brief
summary is based on Lunn’s account.
The explosion occurred on a Saturday evening in July 1983. Only three employees were
working on the site at the time of the explosion. Two
of
these were injured whereas the
third escaped unhurt. The plant was substantially damaged.
Figure 2.33 shows the basic layout
of
the plant.
Figure
2.33
Layout ofplant for atomized aluminium powder production, in Anglesey,
UK,
which was
damaged by an extensive dust explosion in luly 1983. Ignition probably occurred in the
No.
1
stream
collector system*
(from
C.
Lunn, 1984)
Molten aluminium from the furnaces was broken up into small droplets by a jet of air.
The aluminium powder
so
formed was carried by a current
of
air along sections
of
horizontal ducting at ground level before entering a riser which delivered it to a two-stage
collecting system. There were two parallel collector streams, as shown in Figure 2.33.
After the powder had been separated out in the collectors, the air passed through a fan
and out to the atmosphere via a vertical stack. The powder dropped through rotary valves
into a ‘Euro-bin’, one for each stream. When full, the bins were transported along a
covered walk-way from beneath the collector to the screen-room where the aluminium
powder was separated into particle-size fractions. The fractions were bagged in the
bagging-room, and the bagged powder was taken through a short corridor to the store
room.
The explosion swept through almost the entire plant. Examples of the extensive damage
are given in Figures 2.34 and 2.35. Figure 2.34 shows the
No.
2 stream collector plant and
Figure 2.35 the screen room.
200
Dust Explosions in the Process Industries
Figure
2.34
Damaged
No.
2 stream collectors after a dust explosion in an aluminium powder
production plant at Anglesey,
UK,
in 1983 (Courtesy of
G.
Lunn, Health and Safety Executive,
UK)
Figure
2.35
at Anglesey, UK, in 7983 (Courtesy of
G.
Lunn, Health and Safety Executive,
UK)
Damaged screen room after
a
dust explosion in an aluminium powder production plant
Case
histories 201
According to Lunn (1984), neither the ignition source nor the location of the point of
ignition was identified conclusively, but the fact that only
No.
1
stream was in operation at
the moment
of
the explosion would indicate that the explosion started there. The damage
picture suggested that ignition could have occurred either before or within the first stage of
the
No.
1
stream collectors. Air blasts from the initial explosions then stirred up dust
deposits in the walk-ways and screen room, allowing the flame to propagate into these
areas.
The combination of a turbulent aluminium dust cloud ejected at a relatively high
pressure from the
No.
1
stream collectors, and a large, energetic and turbulent ignition
source provided by the flames ejecting from the open vents generated ideal conditions for
a dust explosion in the space between the
No.
1
and
No.
2 stream collectors capable of
generating a significant blast overpressure. In fact, the damage to the
No.
2 stream
collectors (Figure 2.34) suggested that an overpressure had been exerted downwards,
collapsing the structure. However, the evidence also suggested that a relatively violent
explosion inside the
No.
2 stream collectors had taken place. Air movement from an
external explosion, and collapse of the structure could be sufficient to disperse dust inside
the collectors. Ingress of flame from the external explosion into the collectors through
tears in the bodywork caused by the collapse would provide multiple ignition sources.
An external explosion occurring some distance from the ground between the two
collectors would also explain the damage to
the
cladding on the furnace room and the
covered walk-way beneath the
No.
2 stream collectors. The cladding on the furnace room
had not been blown out by an internal explosion, but must have been pulled away from its
fastenings by suction. This could have been caused by air movement generated by an
explosion in the open air between the collectors. Similarly, cladding on the walk-way has
been pulled away rather than blown out.
REFERENCES
Alameddin, A. N., and Foster, R. K. (1984) Evaluation
of
a Coal Bin Explosion Accident in
Cushenbury Cement Plant. Report D4839-S497, (August) Industrial and Electrical Safety
Division, Safety and Health Technology Center, Denver, Colorado, USA
Andersson, B. (1988) Kolpulversilo hotade explodera. SPhar lostes problemet. Sirenen,
Raddningsverkets Tidning
Nr. 3, October p. 4
Astad, A. (1970) Private communication to R. K. Eckhoff from director A. Astad. Stavanger Port
Silo, Norway
Berg, E. (1989) Private communication to R. K. Eckhoff from
E.
Berg, Dyno Industries, Gullaug,
Norway
Borisov, A., and Gelfand, B. (1989) Private communication to R.
K.
Eckhoff from A. Borisov and
B. Gelfand, USSR Academy
of
Science, Moscow
Braaten,
T.
S.
(1985) Investigation
of
Silo Plant at Kvalaberget, Stavanger, Norway, after
Explosion on 22nd November 1985. Norwegian Factory Inspectorate, Internal Report, 27
(November)
Eckhoff, R. K. (1980) Powder Technology and Dust Explosions in Relation to Fish Meals. Paper
given at Internat. Symp. Processing
of
Fish Meal and
Oil,
Athens, October
6,
1980. Report
No.
803301-2 (June) Chr. Michelsen Institute, Bergen, Norway
Fire and Police Authorities
of
Bremen (1979) Brand- und Explosionsschaden Bremer Rolandmiihle
am
6.
Februar 1979. Eine Dokumentation. Issued by the Fire and Police Authorities
of
Bremen
202
Dust
Explosions
in
the
Process
Industries
Johansen, A. Fr. (1976)
Si
malt det pH Vippetangen.
Kornmagasinet
No.
3
p.
11
Johansen, A. Fr., Johansen, A. H., Mo, A. (1987) Rapport over st0veksplosjonen ved
Oslo
Havnesilo
-
Vippetangen, 29. Juni (1987) Internal Report 20th August, Norwegian Grain
Corporation
Kauffman, C. W. (1982) Agricultural Dust Explosions in Grain Handling Facilities. In
Fuel-Air
Explosions,
ed. by J. H.
S.
Lee and C. M. Guirao, University
of
Waterloo Press, Canada
pp. 305-347
Kauffman, C.
W.,
and Hubbard, R. F. (1984)
An Investigation
of
Fourteen Grain Elevator
Explosions Occurring Between January 1979 and April 1981.
Occupational Safety and Health
Administration
(OSHA)
(May) Washington DC
Kauffman, C. W. (1989) Recent Dust Explosion Experiences in the US Grain Industry.
In
Industrial
Dust Explosions,
ASTM Special Techn. Publ. 958, (ed. K. L. Cashdollar and M. Hertzberg),
pp. 243-264, ASTM, Philadelphia, USA
Kjerpeseth, E. (1990) Private communication to R. K. Eckhoff from E. Kjerpeseth, Elkem-
Bremanger, Svelgen, Norway
Lunn,
G.
A. (1984) Aluminium Powder Explosion at ALPOCO, Anglesey, UK. Report No. SMR
346/235/0171, (September), Health and Safety Executive, Explosion and Flame Laboratory
Mo, A. (1970) Private communication to R. K. Eckhoff from A. Mo, Norwegian Grain Corporation
Norway
Morozzo, Count (1795) Account of a Violent Explosion which Happened in a Flour-Warehouse, at
Turin, December the
14th,
1785, to which are Added some Observations on Spontaneous
Inflammations.
The Repertory
of
Arts and Manufactures
2
pp. 416432
Olsen,
0.
(1989) Private communication to R. K. Eckhoff from
0.
Olsen, Stavanger Port Silo,
Norway
Patzke, J. (1981) Sicherheitstechnische Betriebserfahrungen bei der Kohlen-mahlung in Zement-
werk Lagerdorf.
Zement-Kalk-Gips
34
pp. 238-242
Pfaffle, H. (1987)
Braunkohlenstaubverpuffung
-
Ursache, Verlauf und Folgerungen im Kraftwerk
Lausward.
VGB Kraftwerkstechnik
67
pp. 1163-1 167
Stokes, D. A. (1986) Fording Coal Limited Silo Explosion.
CIM Bulletin
79
No. 891, pp.
56-60
Storli, K.: (1976) Private communication to R. K. Eckhoff from K. Storli, Norwegian Factory
Templin, G. (1990) Private communication to
R.
K. Eckhoff from G. Templin, Nord Mills, Malmo,
Wibbelhoff, H. (1981) Explosion in
Braunkohlenstaub-Feuerungsanlage.
Steine und Erden
No.
3
Xu Bowen, (1988) The Explosion Accident in the Harbin Linen Textile Plant.
EuropEx Newsletter,
Edition
6,
January pp. 2-3
Xu Bowen
et al.,
(1988) The Model
of
Explosion Accident Determined by the Seismic Record.
Unpublished English manuscript concerning the Harbin Linen Textile Plant explosion, given by
Xu Bowen to
R.
K. Eckhoff, (November)
Zhu Hailin, (1988) Investigation
of
the Dust Explosion in Harbin Linen Factory. Unpublished
English manuscript given to
R.
K.
Eckhoff by Zhu Hailin (November)
Inspectorate
Sweden
pp. 112-113
Chapter
3
Generation
of
explosible dust clouds
by
re-entrainment and re-dispersion
of
deposited
dust in air
3.1
BACKGROUND
The dust concentration range, within which flames can propagate through a cloud of
combustible dust in air, spans from the order of
50
g/m3 to a few kg/m3. The bulk density
of
powders and dusts, when settled in a layer or a heap, range from a few hundred kg/m3
and upwards. Therefore, there is a gap
of
a factor of at least
100
between the maximum
explosible dust concentration and the bulk density in the settled state. Consequently, in
order for an explosible dust cloud to be formed, the dust must be suspended in the air to
the extent that the concentration
of
dust per unit volume of cloud drops into the explosible
range.
In dust explosion research, the important role played by this resuspension process has
often been overlooked, or underestimated. It is realized that particle size plays a key role
both with respect to the ignition sensitivity and the explosibility of dust clouds. However,
it has not always been realized that fine, cohesive powders cannot be dispersed in a gas as
individual primary particles unless particle agglomerates are exposed to very high shear or
tensile stresses. This means that the effective particle size in a dust cloud can be much
larger than the size
of
the primary particles.
It is interesting to note that Professor Weber, one of the pioneers of dust explosion
research, stressed the importance of dust cohesion and dispersibility more than
100
years
ago. In his excellent paper on the ignitibility and explosibility of flour Weber
(1878)
emphasizes that ‘cohesion of the flour, which is caused by inter-particle adhesion, plays an
important role with respect to the ability of the flour to disperse into explosible dust
clouds.’ Weber suggested that two large dust explosion disasters, one in Szczecin (Stettin)
and one in Miinchen, were mainly due to the high dispersibility of the flours. He also
demonstrated, using simple but convincing laboratory experiments, that the dispersibility
or dustability of a given flour increased with decreasing moisture content in the flour.
In some special situations such
as
in air jet mills, explosible dust clouds may be
generated
in
situ,
i.e. the dust particles become suspended in the air as they are produced.
However, in most cases explosible dust clouds are generated by re-entrainment and
re-dispersion
of
powders and dusts that have been produced at an earlier stage and
allowed to accumulate as layers or heaps. Such accumulation may either be intentional, as
collection
of
powders and dusts in silos, hoppers and bag filters, or unintentional as
deposition
of
dust on beams, external surfaces of process equipment or walls and floors of
work and storage rooms.
204
Dust Explosions in the
Process
Industries
Re-suspension and re-dispersion of dust may either occur intentionally, e.g. by handling
and transport in various process equipment (powder mixers, bucket elevators, pneumatic
transport etc.),
or
unintentionally by bursting of sacks and bags that contain powder, leaks
of
dust from process equipment,
or
by sudden blasts
of
air generated by an explosion that
has started elsewhere in the plant.
The characterization of the ‘state’ of a dust cloud is far more complicated than
characterizing the ‘state’ of a premixed quiescent gas mixture.
For
a quiescent gas the
thermodynamic state is completely defined by the chemical composition, the pressure and
the temperature.
For
a dust cloud, however, the state
of
equilibrium will be complete
separation, with all the particles settled out at the bottom of the system.
In the context
of
dust explosions, the relevant ‘state’ will therefore always be dynamic.
In various industrial environments as well as in experiments with dust clouds, gravity and
other inertia forces act on the dust particles, giving rise
to
a complex dynamic picture. In
the ideal static dust cloud, all the particles would be located in fixed positions, either
ordered or at random. The closest approximation to the ideal dust cloud that can be
encountered in practice is probably a cloud in which the particles are settling in quiescent
gas under the influence of gravity alone.
3.2
STRUCTURE
OF
PROBLEM
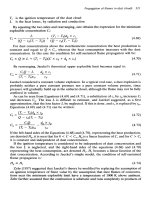
Formation of explosible dust clouds from powder deposits implies that particles originally
in contact in the powder deposit must be separated and distributed in the air to give
concentrations within the explosible range. There are two aspects to consider. The first is
the spectrum of forces originally acting on and between the particles in the deposit,
resisting the separation
of
the particles. The second aspect is the forces and energy
required for the separation process under various conditions.
Eckhoff
(1976)
suggested that a global dispersibility parameter for a powder deposit
may be defined by considering these two aspects.
A
given mass
of
powder at equilibrium
with the ambient atmosphere, contains a finite number of inter-particle bonds, each
of
which requires a specific amount of work to be broken. The total minimum work
Wmin
needed to break all these bonds in one unit mass of powder, could in principle be
calculated by integrating the work required for breaking all the individual inter-particle
bonds. The influence
of
gravity would depend on whether the particles would have to be
raised into suspension
or
whether dispersion would be downwards. One could then define
a theoretical upper limit value
of
the dispersibility for that specific powder deposit by:
When defined in this way, the ‘dispersibility’ has the dimension mass per unit
of
energy
or
work, and is thus a measure
of
the quantity of powder that can be completely dispersed
by spending one unit of energy from external sources in the process. However, no realistic
dispersion process can be one-hundred per cent efficient. This can be accounted for by
incorporating an efficiency factor,
K:
Generation
of
explosible dust
clouds
205
The particle size distribution
of
the powder has a great influence on Wmin at a given
powder bulk density. It also is well known that powders consisting
of
small particles are
compressible. The reason is that the various inter-particle forces other than gravity are
stronger than the gravity forces and therefore permit the formation
of
loosely packed
particle arrangements that would have collapsed had gravity been the only force in
operation. This means that the number
of
inter-particle bonds per unit mass
of
cohesive
powder can be increased by compacting the powder, i.e. by increasing the bulk density of
the powder deposit. Therefore Wmin also increases with the degree
of
compaction.
Moisture influences Wmin by influencing the strength
of
certain types of inter-particle
bonds.
The logical link between Wmin and nature and number-density
of
the inter-particle
bonds in a powder has given rise to detailed studies of various types
of
inter-particle
bonds. Attempts have further been made at predicting aggregated powder-mechanical
strength properties from microscopic inter-particle structure and forces. This kind
of
work
is concerned with the quantity
D,,,
(Equation
(3.1
.)
However, the efficiency factor
0
<
K
<
1
in Equation
(3.2)
allows
Dreal
to have any
value between zero and
D,,,,
depending on the way in which the work Wmin is applied to
the powder to be dispersed. This in turn depends on the geometrical arrangement
of
the
powder and the form
of
the mechanical energy available for the dispersion process. If a
comparatively coarse non-cohesive powder is for example charged into a silo from a
hopper at the silo top, the potential energy
of
the powder, when being transformed to
kinetic energy in the gravity field, may be sufficient to generate well dispersed explosible
dust cloud in the silo. The same applies if deposits of this powder are falling down from
shelves and beams in a factory workroom.
However, very energetic air flows may be required to raise deposits
of
such a powder on
the factory
floor
into explosible suspensions.
When considering the other end
of
the scale, cohesive powders composed
of
very small
particles, inter-particle forces play a major role and inter-particle bonds may not be
broken unless the particle agglomerates are exposed to large shear forces. This means that
complete dispersion into primary particles is only possible in high velocity flow fields, or if
the particles are exposed to high-velocity impacts.
Consequently; the understanding
of
how explosible dust clouds can be generated,
requires knowledge both
of
the nature
of
the powder
(
Wmin) and
of
the actual dispersion
process
(K).
The dispersion process in turn depends very much on the actual industrial
situation, which will be different in bucket elevators, pneumatic transport systems,
fluidized beds, various kinds of mills, driers, mixers, cyclones, filters and silos. Therefore,
intimate knowledge
of
the nature
of
the industrial environment is required.
It has not been possible to trace any comprehensive theory
of
the generation
of
dust
clouds, leading from the properties of the powder deposit, via the nature of the energy
available for dispersion,
to
the structure of the dust cloud. However, in view
of
the wide
variation in possible boundary conditions in industrial practice, one would not expect to
find one single, unified theory covering all possible situations. On the contrary, each
specific situation needs
to
be analysed separately. Much work has been conducted on
various limited elements inherent in the total problem complex. Some of this will be
206
Dust
Explosions in the Process Industries
reviewed in the following in sufficient detail for the genuine nature of the various
problems to become visible. This is considered important in a new text on dust explosions
because in the past, dust explosion research has often been conducted without paying
appropriate attention to the central role played by powder mechanics/particle technology.
3.3
ATTRACTION FORCES BETWEEN PARTICLES
IN
POWDER
OR
DUST DEPOSITS
Two categories of inter-particle forces exist, one that operates even in dry powders, and
one that is due to the presence
of
a viscous liquid. Useful summaries have been given by
Green and Lane (1964), Corn (1966), Rumpf (1974), Schubert (1979) and Enstad (1980).
3.3.1
VAN
DER
WAALS’
FORCES
The van der Waals’ force
F,
between two spherical particles has been estimated
theoretically by integrating London-van der Waals’ forces over all interacting pairs of
molecules. The resulting expression is:
(3.3)
where
A
is a constant,
a
the smallest distance between the sphere surfaces and
x1
and x2
the diameters
of
the two spheres.
Vander Waals’forces between particles are
of
significance as long as
x
<
100
nm. If
x1
9
x2, the force is only determined by the size of the smallest particle, and equation
(3.3) reduces to
Most particles in real life are not smooth spheres, but of irregular shape and surface
topography. Schubert (1979) showed that
F,
between a plane surface and a point on an
irregular particle of diameter
X,
having a small elevation
of
radius
r
that touches the plane
surface, is:
X
F,=Ax
(3.5)
The distance,
ao,
is the smallest distance that can exist between two bodies in touch, and
it
is estimated at
0.4
nm.
Generation of explosible dust clouds
207
3.3.2
E
L
ECTROSTATI C FORCES
When considering electrostatic forces, one distinguishes between electrically conducting
and non-conducting particles.
In
the case
of
conducting particles, electrostatic inter-
particulate attraction between touching particles may occur even if the particles did not
initially carry any net excess charge, provided their electron work functions are different.
Electrons will then be transferred from one particle to the other. Different electron work
functions can occur in particle systems of apparently identical materials, due to differences
in impurities, oxide layers etc. Provided the smallest distance
a
between the two surfaces is
shorter than
100
nm, i.e. the particles are in electric contact, the electrostatic contact
attraction force between the two conducting particles is:
Here
eo
is the permittivity
of
vacuum and
E]
the dielectric constant
of
the gas
surrounding the particles.
U
is the contact potential between the two particle surfaces.
For
electrically non-conducting particles, such as plastics, the electrostatic contact force
is negligible.
In
this case, electrostatic attraction between particles is caused by excess
charges
on
the particle surfaces, acquired tribo-electrically during preceding production
and handling. The attraction force between two non-conducting particles having total
excess opposite charges on the surfaces of
q1
and
q2,
equals:
For
a
+
(xl
+
x2),
equation (3.7) reduces to Coulomb’s equation for attraction between
two opposite point charges. If
a
is much smaller than the diameter
of
the largest particle,
Fe,n
will essentially be independent of
a.
Equations (3.3)-(3.7) are all concerned with the attraction between two single particles
under idealized conditions. It is clear, therefore, that these equations are
of
limited value
for predicting inter-particle attraction forces in real powders and dusts where many
particles are interacting and particle shape and surface properties may be complex. In the
case of electrostatic forces, realistic assessment
of
the particle charges
ql
and
q2
is also
difficult, even for idealized particle geometries.
In industrial practice the relative humidity
of
the air will have different values, and this
will influence the strength of the electrostatic attraction forces between particles in
powders. This influence was investigated by Nguyen and Nieh
(1989).
They proposed a
general mechanism of charge elimination in flowing powders in humid air by ‘hydrated ion
clusters’ (H20),H+ and (H20),0H- and their polymers.
Ross
(1988),
working with clouds of lycopodium in air, was able to significantly reduce
electrostatic agglomeration
of
particles, as well as electrostatic adhesion to the wall
of
an
experimental flame tube, when the air was ionized by means of an alpha emitter mounted
on the flame tube wall.
208
Dust Explosions in the Process Industries
3.3.3
INTER-PARTICLE FORCES
DUE
TO LIQUIDS
It is a common experience from practice in industry that dry dusts are usually easier to
disperse than moist dusts (one exception can be heavily electrostatically charged dry
plastic powders). Even small quantities
of
adsorbed moisture can in some cases increase
the attraction forces between particles considerably. Adsorbed layers
of
up to
3
nm
thickness can adhere firmly to the particle surface and make it more smooth. This can
reduce the effective distance between two touching particles appreciably. Even for a
spherical particle as small as
1
pm
diameter the volume
of
a
3
nm layer
of
liquid water
constitutes only
2%
of
the particle volume. (The situation
is
different if the moisture is
also absorbed by the interior of the particle, rather than being just adsorbed on its
surface
.)
The next stage is reached when the moisture content in the powder has become
so
high
that excess water starts to form liquid bridges between particles, as illustrated in Figure
3.l(a). If the moisture content increases further, a transition range is reached which is
characterized by some
of
the space between particles being completely filled with water
(Figure 3.1(b)). Figure 3.1(c) illustrates the capillary range where the capillary under-
pressure is the main source of the cohesion. If the water content is increased beyond this
point, the system is transformed from a cohesive powder to a suspension of particles in a
liquid (Figure 3.1(d)).
Figure
3.1
Distribution
of
a
liquid in
a
powder (From Schubert, 1973)
In order to assess the strength of liquid bridges between particles in a powder (Figure
3.1
(a)), Schubert (1973) used the approximate relationship derived by Rumpf (1970) for the
tensile strength
uT
of a bed
of
monosized spheres (see 3.4.1):
Generation
of
explosible dust clouds
209
1
-
E
F(E)
E
X2
‘+T=-X-
(3.8)
Here
E
is the porosity of the bed,
F(E)
the mean inter-particle force (dependent on
E)
and
x
the particle diameter. Equation (3.8) is derived from Equation (3.10) via the
relationship
E
x
k(~)
=
3.1
=
7~
found experimentally for spherical particles.
Schubert’s equation for the tensile strength of a powder due to inter-particle liquid
bridges is as follows:
X
FF
E,
S,
6,-
(3.9)
(
:i
y
1-E
uT=-x-
X
E
Here
y
is the surface tension of the liquid.
FF(e,
S,
6,
alx)
is the dimensionless
liquid-bridge inter-particle attraction force, where
S
is the fraction of the total pore
volume between the particles that is filled with liquid, and
a
and
6
as shown in Figure 3.2.
Equation (3.9) cannot be solved analytically, but Schubert (1973) arrived at a graphical
solution.
Figure 3.2
Liquid bridge between two identical spherical particles (From Schubert,
1973)
The liquid bridge regime extends up to about
S
=
0.25
(Schubert’s experiments with
70
km limestone particles). This regime is the most relevant one with a view to
transformation
of
dust deposits into explosible dust clouds. For a powder
of
specific
density of
1
g/cm3 packed to a porosity
E
of
0.4,
S
=
0.25 represents a moisture content of
14%
(neglecting moisture absorbed by the interior of the particles). The transition regime
in which the liquid partly forms bridges between particles and partly fills the voids
completely, spans from
S
=
0.25 to
S
=
0.8. When the voids between the particles are just
filled up with liquid, the tensile strength of the bulk powder is determined solely by the
internal underpressure caused by capillary forces. In practice this will be the case for
0.8
<
S
<
1.0.
Figure
3.3.
summarizes some
of
Schubert’s (1973) experimental and theoretical results.
He found that equation (3.9), using
alx
=
0.05,
gave excellent agreement with the
experiments in the liquid bridge regime, for which there is a strong increase of
uT
as
S
increases from zero to
0.1.
2
1
0
Dust Explosions in the Process Industries
Figure
3.3
Tensile strength
uT
of a powder bed
as
a function of the fractions of the voids between the
particles that are filled with liquid. Experiments with limestone of
70
pm particle diameter.
E
=
0.415.
-,
-
-
-
and
are theoretical calculations using different assumptions (From
Schubert,
1973)
For
particles
of
density
1
g/cm3 packed to a porosity
of
0.4,
S
=
0.1
corresponds to a
moisture content
of
6.25%.
It is therefore to be expected that the influence
of
the moisture
content
on
the dispersibility of the powder would be particularly strong in the range of a
few per cent moisture. However, this does not apply if a significant fraction of the
moisture
is
absorbed by the interior of the particles rather than adhering to the particle
surfaces.
As
S
increases and moves into the capillary pressure region, the tensile strength of the
powder bed increases further.
As
Figure 3.3 shows, the tensile strength of the powder bed
in the region just before complete saturation is three times the maximum tensile strength
in the liquid bridge region.
However, as pointed out by Enstad
(1980),
the tensile strength
of
the powder bed in the
capillary under-pressure regime can never exceed a pressure difference
of
one atmos-
phere. In the liquid bridge regime there is
no
such limitation, and for small particle
diameters
<
70
km equation (3.9) can easily give tensile strengths corresponding to
pressure differences of several atmospheres.
In
this range of particle sizes the shape of the
curve
of
uT
(S)
will differ from that
in
Figure 3.3, by having its maximum in the liquid
bridge range of
S
<
0.25.
Adding liquids to dusts is sometimes used intentionally in industry for reducting dust
dispersibility. One application of this method is addition
of
soya bean oil to grain for
preventing generation
of
grain dust clouds in grain storage plants. See Section
1.4.10
in
Chapter
1.
Generation
of
explosible dust
clouds
2
1
1
3.4
RE
LATl
ON
S
H
I
P
B
EWE
E
N
I
NTE R-PARTI C
LE
ATTRACT1
0
N
FORCES AND STRENGTH
OF
BULK
POWDER
3.4.1
THEORIES
The question arises whether it would be possible to deduce some measure
of
the
inter-particle forces in powder deposits from measurement
of
bulk powder properties such
as shear strength and tensile strength.
As
already mentioned, Rumpf (1970) developed the
following equation for the relationship between the bulk strength
u
of
a powder bed of
monosized particles and the mean inter-particle force
F(E),
the coordination number
k(~)
(average number
of
neighbouring particles with which a given particle is in contact),
particle diameter
x
and porosity of the powder bed
E:
(3.10)
Equation (3.10) shows that for geometrically similar powder beds, differing only in
particle size
x,
and assuming that the mean attraction force per inter-particle contact is
independent of particle size, the strength
of
the bulk powder is inversally proportional to
x2,
Le. the powder strength increases strongly as the particle size decreases.
Rumpf (1970) was able to show that equation (3.10) is valid not only for spherical
particles, but also for irregular ones provided certain statistical conditions concerning the
arrangement of the particles in the bed and the particle shape are fulfilled. By extending
his trzatment to beds containing a variety
of
particle sizes, he arrived at the equation:
(3.11)
Here
fo
is a particle shape factor and
M30
the ‘third moment’ of the particle size
distribution (distribution
of
particle volume).
For
integration of equation (3.11) the coordination number
k(x)
as a function of particle
size, and the inter-particle force
F(x,
n(x))
as a function
of
particle size and particle size
distribution must be known. The practical usefulness
of
equation (3.11) is therefore
limited, but it establishes a formal logical link between the bulk strength
of
a powder, and
the mean microscopic inter-particle attraction force.
Molerus (1978) also studied the link between inter-particle forces and bulk powder
strength. He made use
of
the following empirical relationship between the adhesive force
F
between a limestone particle and a plane metal surface, and the external force
N
used
initially for pressing the particle against the surface:
F=FO+KN
(3.12)
Fo
is the attraction force for particles that are just touching the plate without having been
pressed against
it
by an external force. On the basis of theoretical considerations of
the inter-particle forces in a cohesive bulk powder. Molerus developed a relationship
of
the same form as equation (3.12), where
FO
and
K
where expressed in terms
of
the
Hamaker constant, the plastic yield pressure
of
the particle material, a characteristic
2
12
Dust Explosions in the
Process
Industries
distance of adhesion (about 0.9 nm) and the size of the spot where the particles are
touching. Encouraging agreement with experiment was obtained for limestone. Molerus
then developed a theoretical model for the connection between such inter-particle forces
and the cohesive properties of the bulk material by assuming that
1. Van der Waals’ forces and deformation of the contact areas where the particles are
2. The particles are monosized spheres.
3.
the coordination number
k(~)
is a unique function
of
the porosity
of
the particle bed.
4. Equation (3.10) is generally applicable for relating the macroscopic tensile and shear
strength of the bulk powder to the corresponding microscopic inter-particle forces.
5.
Breakdown of inter-particle adhesion occurs at a critical ratio between shear force and
compressive force defining the internal angle
of
friction of the powder bed.
The theory predicts yield loci (see 3.4.2.1) for a bulk powder, with the corresponding
cohesion and tensile strength values, as a function
of
the degree
of
compaction
(or
porosity
E).
Encouraging agreement between experiments and theoretical prediction was
found for a cohesive baryte powder.
touching each other, are responsible for the inter-particle adhesion.
3.4.2
MEASUREMENT
OF
THE MECHANICAL STRENGTH
OF
COHESIVE
BULK
POWDERS
AND DUSTS
3.4.2.1
Basic
concepts
If a sample
of
dry sand
is
subjected to a compressive force, the volume reduction, or
reduction in the porosity
E,
will be very small. Furthermore, as soon as the compressive
force is released, the sand will flow freely again. Such behaviour is characteristic of
non-cohesive powders, in which inter-particle forces
of
the nature discussed in Section 3.3
play little or no role compared with gravity. If, however, a sample of finer dust or powder,
such as an organic pigment, is subjected to compression, the powder sample will shrink
and the porosity
E
be reduced. Removal
of
the compressive force will not cause the
powder sample to return to its original state
of
loose packing, but it will maintain a lower
porosity and stick together as a lump. The larger the compressive force, the lower the
resulting
E,
and the stronger the powder sample will become.
The science
of
powder mechanics, which deals with these relationships in a systematic
way, was established by the pioneering work of Jenike (1964). Jenike used Sokolovski’s
(1960) theory
of
the statics
of
soils as his starting point. Schwedes (1976) has given a
concise summary
of
the basic concepts in Jenike’s theory. The powder mechanical state
of
one specific cohesive powder sample of a given porosity
E
is characterized by the so-called
yield locus, as illustrated in Figure 3.4. The yield locus is an envelope curve for all the
Mohr circles describing stress combinations causing yield, referred to a specific powder
sample for which
u1
was the maximum principal consolidation stress during preparation of
the sample. The porosity (and bulk density) of the specific powder in question is a unique
function
of
ul.
S
is the tensile force,
N
the normal force and
A
the area of the powder
Generation
of
explosible dust clouds
2
13
specimen in the shearing plane. The quantity
f,
is the maximum principal stress at failure
when the powder sample is in a situation where the minor principal stress is zero.
uT
is the
tensile strength
of
the powder sample and
c
is the cohesion, defined as the shear strength
of
the powder sample at zero normal load.
For a given type of cohesive powder, there exists a continuous range
of
yield loci, each
locus being characterized by a given porosity
e(ul).
Bothf,, the cohesion
c
and the tensile
strength
uT
increase systematically with decreasing
E,
or increasing
ul.
The straight line
T
=
uN
X
tan
+e
is called the effective yield locus. The angle
+c
is a measure of the
internal friction in the powder during steady flow (plastic deformation).
Figure
3.4
Schwedes,
1976)
Yield locus and effective yield locus
of
a given powder
at
a
given porosity
E
(From
For a non-cohesive, free-flowing powder, the yield locus and the effective yield locus
will coincide and pass through the origin, and both
uT
and
c
will be zero.
3.4.2.2
Shear
cells
Yield loci as illustrated in Figure
3.4
are determined by means
of
shear cells.
A
cross
section of the well-known Jenike cell is shown in Figure
3.5.
This cylindrical cell of
95
mm diameter is split, and the upper ring can be pushed
horizontally in relation
to
the lower, fixed part. The test procedure for obtaining a point
on a yield locus (Figure
3.4)
consists
of
two steps. First the powder is consolidated during
plastic flow
to
a given porosity
E
under the action
of
a major principal stress
ul.
In the
second step the sample is shear strained at a constant strain rate, while being compressed
by
a constant normal stress
uN
=
N/A,
where
N
is the normal force and
A
is
the cross
section of the cell
(71
cm2). The shear force
S,
which
is
recorded continuously during the
process, will increase with the strain
to
a maximum value, at which the powder sample
fails, and
S
drops suddenly. This maximum value of
S
defines the
7
=
S/A
value that
together with the corresponding
uN
=
N/A
gives a point on the yield locus. By shearing
identical powder samples (the same
e(ul)),
at different
uN,
the entire yield locus is
determined.