Báo cáo khoa học: "Near infrared analysis as a tool for rapid screening of some major wood characteristics in a eucalyptus breeding program" ppsx
Bạn đang xem bản rút gọn của tài liệu. Xem và tải ngay bản đầy đủ của tài liệu tại đây (264.3 KB, 12 trang )
H. Baillères et al.Near infrared spectroscopy of eucalyptus wood
Original article
Near infrared analysis as a tool for rapid screening of some major
wood characteristics in a eucalyptus breeding program
Henri Baillères
a*
, Fabrice Davrieux
a
and Frédérique Ham-Pichavant
b
a
CIRAD-Forêt, 73 rue J.F. Breton, Maison de la Technologie, BP 5035, 34032 Montpellier Cedex 1, France
b
Institut du Pin, Université de Bordeaux I, 351 Cours de la Libération, 33405 Talence Cedex, France
(Received 20 August 2001; accepted 8 July 2002)
Abstract – The cost and time required to perform traditional chemical and technological tests to assess wood characteristics for breeding pro
-
grammes is still a majorconstraint. Near infrared diffuse reflectance spectroscopy (NIRS) is a highly promising method that could be adapted for
rapid measurements on wood. In the Congo, the best genotypes for clonal plantations are selected from hybridised eucalyptus full-sib families.
From this narrow genetic base, ground wood-meal samples (extractive-free or not) were analysed to determine quantitative relations between
NIR spectral bands and extractive content, lignin composition, surface longitudinal growth strain and shrinkage relative to prediction accuracy.
The results revealed that NIRS can be used effectively to predict characteristics linked closely with the chemical composition of wood. However,
the reference measurements must be accurate and must represent a wide range of values to achieve valid predictions. Methodological and metro-
logical improvements are possible.
eucalyptus / breeding / wood properties / near infrared spectroscopy / lignin / shrinkage / longitudinal growth stress
Résumé – La spectroscopie proche infrarouge, outil de diagnostic rapide de quelques propriétés de base pour le bois d’eucalyptus dans
un programme d’amélioration génétique. L’évaluation des propriétés du bois à des fins de sélection est généralement entravée par la durée et
le coût des essais technologiques. Une des méthodes probablement la plus adaptable aux mesures rapides sur le bois est la spectrométrie en ré
-
flexion diffuse dans le proche infrarouge (SPIR). Au Congo, une sélection des meilleurs génotypes pour la plantation clonale est réalisée au sein
d’une famille d’eucalyptus de plein frère issue d’une hybridation. Sur cette base génétique étroite, à partir d’échantillons de bois broyé, avant ou
après extraction, des relations quantitatives entre les bandes spectrales issues de la SPIR et le taux d’extraits, la quantité et la composition de la li
-
gnine, la déformation longitudinale de croissance et les retraits sont analysés en terme de précision de la prédiction. Les résultats obtenus mon
-
trent que la SPIR peut être utilisée efficacement pour prédire les caractéristiques qui dépendent étroitement de la constitution chimique du bois.
Cependant, la mesure de référence doit être précise et doit représenter la plus large gamme de valeurs pour obtenir des prédictions exploitables.
Des améliorations méthodologiques et métrologiques sont envisageables.
spectroscopie proche infrarouge / propriétés du bois / lignine / contraintes de croissance / amélioration génétique
1. INTRODUCTION
Wood properties are known to vary between species, and
between genotypes within species. This variability is herita
-
ble and can be tapped in breeding programmes to obtain vari
-
eties with improved wood properties, thus enhancing
end-product quality. The ability to assess wood quality is a
critical challenge facing the forest industry. In intensively
managed forests such as clonal eucalyptus plantations where
the raw material is highly heterogeneous [2, 5, 11, 39], it is
important to be able to predict wood properties of whole trees
using nondestructive sampling techniques. One major hurdle
to overcome is the high within-tree variability in wood prop
-
erties resulting from the harvesting fast growing trees at a
young stage, with a high proportion of juvenile and reaction
wood [2, 5, 11, 39]. Moreover, in breeding programs, selec
-
tion is generally focused on a narrow genetic base, so there is
low between-tree variability in selected traits in contrast with
Ann. For. Sci. 59 (2002) 479–490 479
© INRA, EDP Sciences, 2002
DOI: 10.1051/forest:2002032
* Correspondence and reprints
Tel.: +33 4 67 61 44 51; fax: +33 4 67 61 57 25; e-mail:
the high within-species variations that can occur. Predicting
the technological properties of interest is a real challenge in
these conditions. Unfortunately, the cost and time required to
perform traditional chemical and technological tests to assess
wood characteristics for breeding programmes is still a major
constraint. Near infrared diffuse reflectance spectroscopy
(NIRS) is a highly promising method that could be adapted
for rapid measurements on wood.
NIRS analysis is a fast, environment-friendly analytical
method that has gained widespread acceptance in recent
years. It is based on vibrational spectroscopy that monitors
changes in molecular vibrations intimately associated with
changes in molecular structure. Spectra within the NIR re
-
gion consist of overtone and combination bands of funda
-
mental stretching vibrations of functional groups that occur
in the middle infrared region, mainly CH, OH and NH, which
represent the backbone of all biological compounds. NIRS
has a substantial edge over other indicators because the spec
-
tra contain information about all chemical constituents of or
-
ganic material. This advantage eliminates the need to initially
pinpoint the key factor that determines a specific characteris
-
tic. NIRS instruments must be calibrated using standard labo-
ratory reference methods. A calibration model can thus be
developed by calculating the regression equation based on
NIR spectra and the known reference information. The NIRS
system is calibrated on the basis of a set of fully characterized
samples and mathematical models with high prediction accu-
racy. The sample set must be representative of the variability
of the population targeted for the prediction.
There is a broad range of analytical applications of NIRS:
several industries use NIRS, e.g. agriculture, food, petro
-
chemical, polymer and textile industries [9, 20, 35]. This
technology is also being used to an increasing extent in forest
and wood sciences. For wood products, NIRS is mainly used
for rapid prediction of pulp yield and pulping characteristics
[11, 15, 21, 26, 28, 36]. NIRS technology is now being devel
-
oped and calibrated to replace classical wet-chemical meth
-
ods for wood applications. In addition, a few studies have
used NIRS to assess physical and mechanical properties such
as basic density, stiffness and strength [15, 27, 32]. In the for
-
est product literature, to our knowledge there is no reference
to the use of NIRS to assess characteristics such as extractive
content, the monomeric composition of lignin, shrinkage or
the extent of longitudinal growth stress.
This paper evaluates the potential of NIRS for the assess
-
ment of some major chemical, physical and mechanical wood
characteristics within a eucalyptus full-sib hybridised family.
Our objective was to measure prediction accuracy under real
operational conditions, i.e. selection within a full-sib family
involves working with low between-tree variability in wood
characteristics and consequently requires accurate reference
methods.
2. MATERIALS AND METHODS
2.1. Sample origins
An interspecific hybrid progeny of E. urophylla × E. grandis
from the URPPI
(1)
genetic improvement program was examined in
this study. A total of 200 full-sibs were available for measurement.
The trees were planted in 1992 and felled in 1998 at 59 months old.
Logs were cut at 1.3 m, and half and three-quarters of the commer
-
cial height.
2.2. Sampling method
Two sets of measurements were performed:
(a) On each tree, a disk was taken for chemical analysis at half of
the commercial height. A total of 193 disks were sampled.
(b) On a subpopulation of 13 trees, chosen for their high and low
longitudinal growth stress (LGS) values, 93 small prismatic samples
were taken at 1.3 m to adjust for LGS and shrinkage. The samples
(15 × 20 × 30 mm in R, T, L planes) were cut close to where the LGS
measurement was obtained, on the same longitudinal axis at the pe-
riphery of the tree. Chemical analyses and shrinkage measurements
were performed on these extreme stress value samples.
The samples were ground into wood meal (mesh 40) and then
stored in a room under controlled conditions (30% relative humidity
and 25
o
C) in order to obtain a fixed wood moisture content of 6%.
The meal was mixed and then 15 g was removed with a spatula
for disk samples and about 5 g for extreme value samples and placed
in a sample cup. After the samples had been scanned under a near in-
frared spectrometer, the sample cup was emptied and then refilled
using the same procedure to obtain a duplicate sample. This proce
-
dure was used on extracted and nonextracted wood meal for disk
samples and onnonextracted wood meal for extreme value samples.
2.3. Chemical analysis
2.3.1. Rationale
Lignin is an undesirable component in the conversion of wood
into pulp and paper. Lignin removal is a major step in the
papermaking process. Lignin content is an important determinant
with respect to cellulose fiber extraction from wood. Lignin subunit
composition influences cellulose accessibility. Breeders are thus
seeking ways to reduce extractive content and/or lignin content or
modify the monomeric composition to improve pulp manufacturing.
Hardwood lignins are copolymers of syringyl (S) and guaiacyl (G)
units. Softwood lignins are essentially composed of guaiacyl units,
except for compression wood lignins, which are p-hydroxyphenyl
(H) – guaiacyl copolymers. The presence of methoxylated S units
facilitates chemical delignification during pulp manufacturing but
this is not the only structural parameter which affects Kraft cooking
[10].
480 H. Baillères et al.
(1) For the past 30 years, URPPI (Unité de Recherches pour la Productivité des Plantations Industrielles), in collaboration with CIRAD-Forêt, have been
managing an eucalyptus genetic improvement programme in the Congo. The research results on silviculture, vegetative multiplication and varietal creation
using interspecific hybridisation have made it possible to establish 46 000 ha of industrial plantations.
2.3.2. Extractive content
The analyses focused on the overall content of extractive mate
-
rial (EC) obtained by acetone-ethanol-water extraction relative to
that obtained by the modified TAPPI T 204 om-88 procedure.
The extractions were performed in a Soxhlet apparatus using the
acetone-ethanol 2:1 → ethanol → water solvent sequence, which
makes it possible to eliminate soluble phenols and other extractive
compounds not linked to the cell walls. The residues were dried in
an oven at 105 ± 3
o
C to constant weight and then weighed. The ex
-
tractive content was calculate as follows:
EC(%)
W0–W1
WO
100=×
where:
W0 = oven-dried weight of nonextracted wood;
W1 = oven-dried weight of extractive-free wood.
Extractive contents of extreme value samples derived from sap
-
wood were not determined because of their very low extractive ma
-
terial contents.
2.3.3. Lignin content and composition
Klason lignin content was measured according to Tappi T222
om-83 and the modified procedure of Effland [12]. This technique
involves two phases:
(1) Hydrolysis with 72% H
2
SO
4
for 2 h at 20
o
C.
(2) Hydrolysis with 3% H
2
SO
4
performed on a hot plate, with a
4-h boiling period. The insoluble residue, expressed as a percentage
of the extractive-free oven-dried wood (105 ± 3
o
C to constant
weight), obtained after filtration, washing and drying, corresponded
to the Klason lignin content.
Lignins were characterized by thioacidolysis. Thioacidolysis is
an efficient procedure to estimate the amount and the monomeric
composition (S, G and H units) of uncondensed structures in lignins
by cleavage of arylglycerol-β-aryl ether bonds. As a single method,
thioacidolyse has a definite advantage in that it may be used to char-
acterize unambiguously typical and prominent lignin structures
[22]. Thioacidolysis involves solvolysis of 15 mg of extractive-free
wood in a dioxane/ethanethiol mixture (9/1, v/v) containing 0.2 M
of boron trifluoride etherate, for 4 h in an oil bath at 100
o
C. The
thioacidolysis recovered monomers were quantified by GC of their
trimethylsilylated derivatives [22].
2.4. Physical and mechanical properties
2.4.1. Rationale
Two physical and mechanical properties were measured because
of their impact on eucalyptus timber value. On the one hand, longi
-
tudinal growth stress, which is an intrinsic property of wood, can ex
-
plain the considerable internal effort – generally known as “growth
stresses” – sustained by wood of standing trees. These stresses are
released during processing operations (from felling to grading) and
can damage the wood by causing end splits, warping and broken
boards (major problems for eucalyptus), as explained by [16]. On
the other hand, shrinkage, generally related to LGS [13], whose in
-
tensity and heterogeneity are linked to the dimensional stability of
wood products.
2.4.2. Surface longitudinal growth strain (LGS)
Growth stresses originate from surface growth strains induced in
the cambial layer during the differentiation and maturation of new
cells and impeded by the mass of the whole trunk. These stresses
help to reorient the tree in a more favorable position. Longitudinal
growth strain at the stem surface is appraised on the basis of stress
released on the stem periphery by drilling into wood under the cam
-
bium [1–3].
LGS was measured using a unidirectional mechanical sensor de
-
signed by CIRAD-Forêt [3]. It measures the distance between two
reference points before and after drilling a hole equidistant from
these two points. This method is known as the “single hole method”,
and was described by [1].
2.4.3. Shrinkage
Longitudinal (LS), radial (RS) and tangential (TS) shrinkages
were measured in green (undried) samples and ovendried samples
(6% moisture content). Shrinkage was measured using a special de
-
vice based on a non-contact laser-optical displacement measure
-
ment (optoNCDT 1605.10 from MicroEpsilon). The results are
expressed as a ratio of the difference between green and ovendried
dimensions to the ovendried dimension:
XS
XO – XG
XO
=
where:
XS: shrinkage in theX=L,RorTplane;
XO: dimensions of the sample at 6% moisture content;
XG: dimensions of the green sample.
After the shrinkage measurements, the samples were ground for
NIRS measurements.
2.5. Near infrared spectroscopic (NIRS) technique
NIR spectra were collected in reflectance mode using a
Foss-Perstorp 6 500 spin cell apparatus. Spectral data acquired in
diffuse reflection between 400 and 2 500 nm (visible and close in-
frared), with a step at 2 nm, were processed with the NIRS 2 v. 4.11
software package (InfraSoft International).
A 16/32 sequence (16 measurements of the reference ceramic
then 32 measurements of the sample) was obtained for each sample.
The absorbance spectrum, represented as a log value(1/R), was ob
-
tained by averaging these measurements and comparing them to the
reference. Each sample was analysed twice (two powder samples).
The RMS (root mean square) [20] values considered for random
samples taken within each sub-group of sub-samples ranged from
180 to 700, mean of around 300. These values, calculated according
to the spectra second derivatives, reflected the spectral
reproducibility within the range set by the manufacturer, i.e. 800 for
powder products.
The spectral matrix (X matrix), which is n lines (each represent
-
ing a tested sample) and p rows (absorbances at wavelengths in the
NIR spectra [x
1
,x
2
, , x
p
], was used to determine the generalised
Mahalanobis distance [33]. This parameter, calculated on the basis
of a principal components matrix derived from a principal compo
-
nent analysis (PCA) of the spectral matrix, is a powerful tool for de
-
fining sample boundaries and similarity indices between spectra.
Mahalanobis distance is used as a spectrum outlier tool to detect in
-
strumental error, sample contamination, differences in sample han
-
dling, etc.
Predictions were made on an independent set of samples to as
-
sess the best portions of the electromagnetic spectrum [8], and the
results were analysed with different statistical tests to determine the
most accurate procedures. Partial least squares regression (PLS), as
described by [31], was then applied to obtain mathematical models
Near infrared spectroscopy of eucalyptus wood
481
comparing the spectral data (X matrix) and the reference laboratory
data. The latter is the Y matrix, which is n lines (each representing a
tested sample) and q rows (each representing a reference variable –
in this study of EC, LK, S/G, LGS, TS, RS and LS). Like the princi
-
pal components regression, the PLS method involves regression of
the predictive variable y on variables t
1
,t
2
, etc., which are latent vari
-
ables (linear combinations of x
1
,x
2
, , x
p
). However, in the PLS
method, the latent variables are obtained by taking y into account
and the predictive variables x
1
,x
2
, , x
p
, whereas in the principal
components regression method, the latent variables (i.e. the princi
-
pal components themselves) are obtained by only taking informa
-
tion derived from the predictive variables into account. The model
obtained with the PLS method is therefore always more “economi
-
cal” in comparison to that obtained using the principal components
regression method. Economy, in this context, means that there is a
relatively low number of latent variables, so the results are easier to
interpret and the model is more stable. The optimum number of PLS
terms was determined by cross-validation. The sample set was di
-
vided into four groups. The model was developed from three groups,
with the remaining group serving to validate the model. The opera
-
tion was reproduced four times, i.e. four subgroups for four
cross-validations. The standard error of cross-validation (SECV)
was the sum of errors for the three predictions – it enabled noise sep
-
aration and thus avoided overfitting [35]. The correct number of re
-
gression factors for the PLS model was determined by the minimum
mean square error of internal cross-validation [17].
After cross-validation, all samples were calibrated using the
number of factors determined by cross-validation. The SEP was es-
timated by predicting a set of 30 samples, with a random choice
within the population, through the calibration carried out on the re-
maining samples.
Outlier detection was based on the Student’s t test for residual
variability (difference between the NIRS analysis and reference
analysis results). This test assesses the variation between an NIRS
value and its laboratory reference value. Moreover, t values greater
than 2.5 were considered significant and samples with significant
values were possible outliers.
2.6. Calibration statistics
Calibration performance in terms of data fitting and prediction
accuracy was expressed by the coefficient of multiple determination
(R
2
), the standard error of calibration (SEC) and the standard error of
prediction (SEP):
SEC
(Y –Y)
N –k–1
i
i1
N
i
2
C
C
=⋅
=
∑
$
This statistic represents the SD for residual variations due to dif
-
ferences between actual (primary laboratory analytical values) and
NIRS predicted values for samples within the calibration set.
$
Y
i
is
the value of the constituent of interest for a validation sample i esti
-
mated using the calibration, Y
i
is the known value of the constituent
of interest of sample i,N
C
is the number of samples used to obtain
the calibration, and k is the number of factors used to obtain the cali
-
bration.
SEP
(Y –Y )
N–1
j
j1
N
j
2
P
P
=⋅
=
∑
$
This statistic represents the SD for residual variations due to dif
-
ferences between actual (primary laboratory analytical values) and
NIRS predicted values for samples outside of the calibration set us
-
ing a specific calibration equation (set of N independent samples).
$
Y
j
is the value of the constituent of interest for sample j predicted by the
calibration, Y
j
is the known value of the constituent of interest for
sample j, and N
p
is the number of samples in the prediction set.
The ratio of performance to deviation (RPD: ratio of the SD of
the reference results to SEP) is a measurement of the ability of an
NIRS model to predict a constituent [34]. Reporting the SEP alone
may be misleading unless it is reported by comparison with the SD
of the original reference data. If the SEP is close to the SD, then the
NIRS calibration is not efficiently predicting the composition or
functionality. If SEP = SD, the calibration is essentially predicting
the population mean. An RPD below 2 cannot give a relevant predic
-
tion. An RPD value of 2.0–3.0 is regarded as adequate for rough
screening. A value of above 3.0 is regarded as satisfactory for
screening (for example in plant breeding), values of 5 and upward
are suitable for quality control analysis, and values of above 8 are
excellent, and can be used in any analytical situation.
3. RESULTS
The RMS values obtained for two different samples were
2- to 3-fold higher than the RMS values obtained for two
sub-samples. These results indicate greater intersample than
intrasample variability. On this basis, the mean spectrum for
the two sub-samples were retained for the rest of the study.
3.1. Typical spectrum for extracted and nonextracted
samples
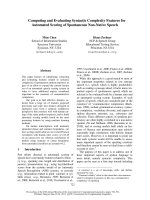
The spectra obtained for extracted and nonextracted sam-
ples were not significantly different (figures 1 and 2). The
major absorbance bands were similar for both spectra, and
only the total energy absorbed differed. Band variations for
both spectra were mainly observed in the regions of the two
water bands (1350–1450 nm and 1848–1968 nm) and
2050–2150 nm. Band variations near 2000 nm were due to
OH stretching combined with OH and CH deformation bonds
in the polysaccharide cellulose and xylan, and bands near
2132 nm were due to C
ar
-H stretching combined with C=C
stretching of lignin and extractives. Other minor bands were
also detected (table I).
482
H. Baillères et al.
-0.3
-0.2
-0.1
0
0.1
0.2
400 900 1400 1900 2400
wavelength (nm)
2nd Derivative Log(1/R)
Figure 1. NIR reflectance spectrum for nonextracted powder.
3.2. Prediction of the chemical composition: EC, KL
and S/G
The descriptive statistics for criteria analysed in the labo
-
ratory for these powder samples are presented in tables II and
III. The EC, KL and S/G ratio distributions were Gaussian.
The accuracy of the reference method based on a
reproducibility test was in accordance with the published data
[22, 23, 25].
3.2.1. From disks
The models (tables IV and V) developed on the basis of the
laboratory reference and the mean spectrum recorded for
nonextracted and extractive-free powder closely fitted the
data. The coefficients of determination calculated by com-
parison of the reference values and those predicted by the
NIRS equations were all above 0.85, except for the EC value
for extractive-free wood (R
2
= 0.75).
EC, KL content and the S/G ratio were predicted for a ran
-
domised set of about thirty samples using an equation previ
-
ously formulated for non-extracted and extractive-free wood
(tables VI and VII). This procedure enabled us to estimate the
SEP for an independent set of samples. These validation sets
were representative of actual values for the three criteria
within the original population – indeed, the statistical results
(mean and SD) for these samples were comparable to those of
the population from which they originated (table II). Samples
were withdrawn from the validation set because they were
outliers in Y (t test) during calibration for the whole popula
-
tion (see Section 2.5). This explains the difference between
the number of samples available and the number of samples
used in the calibration and validation sets for all criteria.
The standard error of prediction, estimated from the vali
-
dation sets, were around 0.3 for all criteria. Values estimated
for SEP and SECV were close for each criterion, indicating
that the introduction of the given number of PLS terms (ta
-
bles IV and V) did not cause an overfitting effect and that the
calibration model seemed valid. The coefficients of determi
-
nation (figures 3, 4, 5, 7 and 8) were all near 0.8 except for
Near infrared spectroscopy of eucalyptus wood 483
-0.03
-0.02
-0.01
0
0.01
0.02
0.03
400 900 1400 1900 2400
wavelength (nm)
2nd Derivative Log(1/R)
Figure 2. NIR reflectance spectrum for extracted powder.
Table I. Chemical assignment of the major absorbance bands in the
400–2500 nm region of the eucalyptus NIR spectrum [18].
Wavelength
(nm)
Bond vibration Structure
524 Electronic vibrations Green color
574 Electronic vibrations Green color
668 Electronic vibrations Red color
1394 CH stretch CH
2
bend CH2
1520 O-H stretch first overtone CONH
2
1616 C-H stretch first overtone =CH
2
1688 C-H stretch first overtone Aromatic
1724 C-H stretch first overtone CH
2
1740 S-H stretch first overtone -SH
1782 C-H stretch first overtone Cellulose
1896 O-H stretch C-O stretch C=O, CO
2
H
1910 O-H stretch first overtone Ar-OH
1992 N-H stretch bend combination band Amino acids
2028 C=O stretch second overtone CONH
2
2074 N-H
2
deformation second overtone Amide II
2266 O-H C-O combination bands Cellulose
2280 C-H CH
2
deformation combination bands CH
3
, starch
2296 C-H stretch bend second overtone Protein
2332 C-H stretch, C-H deformation Cellulose, starch
2386 C-O stretch O-H deformation 2nd
overtone
Primary alcohols
ROH
Table II. Descriptive statistics for extractive content (EC), S/G ratio
and Klason lignin content (KL) for the entire set of disk samples.
N: total number of samples statistically analysed; M: mean;
SD: standard error (deviation) for the x values (reference values);
SEL: standard error (deviation) for the laboratory data (reference
method) for 8 replications with the same control sample.
Criteria N M Range SD SEL
EC (%) 192 3.70 2.30–5.76 0.62 0.34
KL (%) 193 24.62 22.33–26.75 0.84 0.42
S/G ratio 193 4.03 2.89–5.82 0.54 0.08
Table III. Descriptive statistics for extractive content (EC), S/G ratio
and Klason lignin content (KL) for the entire set of extreme value
samples.
N: total number of samples statistically analysed; M: mean; SD: stan
-
dard error (deviation) for the x values (reference method values);
SEL: standard error (deviation) for the laboratory data (reference
method) for 9 replications with the same control sample.
Criteria N M Range SD SEL
KL (%) 92 26.36 22.79–30.36 1.43 0.58
S/G ratio 91 3.32 2.59–4.95 0.47 0.1
484 H. Baillères et al.
Table IV. Statistics of the equations developed for the nonextracted disk samples.
N: total number of samples statistically analysed; M: mean; R
2
: coefficient of multiple determination; SD: standard error (deviation) for x values
(reference method values); SEC: standard error of calibration; SECV: standard error of cross-validation; SEL: standard error for the laboratory
data (reference method) for 8 replications with the same control sample; SEP: standard error of prediction; RPD: ratio of performance to devia
-
tion.
Criteria N M SD SEC R
2
SECV SEL SEP Number of PLS terms RPD
EC (%) 191 3.70 0.62 0.20 0.87 0.27 0.34 0.28 8 2.2
KL (%) 188 24.6 0.82 0.29 0.87 0.37 0.42 0.36 8 2.3
S/G ratio 190 4.03 0.53 0.17 0.90 0.22 0.08 0.22 10 2.4
Table V. Statistics for equations formulated for the extractive-free disk samples.
N: total number of samples statistically analysed; M: mean; R
2
: coefficient of multiple determination; SD: standard error (deviation) for the
x values (reference method values); SEC: standard error of calibration; SECV: standard error of cross-validation; SEL: standard error for the
laboratory data (reference method); SEL: standard error for the laboratory data (reference method) for 8 replications with the same control sam
-
ple; RPD: ratio of performance to deviation.
Criteria N M SD SEC R
2
SECV SEL SEP Number of PLS terms RPD
EC (%) 186 3.66 0.58 0.29 0.75 0.35 0.34 0.29 8 2
KL (%) 189 24.62 0.84 0.30 0.87 0.34 0.42 0.32 6 2.6
S/G ratio 186 4.03 0.54 0.17 0.90 0.20 0.08 0.18 7 3
Table VI. Descriptive statistics for extractive content (EC), S/G ratio
and Klason lignin (KL) content for the validation set (nonextracted
disk samples).
N: total number of samples statistically analysed; M: mean; SD: stan-
dard error (deviation) for the x values (reference method values).
Criteria N M Range SD
EC (%) 30 3.66 2.46–4.72 0.61
KL (%) 30 24.43 23.09–26.21 0.79
S/G ratio 30 4.05 3.35–5.25 0.50
y = 0.94x + 0.27
R
2
= 0.79
2.5
3
3.5
4
4.5
5
2.5 3 3.5 4 4.5 5
predicted values (NIRS)
Actual values
Figure 3. Correlation between laboratory values and NIRS predicted
values (nonextracted disk samples) for EC, obtained for a set of 30 in
-
dependent samples (95% confidence interval).
y = 1.01x - 0.26
R
2
= 0.78
22.5
23
23.5
24
24.5
25
25.5
26
22.5 23 23.5 24 24.5 25 25.5 26
predicted values (NIRS)
Actual values
Figure 4. Correlation between laboratory values and NIRS predicted
values (nonextracted disk samples) for KL content, obtained for a set
of 30 independent samples (95% confidence interval).
Table VII. Descriptive statistics for extractive content (EC), S/G ra-
tio and Klason lignin (KL) content for the validation set (extrac-
tive-free disk samples).
N: total number of samples statistically analysed; M: mean; SD:
standard error (deviation)for the x values (reference method values).
Criteria N M Range SD
EC (%) 28 3.67 2.46–4.94 0.62
KL (%) 29 24.57 22.96–25.91 0.79
S/G ratio 30 4.14 3.22–5.14 0.54
the S/G ratio, which reached 0.9 for extractive-free wood.
The regression slopes were all close to 1, except for the EC
concerning extractive-free wood, which had a steeper slope
(1.23), while the mean bias values were close to zero.
The scatter plot for residual variations versus predicted
values confirmed the normality hypothesis and the independ
-
ence of the data. The residual variations were centred on zero
and did not vary with the predicted values.
3.2.2. From extreme value samples
The calibration performances for extreme value samples
were slightly poorer than those obtained for nonextracted
disk samples (tables IV and VIII). The RPD values were close
to 2 even though the coefficients of determination were
higher. This difference could be partially explained by the
low number of extreme value samples and the lower accuracy
of the reference method as compared to the disk sample anal
-
yses. This was shown by a higher SEL, which could be attrib
-
uted to the fact that the samples were quantitatively smaller
for the chemical assays (see Section 2.2.).
Twenty samples were randomly taken from this sample set
to form two subgroups for estimating the standard error of
prediction (SEP). We thus obtained a calibration file contain
-
ing 67 samples and a validation file containing 20 samples.
LK lignin contents and S/G ratio values for the validation
samples were in line with the results obtained for the entire
set (table III). The mean Klason lignin content was 26.95 and
Near infrared spectroscopy of eucalyptus wood 485
y = 1.05x - 0.22
R
2
= 0.81
3
3.5
4
4.5
5
5.5
3 3.5 4 4.5 5 5.5
predicted values (NIRS)
Actual values
Figure 5. Correlation between laboratory values and NIRS predicted
values (nonextracted disk samples) for S/G ratio, obtained for a set of
30 independent samples (95% confidence interval).
y = 1.23x - 0.98
R
2
= 0.82
2.5
3
3.5
4
4.5
5
5.5
2.5 3 3.5 4 4.5 5 5.5
predicted values (NIRS)
Actual values
Figure 6. Correlation between laboratory values and NIRS predicted
values (extractive-free disk samples) for EC, obtained for a set of 28
independent samples (95% confidence interval).
y = 1.01x - 0.13
R
2
= 0.83
22.5
23
23.5
24
24.5
25
25.5
26
22.5 23 23.5 24 24.5 25 25.5 26
predicted values (NIRS)
Actual values
Figure 7. Correlation between laboratory values and NIRS predicted
values (extractive-free disk samples) for KL content, obtained for a
set of 29 independent samples (95% confidence interval).
y = 1.005x - 0.06
R
2
= 0.90
3
3.5
4
4.5
5
5.5
3 3.5 4 4.5 5 5.5
predicted values (NIRS)
Actual values
Figure 8. Correlation between laboratory values and NIRS predicted
values (extractive-free disk samples) for S/G ratio, obtained for a set
of 30 independent samples (95% confidence interval).
the mean S/G ratio was 3.22. The standard deviations for
these two criteria were 1.64 and 0.43, respectively. Figures 9
and 10 show linear regressions between the reference and
predicted values. The coefficients of determination were
comparable to those obtained from disk sample validation
batches. However, the slopes and ordinates at the origin dif
-
fered significantly relative to the theoretical distribution.
3.3. Prediction of physical and mechanical properties
The descriptive statistics for criteria analysed in the labo
-
ratory on these samples are presented in table IX. The TS and
RS distributions were Gaussian. The LGS and LS distribu
-
tions were not Gaussian, i.e. they were levelled off. This was
due to the sampling method, which preferentially selected ex
-
treme LGS values.
No significant correlations were noted between LGS and
shrinkage, or between LGS or shrinkage and the chemical
characteristics, in contrast with the results reported by
Baillères et al. [4] and Gril et al. [13].
The models (table X) developed for LGS, TS, RS and LS
fitted the data relatively closely, except for LS, which had a
coefficient of determination of 0.35. Hence it was of no inter
-
est to develop a validation test for this criterion.
LGS, TS, and RS were predicted for a randomised set of
about 20 samples using an equation previously established.
The statistical criteria (mean and SD) for these samples (ta
-
ble XI) were comparable to those of the population from
which they originated (table IX).
The coefficients of determination for the regressions
calculated by comparison of the reference values with those
predicted by the NIRS equations (figures 11, 12 and 13)
486
H. Baillères et al.
Table VIII. Statistics for equations established for the set of extreme value samples.
N: total number of samples statistically analysed; M: mean; R
2
: coefficient of multiple determination; SD: standard error (deviation) for the
x values (reference method values); SEC: standard error of calibration; SECV: standard error of cross-validation; SEL: standard error for the
laboratory data (reference method) for 9 replications with the same control sample; SEP: standard error of prediction; RPD: ratio of performance
to deviation.
Criteria N M SD SEC R
2
SECV SEL SEP Number of PLS terms RPD
KL (%) 84 26.43 1.43 0.53 0.87 0.63 0.58 0.72 3 2
S/G ratio 81 3.25 0.38 0.07 0.97 0.11 0.1 0.18 8 2.1
y = 1.30x - 8.23
R
2
= 0.85
24
25
26
27
28
29
30
31
32
24 25 26 27 28 29 30 31 32
predicted values (NIRS)
Actual values
Figure 9. Correlation between laboratory values and NIRS predicted
values (extreme value samples) for KL content, obtained for a set of
20 independent samples (95% confidence interval).
y = 0.95x + 0.13
R
2
= 0.78
2.5
3
3.5
4
4.5
2.5 3 3.5 4 4.5
predicted values (NIRS)
Actual values
Figure 10. Correlation between laboratory values and NIRS pre
-
dicted values (extreme value samples) for S/G ratio, obtained for a set
of 20 independent samples (95% confidence interval).
were, by decreasing performance, 0.83, 0.63 and 0.45 for TS,
LGS and RS, respectively. The regression slopes were 1.093,
0.874 and 0.724, respectively, while the mean bias values
were 0.0005, –2.241 and 0.003. The scatter plot for the resid
-
ual variations versus the predicted values confirmed the nor
-
mality hypothesis and the independence of the data. The re
-
sidual variations were centred on zero and did not vary with
the predicted values.
Near infrared spectroscopy of eucalyptus wood 487
y = 0.87x + 8.98
R
2
= 0.63
0
50
100
150
200
0 50 100 150 200
Predicted values (NIRS)
Actualvalues
Figure 11. Correlation between laboratory values and NIRS pre
-
dicted values for longitudinal growth strain, obtained for a set of 18
independent samples (95% confidence interval).
y = 1.09x + 0.01
R
2
= 0.83
-0.14
-0.12
-0.1
-0.08
-0.06
-0.04
-0.14 -0.12 -0.1 -0.08 -0.06 -0.04
Predicted values (NIRS)
actual values
Figure 12. Correlation between laboratory values and NIRS pre
-
dicted values for tangential shrinkage, obtained for a set of 19 inde
-
pendent samples (95% confidence interval).
Table IX. Descriptive statistics for physical and mechanical properties for the entire set of samples.
N: total number of samples statistically analysed; M: mean; SD: standard error (deviation) for the x values (reference method values).
Criteria N M Range SD
Longitudinal growth strain 87 95.77 38 – 200 40.05
Tangential shrinkage 89 –0.083 –0.12 – (–0.05) 0.015
Radial shrinkage 89 –0.039 –0.06 – (–0.021) 0.008
Longitudinal shrinkage 89 –0.007 –0.0014 –(–0.0106) 0.0019
Table X. Statistics of equations established for physical and mechanical properties.
N: total number of samples statistically analysed; M: mean; R
2
: coefficient of multiple determination; SD: standard error (deviation) for the
x values (reference method values); SEC: standard error of calibration; SECV: standard error of cross-validation; SEL: standard error for the
laboratory data (reference method); SEP: standard error of prediction; RPD: ratio of performance to deviation.
Constituent N M SD SEC R
2
SECV SEL SEP Number of PLS terms RPD
Longitudinal growth strain 82 93.3 37.7 22.7 0.64 26.6 20.0 20.4 3 1.85
Tangential shrinkage 87 –0.08 0.014 0.006 0.82 0.008 0.001 0.006 4 2.33
Radial shrinkage 83 –0.04 0.007 0.004 0.65 0.005 0.002 0.007 2 1
Longitudinal shrinkage 82 –0.007 0.002 0.001 0.35 0.001 0.003 0.003 2 0.67
Table XI. Descriptive statistics for the physical and mechanical properties for the validation set.
N: total number of samples statistically analysed; M: mean; SD: standard error (deviation) for the x values (reference method values).
Criteria N M Range SD
Longitudinal growth strain 18 89.05 38 – 147 34.86
Tangential shrinkage 19 –0.086 –0.12 – (–0.05) 0.016
Radial shrinkage 19 –0.038 –0.02 – (–0.038) 0.008
4. DISCUSSION
The first key result of this study was that a reproducible
spectrum could be obtained for ground wood samples with
fixed moisture content (see Section 2.2.). Variations in parti-
cle size (between mesh 30 and mesh 60) did not have a signif-
icant effect on the spectra. Indeed, the projection of spectra
for a population on axes for the other population determined
by PCA will always give Mahalanobis distances below 3,
which is the rejection limit of membership at the 1% thresh-
old [33].
Sapwood samples obtained in the vicinity of the extreme
value samples were more physiologically mature as com
-
pared to the disk samples. This maturity was generally shown
by a higher lignin content and lower S/G ratio (see tables II
and III). This is in agreement with the results obtained by Ona
et al. and Yokoi et al. [19, 37] in Eucalyptus camaldulensis
and E. globulus.
4.1. Prediction of the chemical composition
The calibration statistics obtained in this study demon
-
strated that it is possible to predict EC, KL and S/G, as indi
-
cated by the coefficient of multiple determination and slopes
obtained for these three characteristics. The SEP estimated
on a set of independent samples (30) enabled us to predict
these chemical parameters directly from spectral data. Apart
from the extractive content, the statistical parameters of the
calibration equation applied were improved after wood ex
-
tractives were eliminated from the analysis. Indeed, the pres
-
ence of polyphenolic compounds in eucalypt wood extracts
can alter the lignin absorption bands located in the same spec
-
tral zones.
The RPD ratio was always above 2 but lower than 3, so
full-sibs of this hybrid could only be roughly classified. NIRS
calibrations based on nonextracted powder could neverthe
-
less be used directly.
Interestingly, we obtained a good correlation between the
EC and spectral data for extracted powder, which could be
explained by two hypotheses. In woods with high phenolic
material content, some extraneous materials are often so
highly polymerized that they cannot be extracted with neutral
organic solvents or with water [7, 38]. Such extraneous mate
-
rials remain in the wood and can be co-determined with lignin
through Klason lignin analysis. On the other hand, some met
-
abolic linkages between extractives and cell wall components
could account for this result. For example, Higuchi [14] indi
-
cated that some key enzymes are involved in the induction of
lignin and flavonoid biosynthesis.
The calibrations obtained for the extreme value samples
were not as good as those obtained for nonextractive disk
samples. The difference between the observed results could
be explained by the low number of extreme value samples
and the slightly higher SEL. However, the RPD remained
above 2, which once again confirmed – in a sample that dif-
fered with respect to its greater physiological maturity, its lo-
cation in the sapwood, and the wood-sample volume – that
these calibrations could be used effectively to predict specific
chemical characteristics. The quality of the results obtained
under these new sampling conditions indicated that NIRS is
quite efficient for this application because it generates more
targeted information and pertinent criteria on within-tree
variations in a specific characteristic. This heterogeneity
could be an interesting selection parameter in addition to
other criteria.
These calibrations should still be used with caution be
-
cause at most they can discriminate between a small number
of groups in a reference population. However, the fact that
NIRS can readily pinpoint individuals within a population
targeted for an improvement programme could be an espe
-
cially useful tool for tree breeders.
4.2. Prediction of physical and mechanical properties
For these calibrations, only around 88 samples were as
-
sessed, i.e. not sufficient to establish predictive models (only
20 samples for validation). For TS, 82% of the variance in the
reference measurement was explained by the model. The
SEC and RPD results indicated that the calibration error is
sufficiently low to use the NIRS technique as a rapid screen
-
ing tool. For LGS and RS, the statistical parameters were not
as good. Results have been previously obtained on small sam
-
ples that highlight a relationship between LGS and various
physical, mechanical, anatomical and chemical properties [4,
6, 13, 16, 24, 30]. These results explain the expected signifi
-
cant correlation between NIR spectral bands and some me
-
chanical and physical properties. They indicate that the LGS
measurement technique used in this study should be im
-
488
H. Baillères et al.
y = 0.72x - 0.01
R
2
= 0.45
-0.07
-0.06
-0.05
-0.04
-0.03
-0.02
-0.07 -0.06 -0.05 -0.04 -0.03 -0.02
Predicted values
actual values
Figure 13. Correlation between laboratory values and NIRS pre
-
dicted values for radial shrinkage, obtained fora set of 19 independent
samples (95% confidence interval).
proved in order to increase its accuracy. Moreover, the zone
responsible for the LGS value is certainly smaller than that of
the samples removed, especially in the radial plane where
about 80% of the stress released occurs within the first
10 mm [2, 24]. Its RPD ratio was relatively close to two, so
the population could be roughly classified.
In the transverse direction, the cellular organisation and
cross-sectional shape of the cells play an important role in
shrinkage [29]. Radial shrinkage closely depends on ana
-
tomic factors above and beyond individual cell structure and
composition. Among them, the major factor that affects
shrinkage is the restraint of radial shrinkage by rays because
of the low shrinkage potential and high stiffness as compared
to tissues of longitudinally aligned cells. RS is therefore
probably more dependent on the cellular organisation, which
does not influence spectra measured by the NIRS technique
on meal wood, thus leading to poor calibration quality.
The poor accuracy of the reference technique measure
-
ment, i.e. SEL was close to the SD for the set of samples (ta
-
ble X), was detrimental to the LS measurement. Highly
efficient measurement techniques and very careful specimen
preparation are necessary because of the very low degree of
longitudinal shrinkage that is generally detected. We tried to
boost measurement accuracy (use of a laser probe), but fur-
ther metrological improvements would be required.
Finally, our results indicate that NIRS could soon be used
for tree selection in forest tree breeding programmes on the
basis of criteria that are otherwise seldom taken into account
because they are economically and technically hard to mea-
sure on a large scale. However, the technique requires some
improvements to boost its efficiency and accuracy so as to be
able to more accurately distinguish between individuals in a
breeding population.
From a metrological viewpoint, the entire reference
method could be modified to enhance the accuracy of the
sample analyses. The required precision is obviously a ques
-
tion of suitability for the purpose. The lignin content parame
-
ter, for instance, could be significantly improved, as
demonstrated by Schwanninger and Hinterstoisser [25].
From a sampling design viewpoint, the calibration equa
-
tions could be improved by increasing the number of samples
and by assessing a wider span of values. The latter was not
taken into sufficient account at the sampling level. A better
choice of samples, i.e. especially with respect to extreme val
-
ues, could enhance the quality of the prediction models.
5. CONCLUSION
The results presented in this study indicate that NIRS can
be used to predict some major wood characteristics from
wood-meal samples in eucalyptus breeding programs. Each
of the major constituent groups, i.e. cellulose, hemi
-
celluloses, lignin, and extractives, contribute uniquely to the
properties and behaviour that characterise wood. How each
component affects wood quality also depends on each of the
other components. Prediction is thus only recommended for
the characteristic properties, at the pertinent scale, which de
-
pend closely on the chemical structure and composition of the
wood. Conversely, predictions will not be valid when other
factors have an influence on wood properties or when the ref
-
erence measurement is inaccurate or slightly variable. In the
latter case, methodological and metrological improvements
are possible. In fact, the quality of the calibration equation
closely depends on the choice of experimental design (train
-
ing samples) and also on the accuracy of the reference meth
-
ods.
NIRS calibrations for wood analysis could be enhanced
by:
– improving the sampling method by broadening the vari
-
ability range within the calibration set;
– improving the accuracy of the reference method, particu
-
larly for mechanical and physical characteristics such as
LGS or longitudinal shrinkage;
– determining the best measurement volume for samples in
order to avoid local and scale effects.
Solid wood samples should be used for NIRS analysis to
avoid tedious grinding operations, and to reduce analysis
time to just a few minutes, as compared to several hours for
traditional reference methods. This nondestructive strategy
could, for instance, be used to assess increment cores.
Acknowledgements: We wish to thank Philippe Vigneron for
breeding the full sib family and URPPI for field measurements in the
Congo. The work was financed by a research contract from the
French Ministère de l’enseignement et de la technologie (procédure
biotechnologie décision No 98C0204).
REFERENCES
[1] Archer R.R., Growth stresses and strains in trees, Springer series in
wood science, Springer-Verlag, 1986.
[2] Baillères H., Précontraintes de croissance et propriétés mécanophysi
-
ques de clones d’Eucalyptus (Pointe Noire–Congo): hétérogénéités, corréla
-
tions et interprétations histologiques, Thèse de l’Université de Bordeaux 1,
1994.
[3] Baillères H., Chanson B., Fournier M., Two field measurement techni
-
ques for appraising the longitudinal growth strains at the stem surface, Confe
-
rence proceedings, Plant Biomechanics, Elsevier Press, Paris, 1994.
[4] Baillères H., Chanson B., Fournier M., Tollier M.T., Monties B., Struc
-
ture, composition chimique et retraits de maturation du bois chez des clones
d’Eucalyptus, Ann. Sci. For. 52 (1995) 157–173.
[5] Baillères H., Chanson B., Fournier-Djimbi M., Plantations d’arbres à
croissance rapide et qualité des produits forestiers sous les tropiques, XI Con
-
grès forestier mondial, Octobre 1997, Antalya, Turquie 3 (1997) 54–62.
[6] Baillères H., Castan M., Monties B., Pollet B., Lapierre C., Lignin
structure in Buxus sempervirens L. reaction wood, Phytochemistry 44 (1996)
35–39.
[7] Bariska M., Pizzi A., The interaction of polyflavonoid tannins with
wood cell-walls, Holzforschung 40 (1986) 299–302.
Near infrared spectroscopy of eucalyptus wood 489
[8] Barnes R.J., Dhanoa M.S., Lister S.J., Standard normal variate trans
-
formation and de-trending of near-infrared diffuse reflectance spectra, Soc.
Appl. Spect. 43 (1989) 772–777.
[9] Bertrand D., Dufour E., La spectroscopie infrarouge et ses applications
analytiques, Collection sciences et techniques agroalimentaires, Éditions Tec
et Doc, 2000.
[10] Chiang V.L., Funaoka M., The difference between guaiacyl and
guaiacyl-syringyl lignins in their responses to kraft delignification, Holzfors
-
hung 44 (1990) 309–313.
[11] Downes G.M., Hudson I.L., Raymond C.A., Dean G.H., Michell A.J.,
Schmileck L.R., Evans R., Muneri A., Sampling plantationeucalypts forwood
and fibre properties, CSIRO publishing, 1997, 132 p.
[12] Effland M., Modified procedure to determine acid insoluble lignin in
wood and pulp, Tappi 60 (1977) 143–144.
[13] Gril J., Sassus F., Baillères H., Combes J.G., Shrinkage variability
predicted from growth strainsor chemical indicators, Wood-water relation, 1st
Conference of COST E8 “Performance of wood and wood-made products”,
Hoffmeyer P. (Ed.), Copenhagen, Denmark, 1997.
[14] Higuchi T., Biochemistry and molecular biology of wood, Springer
series in wood science, Springer-Verlag, 1997.
[15] Hoffmeyer P., Pedersen J.G., Evaluation of density and strength of
Norway spruce by near infrared reflectance spectroscopy, Holz Roh Werkst.
53 (1995) 165–170.
[16] Kubler H., Growth stresses in trees and related wood properties, Fo
-
restry Abstracts 48 (1987) 131–189.
[17] Martens H., Naes T., Multivariate calibration by data compression, in:
Willams P.C., Norris K.H. (Eds.), Near-infrared technology in the agricultural
and food industries, American Association of Cereal Chemists, Inc.,
Saint-Paul, USA, 1987, pp. 57–84.
[18] Michell A.J., Pulpwood quality estimation by near-infrared spectros-
copic measurements on eucalypt woods, Appita J. 48 (1995) 425–428.
[19] OnaT., Sonoda T., Itoh K., Shibata M., Relationship of lignin content,
lignin monomeric composition and hemicellulose composition in the same
trunk sought by their within-tree variations in Eucalyptus camaldulensis and
E. globulus, Holzforschung 51 (1997) 396–404.
[20] Osborne B.G., Fearn T., Hindle P.H., Practical NIR Spectroscopy
with application in food and beverage analysis, Osborne B.G., Fearn T.,
Hindle P.H. (Eds.), Longman Scientific & Technical, Harlow, England, 1993,
227 p.
[21] Raymond C.A., Schimleck L.R., Michell A.J., Muneri A., Nondes
-
tructive sampling of Eucalyptus globulus and E. nitens for wood properties.
III. Predicted pulp yield using Near infrared reflectance analysis, Wood Sci.
Technol. 35 (2001) 203–215.
[22] Rolando C., Monties B., Lapierre C., Thioacidolysis, in: Stephen
Y.L., Carlton W.D. (Eds.), Methods in lignin chemistry, Springer Series in
Wood, Ed. Timell, Springer-Verlag, 1992, pp. 334–350.
[23] Rowell R.M., The chemistry of solid wood, Advances in chemistry
series 207, Comstock M.J., Rowell R. (Eds.), The American Chemical Socie
-
ty, 1984.
[24] SassusF., Déformations de maturation et propriétés du bois detension
chez le hêtre et le peuplier : mesures et modèles, Thèse de l’ENGREF en
Sciences du bois, Montpellier, 1998.
[25] Schwanninger M., Hinterstoisser B., Klason lignin: modifications to
improve the precision of the standardized determination, Holzforschung 56
(2002) 161–166.
[26] Schimleck L.R., Michell A.J., Determination of within-tree variation
of Kraft pulp yield using near-infrared spectroscopy, Appita J. 81 (1998)
229–236.
[27] Schimleck L.R., Michell A.J., Raymond C.A., Muneri A., Estimation
of basicdensity ofEucalyptus globulus using near-infrared spectroscopy, Can.
J. For. Res. 29 (1999) 194–201.
[28] Schimleck L.R., Wright P.J., Michell A.J., Wallis A.F.A., Near-infra
-
red spectra and chemical compositions of Eucalyptus globulus and E. nitens
plantation woods, Appita J. 50 (1997) 40–46.
[29] Schniewind A.P., Berndt H., The composite nature of wood, in: Le
-
win M., Goldstein I.S. (Eds.), Wood structure and composition, Vol. 11, Mar
-
cel Dekker Inc., 1996, pp. 435–476.
[30] Sugiyama K., Okuyama T., Yamamoto H., Yoshida M., Generation
process of growth stresses in cell walls: relation between longitudinal released
strain and chemical composition, Wood Sci. Technol. 27 (1993) 257–262.
[31] Tenenhaus M., Gauchi J P., Ménardo C., Régression PLS et applica
-
tions, Revue de Statistique Appliquée, XLIII (1995) 7–63.
[32] Thygesen L.G., Determination of dry matter content and basic density
of Norway spruce by near infrared reflectance and transmission spectroscopy,
J. Near Infrared Spectrosc. 2 (1994) 127–135.
[33] Williams P., Norris K., Near infrared technology in the agricultural
and food industries, Williams P., Norris K. (Eds.), American Association of
Cereal Chemists, Inc., St Paul, Minnesota, USA, 1990, 330 p.
[34] Williams P.C., Sobering D.C., Comparison of commercial near infra-
red transmittance and reflectance instruments for analysis of whole grains and
seeds, J. Near Infrared Spectrosc. 1 (1993) 25–33.
[35] Wold S., Cross-validation estimation of the number of components in
factor and principal components models, Technometrics 20 (1978) 397–405.
[36] Wright J.A., Birkett M.D., Gambino M.J.T., Prediction of pulp yield
and cellulose content from wood samples using near infrared reflectance spec
-
troscopy, Tappi J. (1990) 164–166.
[37] Yokoi H., Ishida Y., Ohtani H., Tsuge S., Sonoda T., Ona T., Charac
-
terization of within-tree variation of lignin components in Eucalyptus camal
-
dulensis by pyrolysis-gas chromatography, Analyst 124 (1999) 669–674.
[38] Zavarin E., Cool L., Extraneous materials from wood, in: Lewin M.,
Goldstein I.S. (Eds.), Wood structure and composition, Vol. 11, Marcel Dek
-
ker Inc., 1996, pp. 321–408.
[39] Zobel B.J, Jett J.B., Genetics of wood production, Springer-Verlag,
Budapest, 1995, 289 p.
490 H. Baillères et al.