Báo cáo khao học: "Sap flow and water transfer in the Garonne River riparian woodland, France: first results on poplar and willow" ppsx
Bạn đang xem bản rút gọn của tài liệu. Xem và tải ngay bản đầy đủ của tài liệu tại đây (219.34 KB, 15 trang )
L. Lambs and E. MullerSap flow of poplar and willow
Original article
Sap flow and water transfer in the Garonne River
riparian woodland, France:
first results on poplar and willow
Luc Lambs
*
and Étienne Muller
Centre d’Écologie des Systèmes Aquatiques Continentaux (CESAC), 29 rue Marvig, 31055 Toulouse Cedex 5, France
(Received 15 January 2001; accepted 13 November 2001)
Abstract – This work is the first attempt at using Granier sap sensors on Populus nigra, Populus x euramericana cv I45/51 and Salix
alba for the monitoring of sap flows in an active floodplain over two consecutive years. The main characteristic of these diffuse porous
trees is their capacity to use several tree rings for xylem sap transfer. Results showed that the sap flux densities remained homogeneous
on the external 4 cm of the trunk, then decreased with depth. For young trees, the active sapwood can represent half of the trunk. Results
indicated that in the same environment and at the same age, daily differences existed between the two major native riparian tree species,
the black poplarandthe white willow.Their maximal sap fluxdensity (2.6–3.6 dm
3
dm
–2
h
–1
) was similarto other fast growingtrees. The
influence of age was the third important screened factor. Sap flow measurements over several months indicated that water uptake was
variable throughout the season, depending on water availability, and was more pronounced for older trees. The sap flux densities for the
planted poplar (I45/51) ranged from 2.2–2.6 dm
3
dm
–2
h
–1
(about 90 dm
3
day
–1
) in the wetter spring conditions and dropped to
1.6–1.7 dm
3
dm
–2
h
–1
(about 60 dm
3
day
–1
) in less favourable conditions. Under the worst conditions, e.g., the especially long drought in
the summer of 1998, these values dropped to 1.0–1.2 (about 40 dm
3
day
–1
), and even to 0.35 dm
3
dm
–2
h
–1
(about 12 dm
3
day
–1
) for a few
days. Complementary long-term studies areneeded to better understand the complex sapflow changes and to be able torelate them to si-
gnificant environmental factors. Priority should be given to the long-term monitoring of sap flows at different depths for a correct esti-
mation of actual daily water uptakes by riparian softwood trees.
sap flow / riparian forest / water cycle / poplar / willow
Résumé – Mesure des flux de sève et des transferts hydriques dans les ripisylves le long de la Garonne ; premiers résultats pour
les peupliers et les saules. Ce travail est le premier essai d’utilisation des capteurs de sève de type Granier sur du Populus nigra,duPo-
pulus x euramericana cv I45/51 et du Salix alba pour la mesure de flux de sève dans une plaine inondable sur deux années consécutives.
La caractéristique principale de ces bois tendres est leur capacité d’utiliser plusieurs cernes annuels pour le transfert de la sève brute. Les
résultats montrent que les densités de flux de sève restent homogènes sur les quatre premiers centimètres du tronc, puis décroissent avec
la profondeur. Pour les jeunes arbres, lapartie active de bois d’aubier peut représenter la moitié du tronc.Les données montrent que pour
un même environnement et pour le même âge, des différences journalières existent entre les deux espèces majeures des ripisylves, le
peuplier noir etle saule blanc. Leursvaleurs de densité deflux de sève maximale(de 2,6 à 3,6dm
3
dm
–2
h
–1
) sont similairesà d’autres ar-
bres à croissance rapide. L’influence de l’âge a été le troisième facteur étudié. Des mesures pendant plusieurs mois ont montré une
grande variabilité au cours de la saison, en fonction des conditions hydriques, et est plus marquée pour les arbres âgés. La densité de flux
de sève pour le peuplier planté (I45/51) varie de 2,2–2,6 dm
3
dm
–2
h
–1
(environ 90 dm
3
jour
–1
) dans les conditions humides de printemps,
Ann. For. Sci. 59 (2002) 301–315
301
© INRA, EDP Sciences, 2002
DOI: 10.1051/forest:2002026
* Correspondence and reprints
Tel. +335 62 26 99 94; Fax. +335 62 26 99 99; e-mail:
et diminue à 1,6–1,7 dm
3
dm
–2
h
–1
(environ 60 dm
3
jour
–1
) dans des conditions moins favorables. Dans les conditions extrêmes, lors de la
longue sécheresse de l’été 1998, ces valeurs tombent à 1,0–1,2 (environ 40 dm
3
jour
–1
), et même à 0,35 dm
3
dm
–2
h
–1
(environ
12 dm
3
jour
–1
) pour quelques jours. Des études complémentaires sur le long terme sont nécessaires pour mieux comprendre les change-
ments complexes des flux de sève, et pour être capable de les relier aux facteurs environnementaux significatifs. La priorité devrait être
donnée à des mesures simultanées de flux desève à plusieurs profondeurs pour avoir une meilleure estimation des consommations jour-
nalières en eau de ces arbres riverains.
flux de sève / forêt riveraine / cycle de l’eau / peuplier / saule
1. INTRODUCTION
Sap flow measurement is the only way to follow the
water consumption of trees in their natural environment.
This technique is precise and adaptable enough to follow
the variation at a daily to seasonal scale. Many sap flow
studies have been undertaken for forest trees [4, 10, 11],
ring-porous trees such as oak [20], coniferous trees such
as pine and spruce [5, 20] and for orchards [1, 19]. How-
ever, very few authors focused on diffuse-ring trees in
wetland environments. In the literature, the latest deter-
mination of water consumption of softwood trees, as re-
viewed by Wullschleger et al. [25], concerned planted
poplar [8, 13] and some willows [3, 8].
In alluvial conditions, where the water availability is
very variable (from flood to drought), the relationship
between riparian vegetation, groundwater and stream
water is often complex [24]. Trees may tap water stored
in riverbanks or in alluvial aquifers, which may be de-
pendent on periodic flooding for their recharge, or may
tap groundwater discharged into streams [17, 4]. Al-
though a study has shown that riparian trees can be inde-
pendent of stream water in desert conditions [7], in
general, trees may switch between stream water and the
nearby groundwater source.
Experiments are not very easy todesign in riparian en-
vironment because periodic floods may damage the sen-
sors and other instruments. Moreover, all species do not
strictly establish in the same conditions; therefore, strict
comparisons in controlled situations are difficult to
make.
Other than the lysimeter, the oldest system for mea-
suring sap flow is heat pulse velocity [15] and many im-
provements have been made to this system. One classic
installation consists of a single thermistor upstream and
downstream of a central heat probe. Heat pulse duration
is about one second and the measurement is quite
accurate. However, this technique requires specific
calibration. One alternative is to calculate the sap flow
from the energy balance of a sector of the hydroactive xy-
lem [2]. This measurement is independent of sapwood
thickness, but no information is given on how the water
flows in the tree rings. This system was applied to a wil-
low (Salix fragilis L.) in a polycormic form and,tofollow
the tree ring activity, a stained solution was injected into
the tree [3]. However, the tree must be bored at different
places or cut into slices to visualize dye distribution.
The sap flow technique, as described by Granier in
1985 [9], is an efficient tool that is routinely used in for-
est stands and orchards. This radial sap flow meter uses a
continuously heated sensor. The Granier system mea-
sures the quantity of sap moving around the sensor for a
given sapwood area. In many ring-porous trees, only the
last (external) tree ringconducts sap. For example, in oak
(Quercus petraea), the sapwood thickness was about
20 mm, and 80% of the sap circulated was in the first
outer centimetre of the sapwood [10]. The existing
20 mm-long needles are well adapted for these kinds of
trees. In such cases, the overall water consumption by the
tree can be easily calculated and the exact thickness of
the sapwood can be checked by the difference in the
colours of a wood core extracted with an increment
borer.
For other kinds of trees, especially softwood trees,
there are indications that the active sapwood in not
limited to the external ring. For instance, for coniferous
trees such as the Scot’s Pine (Pinus sylvestris), the sap-
wood thickness is about 5 cm in a 20 cm diameter tree,
with a quite constant sap flow from 0–3.6 cm. The de-
crease is sharp and close to the sapwood/hardwood lim-
its [10]. Other authors have used a heat pulse velocity
system at different depths [12] with sensors at 0.5, 1, 2
and 4 cm depths on a 70 cm wide poplar (P. deltoides
Marsch.). Over this short distance, compared to the
wide diameter of the tree, they observed a reduction of
sap flow as a function of depth. In other studies, Granier
sensors were placed at different depths on yellow poplars
302 L. Lambs and E. Muller
(Liriodendron tulipifera L.), but the distance in centi-
metres is unknown as the increment was a function of the
width of the tree ring [26].
In poplars and willows, i.e., in diffuse porous riparian
trees, little is known of sapwood activity. Generally, the
wood core does not give any useful information because
the tree rings are not well defined [6]. Moreover, the dif-
ference in colour between the sapwood and the more in-
ternal hardwood in such small samples is not very
distinct. There are also some indications that sap flow
densities vary with the species and with the age of the
tree [25–26]. However, little is known on how it varies
with time through a growing season.
The general aim of this study was to monitor the water
consumption of the two dominant European riparian
trees, the black poplar (Populus nigra L.) and the white
willow (Salix alba L.), in the active floodplain of the
Garonne River, France. The drastic and changing soil
moisture conditions, which maintain a high biodiversity
in such riparian areas, probably imposed a high physio-
logic adaptation ability to the existing species. However,
it is not clear whether a tree can regulate water uptake in
the case of flood or drought.Nor is it clear whether, in the
same environment, differences exist between species of
the same age, or between ages, for the same species. In
addition, little is known on the active sapwood depth.
Therefore, the objectives of this study were, (1) to test
the active sapwood depth of the poplar, (2) to compare
the differences in the sap flow of a black poplar, a white
willow and a planted poplar clone of the same age, and
(3) to compare the sap flows of black poplars at two dis-
tinct ages in the same environment.
2. MATERIALS AND METHODS
2.1. Site description
The field site was a 2 km-long gravel bar, 250 m wide
along the Garonne River and located 50 km downstream
of Toulouse, France at an elevation of 90 m above sea
level. This area, about mid-length of the river, is the drier
part of the whole Garonne basin. The mean rainfall is
about 700 mm, which ranges from 900 mm at the Atlantic
coast to 1400–2000 mm on the Pyrénées slopes. This part
of the Garonne valley has a mean annual potential
evapotranspiration (Penman equation) of about 850 mm,
which means that the vegetation is in hydric deficit dur-
ing the hottest months. The Garonne River has a mean
annual discharge of about 200 m
3
s
–1
. In summer, the ob-
jective low water flood is 42 m
3
s
–1
. Normal annual floods
correspond to about 1000 m
3
s
–1
and increase the river
level by about 2 m. On 11 June 2000, a 50 year flood of
2925 m
3
s
–1
(plus 6 metres) destroyed both sensors and
data loggers. The site has been progressively settled by
woody vegetation over the last 15 years, with mainly
black poplars and white willows. In the floodplain, there
is a large plantation of hybrid poplar clones nearby
(Populus x euramerica cv I45/51); this is one of the dom-
inant planted poplars in the Garonne valley. Three
transects were marked on this gravel bar and equipped
with piezometers (p), designated from p1 to p18, to mon-
itor the water table level [16]. Sap flow measurements
were made on trees located at SF1, SF2 and SF3 on the
cross-section of the third transect (the furthest down-
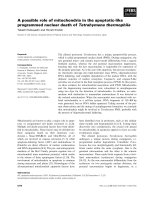
stream) as shown in figure 1. The plotted ground lines
Sap flow of poplar and willow 303
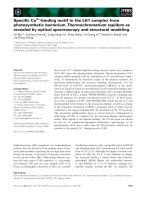
Figure 1. Field site transect on
the Garonne River, 50 km down-
stream of Toulouse, south-west
France. In abscissa, the distance
is inmetres from theriver at low
water. In ordinate, the eleva-
tion was measured in metres
above sea level. The two dotted
lines represent the fluctuation
of the water table depths in
1998–1999. SF1, SF2 and SF3
correspond to the sap flux
measurement area. The nine
piezometers are shown by verti-
cal lines.
were obtained from a microtopographic survey using
Rec Elta14, Zeiss equipment.
2.2. The sap flow sensors
In the nearby 10-year-old I45/51 poplar plantation,
one tree was equipped with Granier sensors from
09/06/98 to 12/11/98, with 91 days of effective data
(SF1). The heating sensors were supplied with an 80 Ah
lead battery, changed every 10 days, and used to deter-
mine the depth of the active sapwood. As only 2 cm sen-
sors were available, the problem was solved as follows: a
first sensor was maintained at the surface of the sapwood
with measurements at 0–2 cm and a second sensor was
placed into a 10 mm-wide hole to a depth of 2 cm with ef-
fective measurements at 2–4 cm. One week later, the sec-
ond sensor was inserted into a deeper hole of 4 cm with
measurements at 4–6 cm. Finally, it was inserted into a
6 cm hole with measurements at 6–8 cm. In other words,
measurements at each depth lasted one week and could
be compared with simultaneous reference measurements
at the surface (0–2 cm). All of the experimental sap flow
conditions are reported in table I. The reported elevation
corresponds to the elevation of the ground above the lo-
cal water table with the seasonal fluctuation observed be-
tween 1998 and 1999.
On SF2, a black poplar and a white willow of almost
the same age as the I45/51 poplar (9 and 10 years, respec-
tively) were found very close to each other (about 3 m),
i.e., in the same substrate and moisture conditions.
However, in the floodplain, both spontaneous trees were
located at a lower elevation than the planted poplar
I45/51 (figure 1). Sap flow surface measurements at
0–2 cm were made on both trees, with simultaneous
measurements on the I45/51 poplar. Additional deeper
measurements at 2–4 cm were also made in the black
poplar. Unfortunately, following several functioning
problems (e.g., sensor wires eaten away several times by
rodents), the days of effective data were reduced to
42 days for the black poplar and 28 days for the white
willow. However, on the black poplar, measurements at
0–2 cm and 2–4 cm were effective over 42 days. The SF2
heat sensors were supplied with two 18 W solar panels
and regulated with an 80 Ah lead battery.
The same set of sensors (SF3) was installed one year
later near the main channel of the Garonne River, on two
nearby five- and eight-year-old black poplars separated
by only 2 m. Surface measurements were made from
9/04/1999 to 07/09/1999, with 118 daysof effective data.
Sensors were supplied with the same 18 W solar panels
and 80 Ah lead battery.
A Granier sensor (UP Gmbh, Germany) consists of
two cylindrical probes (20 mm long, 2 mm in diameter)
that are inserted, one above the other at a distance of
about 12 cm, into the sapwood after the bark is removed.
Each probe contains, at mid-length, a copper-constantan
thermocouple. The upper one is heated at a constant rate
by the Joule effect. The lower (reference probe) is not
heated and remains at wood temperature. The heads of
the probes are isolated with fibreglass. Each sensor was
installed on the shadiest side of the trees and isolated by
a special bi-face reflective film, including expanded
polystyrene, to reduce the external thermaldisturbances
and to avoid contact with rain. The system measures the
temperature difference between the two thermocouples
wired in opposition and the temperature difference de-
crease with an increase in sap flow. During the night,
sap flow ceases, all the energy of the heating probe is
dissipated by conduction in the sapwood and the maxi-
mal temperature difference ∆T(0) is observed. When the
304 L. Lambs and E. Muller
Table I. Experimental sapflow conditions.
Tree Type Tree
density
Elevation
(m)
Age
(year)
Diameter
(cm)
Height
(m)
Sap sensor
position
Duration
(week)
SF1 Populus x euramerica I45/51 low 2.10–2.70 10 29.0 22 2 surfaces
surface / –2cm
surface / –4cm
surface / –6cm
10
1
1
1
SF2 1 Populus nigra
1 Salix alba
medium 0.80–1.50 9
10
21.7
14.6
12
10
1 surface
surface / –2cm
1 surface
4
6
4
SF3 1 Populus nigra “old”
1 Populus nigra “young”
high 1.46–2.00 8
5
18.0
9.0
10
8
1 surface
1 surface
1 surface / dendrometer
17
15
2
sap circulates in the xylem, the temperature difference
∆T(u) decreases because the heater probe is cooled by
the sap flow (convective heat transfer). Using the
Granier calibration formula (sap flux density =
4.28*[∆T(0)/∆T(u) –1]
1.231
in dm
3
dm
–2
h
–1
), the sap flux
curves are computed from the temperature differences
measured between the two probes [11].
Measurements with the Granier sap sensors were
made every 30 s and averaged and recorded every 5 mn
(i.e. 288 values per day and per sensor) in data loggers
(Datahog, Skye Instrument Ltd, UK). Data were down-
loaded every 10 days in the field using a portable micro-
computer.
2.3 Others sensors
The water consumption of trees is very variable and
depends on the tree species, treedimension,local moisture
conditions and climate. To better interpret the sap flow
data, other parameters were simultaneously recorded at
the same rate on data loggers. The photosynthetic active
radiation (PAR) was measured under the trees with JYP
gallium arsenide photodiodes (JYP 1000, SDEC,
France). The JYP sensors are suitable to PAR measure-
ments under canopies and allow high output levels with a
linear response up to 5000 µmoles m
–2
s
–1
[21]. The air
temperature and air humidity (Skye Instrument Ltd, UK)
were recorded under the tree canopy as well.
To monitor the trunk width variation and possible wa-
ter storage by the tree, a temperature-compensated
dendrometer (DEX 100, Dynamax, USA) was installed
on the smallest poplar in SF3 from 13/08/99 to 7/09/99.
This electronic microdendrometer used a full-bridge
strain gauge attached to a flexible arm of a calliper-style
device. The millivolt output signal shows both the
diurnal and seasonal growth of the trunk. These data
were recorded simultaneously with the sap flow mea-
surement. Long-term tree growth can be linked to water
availability using a dendrochronology approach. How-
ever, wood cores obtained from softwood trees are often
not useful as the tree rings are difficult to detect and the
cores are twisted. Nevertheless, some authors claim to
be able to do so after special preparation with sandpaper
[6]. Our experience indicates that the information is
more reliable using the wood plate. In this study,
dendrochronology was used on wood plates obtained in
SF1 from a nearby planted poplar (i.e., a clone of exactly
the same age), in SF3 from another 10-year-old black
poplar established at about the same time, and from vari-
ous other planted poplars growing along the Garonne
River. Two perpendicular lines were drawn on each
sandpapered wood plate, with their intersection in the
centre of the deeper (older) ring. On each line, the tree
rings were measured and the mean value for each year
ring was calculated from the four obtained data sets. The
rainfall values and potential evapotranspiration were ob-
tained from the Meteo-France Company of the Tarn-et-
Garonne district.
3. RESULTS
3.1. Influence of the active sapwood depth
On the I45/51 planted poplar (SF1), two sensors were
initially placed at the same depth (0–2 cm) to check the
homogeneity of the sap flow in the external tree rings.
After a few days, data were similar and the second sensor
was placed progressively deeper in the trunk with simul-
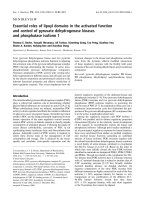
taneous measurements at the surface. Results of the test
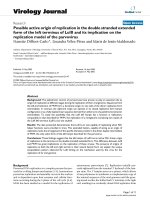
showed that for the I45/51 poplar the sapwood activity
remained rather stable over 4 cm, then decreased with
wood depth (figure 2). At the surface (0–2cm), the sap
flux density (SFD) was taken as the reference and the
corresponding index of sapwood activity was 100%. Sur-
prisingly, at 2–4 cm, the sapwood activity remained high
(107±7dm
3
dm
–2
h
–1
), then progressively decreased to
77 (± 6) at 4–6 cm and to 27 (± 5) at 6–8 cm.
As the diameter of the tree was 29 cm, the collected
data concerned more than half of the tree rings (i.e. the
last five years of the 10-year-old poplar). In other words,
Sap flow of poplar and willow 305
0
20
40
60
80
100
120
140
0-2 cm 2-4 cm 4-6 cm 6-8 cm
wood depth
Populus x euroamerica 29 cm
Populus nigra 22 cm
SFD Index (%)
Figure 2. The sap flux density index (SFD %) is the ratio of the
maximal SFD value obtained at given depth (2–4cm, 4–6cm or
6–8 cm) by the maximal SFD value at the surface (0–2 cm) ob-
tained on the same day. The mean values obtainedover one week
of measurements were plotted with the standard deviation at
each depth.
these fast growing trees are characterized by a wide
active sapwood and not by just the very external rings. In
the wood plates, a slight colour change could beobserved
at 8–10 cm and may correspond to a change in sapwood
activity. The diameter of the black poplar (SF2) was
smaller (21.7 cm) and the sap activity was checked in
only the first 4 cm. The results were similar, with a high
value for the sapwood activity at 2–4 cm (102±8dm
3
dm
–2
h
–1
). The measured wood plates of nearby black
poplars of identical diameter showed a difference in col-
our at 6 cm. This test showed that the external surface of
the sapwood of poplar is characterized by almost the
same sap activity over about 4 cm and that, deeper in the
trunk, the activity progressively decreased, but could still
exist at 8 cm.
3.2. Species influence
Three kinds of tree of nearly the same age (9–10 years
old) were compared. The planted poplar clone I45/51
(SF1 in figure 1), was located in a more elevated position
in the floodplain than the natural riparian woodland. For
this reason, it was less frequently flooded than the black
poplar and the white willow, which were both located at
the border of the riparian woodland (SF2) under the same
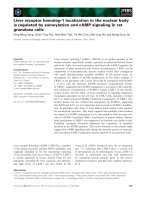
moisture conditions. Figure 3 gives an example of sap
flow density curves observed over three contrasted con-
secutive days from 24/06/98 to 26/06/98. The first day
was both sunny and dry, the second day was rainy andthe
third densely cloudy. Results showed that the sap flow
followed the daylight with a time lag. In the morning the
increase is rapid, and when the weather is sunny the sap
306 L. Lambs and E. Muller
Figure 3. Comparison of the sap flux density of the planted poplar clone (heavy line), the black poplar (fine black line) and the willow
(grey line) for 24, 25 and 26 June 1998. The photosynthetic active radiation (PAR) under the trees, to indicate sunlight periods, is plotted
in a second frame, as well as the air humidity. The last frame reports the variation of the air temperature under the canopy and the vapour
pressure deficit (VPD). The rainfall period of the second day is indicated by arrows.
flow reaches a plateau about two hours later. The de-
crease in the evening is sharp, and the minimum value is
observed late at night or early in the morning. The PAR
indicates the timing of leaf activity. One part of the high
frequency PAR variation during the day is due to the
shadowing effect of the leaves, since the sensor was un-
der the canopy. The air humidity is also an important fac-
tor, as the evapotranspiration is very active when the
atmosphere and the leaves are dry. On the second day,
this effect was especially clear. The morning rain (from
8.30 to 11.00 am) stopped the beginning of the water up-
take by trees, which started again only when the air hu-
midity became less saturated. This rain event provoked a
drop in temperature of about 1°C. The calculated vapour
pressure deficit (VPD) is given in figure 3 (bottom
graph). The concomitant reaction of the two poplars can
be observed, but the amplitude of the flow is lower for the
I45/51 because of its drier environment. The willow re-
sponse is different, with a later morning increase and an
earlier evening decrease, perhaps related to less access to
sunlight. The diurnal length of active sap flow is, there-
fore, shorter for the willow than for both poplars, but the
amplitude is the same as for the black poplar, probably
because they developed in the same moisture environ-
ment. Results showed that each species had its own sap
flow pattern and that the local water supply probably de-
termines the daily amplitude of the sap flow.
3.3. Influence of age
Two black poplars of different ages (five and eight
years), and growing 2 m apart, were chosen on the other
side of the riparian woodland close to the river (SF3 in
figure 1). They were established on a gravel substrate
covered by 80 cm of sand. Figures 4A and 4B summarize
the seasonal monitoring of the two poplars from the be-
ginning of spring (end of March 1999) to the end of sum-
mer (beginning of September 1999). Two types of fluxes
were plotted. The instantaneous values correspond to the
sap flux densities recorded every 5 min and thetotaldaily
fluxes integrate the instantaneous values over a day and
permit flux comparisons between days. Results showed
that the smallest tree developed leaves firstanddisplayed
earlier and higher sap fluxes than the older poplar. As
night temperatures until mid-April remained quite low
(5–8 °C), the leaf development was restrained, and so
the sap values did not rise. After mid-April, the older tree
increased its water consumption progressively up to the
rate of 2 dm
3
dm
–2
h
–1
. The smaller tree was partly shaded
by the larger tree, and probably in competition at the root
level, and its sap values remained lower. On very cloudy
and rainy days, such as April 22 and 23 and May 3 and 4,
the daily sap fluxes were reduced for both trees. After the
river flood on 05/05/99 (h = 2.70 m), the water absorption
by the smaller poplar increased and even surpassed that
of the older poplar for a period. This probably corre-
sponded to a reduced competition for water because of
the extra water availability following the flood. Unfortu-
nately, data were missing between May 14 and 25, fol-
lowing a problem with the heating system during a more
important flood. The peak of the flood arrived on May 18
(h = 3.12 m), in the middle of a four-day period of heavy
rain. Local temperatures dropped from 28 °C to 15 °C
during the day and from 16 °C to 9 °C at night. Both trees
were flooded by about 10 cm of water above ground
level, and the entire riparian woodland ground was under
water for a few days. After the flood, the mean diurnal
sap flux value remained around 2 dm
3
dm
–2
h
–1
for the
five-year-old poplar and for the eight-year-old poplar,
with some lower values on very cloudy days such as June
5 and 13. The second part of the figure corresponds to
summer, i.e., to the local low water flow. During this pe-
riod, the shape of sap flux densities remained very simi-
lar for both trees and the daily sap fluxes did not appear to
be affected by the lowering of the river flow during about
one month. This was probably because the root system
was still well connected to the water table. A decrease in
the sap flux density became visible at the end of July and
was more severe for the larger poplar. After a slight in-
crease of river discharge at the end of the month, and a
consecutive recharge of the water table, it seems (despite
missing data) that the sap flux density increased slightly
until mid-August. Then, following persistent low-water
flow, the sap fluxes decreased and remained low until
September. Results indicated that when the water table is
high, poplars have high sap fluxes, and they decrease
their water uptake when water is unavailable. Therefore,
during the annual drought period, poplars are very sensi-
tive to river discharge fluctuations. Young trees are more
sensitive and vulnerable to these water table variations.
3.4. Other water transfers
3.4.1. Variation in sapwood hydration
As the thermal conduction ability of the wood is influ-
enced by its water content, the minimum night values
∆T(0) measured by the sap sensors was used as an indica-
tor of sapwood hydration, as suggested by Granier (per-
sonal communication). Data of the planted poplar I45/51
were, therefore, re-examined in that perspective.
Sap flow of poplar and willow 307
In 1998 the daily maximum SFD in the first 0–2 cm
ranged from 1.5–2.2 dm
3
dm
–2
h
–1
during the wet June
month, then dropped to about 1.0 dm
3
dm
–2
h
–1
during the
drier July month. Clearly, the summer drought was more
severe for the planted poplar than for the natural wood-
lands situated at a lower level and closer to the river. The
planted poplar had a significantly reduced water con-
sumption and a partial leaf fall. In August, the drought
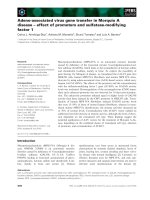
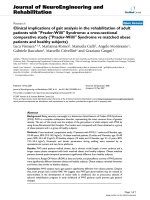
was even worse and figure5 (top curve) reports the varia-
tion in SFD in sapwood hydration over three consecutive
months. The corresponding inputs of water are reported
in the second frame with the daily rainfall (histogram)
and the fluctuation in river level (solid grey line). A pre-
vious study showed that at this site the groundwaterlevel
closely followed the river discharge [16]. Thedroughtre-
mained very severe until the end of August. After local
rainfalls, and an increase of the water table level at the
beginning of September, the water uptake by the tree
started to increase, new leaves grew and the SFD re-
turned to its high spring value.
The second curve in the upper frame in figure 5 repre-
sents the variation of the sapwood hydration and corre-
sponds to the minimum night values ∆T(0) measured by
the sap sensors. The two curves were very similar. How-
ever, the SFD seemed to be more sensitive to the varia-
tion in daily solar intensity and other atmospheric
variations, while the sapwood hydration showed less
variations. A few days’ lag was also visible when the
SFD started to increase at the beginning of September.
After the drought, the tree probably needed some time to
hydrate its tissues. Hydration curves after the drought
were slightly delayed at 0–2 cm (about 2 days) and de-
layed by about one week at 2–4 cm. Sapwood hydration
and the Garonne river level present a low correlation co-
efficient of 0.42. Flood waters is in part stored by the
high retention capacity of local sediment; this delay has
an effect on the correlation coefficient value.
308 L. Lambs and E. Muller
Figures 4A.Seasonal sap fluxdensity of twoclose black poplarsof different agesin function of the riverheight and globalradiation.
3.4.2. Daily stem width variation
Electronic microdendrometers detected an elastic re-
versible daily fluctuation of the stem width within the
range of 0.10–0.25 mm. Figure 6 reports this variation on
the small back poplar (9 cm) in SF3 on three consecutive
days (28/08/99 to 30/09/99) with the simultaneous sap
flow densities. The first day wasverycloudy, but without
rain, while the two following days were sunny. On the
first day, with a high air humidity there was nearly no
stem width variation, whereas during the two following
sunny days the stem width decreased by 0.2 mm with a
strong diurnal variation. The stem width is maximal early
in the morning, just before the sap begins to flow. During
the day, stem width shrinksrapidly until sap flow reaches
its maximum level and until air humidity increases
again. Stem width subsequently increases slowly over-
night until the next morning. The minimal daily stem
width is variable from one dayto another, but seems to be
correlated to the minimum in air humidity. A daily stem
width variation of 0.2 mm is very tiny and corresponds to
only 0.2% variation in diameter, i.e. equivalent to a vol-
ume of about 1 dm
3
for that tree.
3.4.3. Annual fluctuation in stem growth
Dendrochronology is a good indicator of the past
hydric conditions of a given riparian woodland. In the
upper frame of figure 7 the year ring width of three pop-
lars, growing on a transect perpendicular to the river, are
reported. The young black poplar growing close to the
Garonne River (SF3) showed a profile different from the
poplar clones growing at a higher elevation, both in the
SF1 plantation (I45/51 clone) and in another nearby plan-
tation (Robusta clone, further up the river). These trees,
growing within a few hundred metres of the river,
showed different growths that can only bedueto the river
influence and soil moisture retention ability. In contrast,
other trees separated by a few kilometres, but growing on
a transect along the river in similar moisture conditions
Sap flow of poplar and willow 309
Figures 4B. Seasonal sap flux density of two close black poplars of different ages in function of the river height and global radiation.
310 L. Lambs and E. Muller
Rainfall (mm)
Garonne level (m)
0
4
8
12
16
20
10/08/98 17/08/98 24/08/98 31/08/98 07/09/98 14/09/98 21/09/98 28/09/98 05/10/98 12/10/98 19/10/98 26/10/98 02/11/98 09/11/98
date
0
0,5
1
1,5
2
2,5
3
Rain
Garonne
SFD (dm3.dm-2.h-1)
Sap Wood Hydration (relative mV)
0
0,5
1
1,5
2
2,5
10/08/98 17/08/98 24/08/98 31/08/98 07/09/98 14/09/98 21/09/98 28/09/98 05/10/98 12/10/98 19/10/98 26/10/98 02/11/98 09/11/98
-60
-50
-40
-30
-20
-10
SFD
Hydration
Figure 5. Comparison of the daily maximal sap flux density (SFD, in black) and the sapwood hydration index (minimum of night sap
flux density values, in grey) for the planted poplar, SF1, during the 1998 drought, with the corresponding river level (continuous line)
and daily rainfall (histogram). The horizontal dashed line illustrates the water height necessary for initiating back channel submersion.
The back channel is located in a small depression and when the river floods above a certain level (dashed line), this pool is swamped.
Figure 6. Comparison of the variation of the stem
width (upper curve in grey) with the sap flux den-
sity (SFD, lower curve in black) on the small pop-
lar, SF3, forthree consecutive days,28 to 30/09/99,
with the corresponding air humidity (in black) and
photosynthetic active radiation under the trees (in
grey).
and close to the river, displayed more similar profiles
(figure 7, second frame). To better understand the link
between the growth and the water availability, two
curves have been added to both frames. The first curve
reports the variation of the annual rainfall for 12 years,
with a low value of 705 ± 152 mm. The rain contribution
during the hotter and drier four months of the late vegeta-
tive season (July to October) is reported on the figure.
The best correlation coefficient is 0.25 between I45/51
growth and the July-October rainfall. In the second
frame, the Garonne River mean level has been drawn for
the two defined vegetative season parts, the first four
months with high water (March to June) and the follow-
ing four (July to October) with low water. The best
correlation coefficient is 0.25 for the link between the
Populus cv 2 growing and the July-October stream level.
The important water deficit for this last period during
1989 and 1990 was well synchronized with the low tree
growth along the Garonne River.
4. DISCUSSION
This study on riparian woody species shows that sap
flow was highly variable. At a given date it is determined
by intrinsic factors such as the species, age, size of the
Sap flow of poplar and willow 311
Figure 7. Dendrochronological test on poplars in the floodplain over the last 12years. The first frame shows thevariability of three trees
along a few hundred metres transect perpendicular to the river (Populus nigra, close to the river, Populus cv I45/51, middle position and
Populus cv robusta, the furthest). The solid curves report the cumulative year rainfall and July-October rainfall. The second frame sum-
marizes the growing similarity of three poplars along a kilometre transect along the Garonne River. The solid line indicates the mean
Garonne River level in March-June and July-October.
year ring growth (cm)year ring growth (cm)
cumulative rainfall (mm)Mean river level (cm)
0
0,5
1
1,5
2
2,5
3
1988 1989 1990 1991 1992 1993 1994 1995 1996 1997 1998 1999
0
200
400
600
800
1000
1200
Populus nigra (SF3)
Populus cv I45/51 (SF1)
Populus cv robusta
annual rainfall
July-October rainfall
0
0,5
1
1,5
2
2,5
3
1988 1989 1990 1991 1992 1993 1994 1995 1996 1997 1998 1999
year
0
30
60
90
120
150
180
Populus nigra
Populus cv 1
Populus cv 2
Mars-June river level
July-October river level
tree and by extrinsic factors related to the local climate
and environment (evapotranspiration, rainfall and air hu-
midity). Such results are consistent with observations
made by other authors in long-term research on non-ri-
parian trees [4, 14]. One single factor alone cannot ex-
plain the observed sap flow variation, however in
riparian environments the river and the related water ta-
ble determine the bulk of the water available in a location
independent of the localclimate. In other words, the river
flow often rules the sap flow amplitude, especially in a
drought period when the low river discharge becomes a
limiting factor. In other seasons, when river flow has no
real limitation on water, the river factor is less signifi-
cant. Similar observations were made on hardwood spe-
cies (e.g., oak and ash) in a Moravian floodplain [4].
Sap flux provides information on wood water con-
tent. However, in order to appreciate tree water con-
sumption and its contribution to the water balance, radial
variation of sap flow in the trunk is necessary. First, the
comparison of sap fluxes on riparian softwood trees from
different authors is not easy because measurements have
not been made in the same conditions and there is gener-
ally little additional information to facilitate thecompari-
sons (e.g., position of the tree in the floodplain or river
discharge). Moreover, the varieties of trees are generally
not the same and there are differences in local climate,
season and stand density (isolated trees, natural forest,
planted and pruned trees, polycormic trees and trees de-
veloped by lysimeter). Sap flow measurement techniques
are often also different. Nevertheless, in table II, existing
results on the water uptake by poplars and willows were
summarized. The sap flux density is probably the best
parameter to make comparisons, although there are both
diurnal and seasonal variations. Our results report a mean
high flow density of about 2.6 and 3.6 dm
3
dm
–2
h
–1
for
poplar and willow, respectively. These values agree well
with those obtained by other authors and using different
techniques (table II). Only two other trees have been re-
ported as displaying higher sap values [25]: Eucalyptus
grandis and Larix gmelinii, two species known for their
rapid growth. This means that our diffuse-ring riparian
trees display high sap density, but not at an exceptional
level. The total water uptake by a diffuse-ring tree de-
pends on the sapwood multi-ring system. The identifica-
tion of radial trends along these rings provides an insight
into physiological adaptations of wood water storage and
movement [20]. However, it is not easy to screen deeply
into the sapwood and most authors have stopped at 4 cm
[12, 20] or at 5 cm [11]. We have measured to 8 cm,
found high sap densities to 4 cm, a progressive decrease
at 6 cm and a higher decrease at 8 cm. For the water con-
sumption reported in table II, we have taken an active
sapwood of 6 cm for the poplars and 4.5 cm for the wil-
low. Our results are consistent with those obtained from
measurements on the wood water content on diffuse-ring
trees (Liquidambar styraciflua, Populus deltoides cv
ANU 60/129 and Populus yunnanensis), where a de-
crease across the 8 cm conducting sapwood was ob-
served [20 and references within]. Also Granier et al.
[11] have found for beech, a another diffuse-ring tree
(Fagus sylvatica L.), a maximum sap flux between 0 and
2 cm and after a decrease up to 6 cm deep. In this study,
we showed that about half of the diameter of a tree may
be active, which means that for these fast growing pop-
lars, tree rings of the last 5–7 years remain conductive.
For the younger black poplar, the sapwood thickness was
less extended and included only the last 3–5 year rings.
312 L. Lambs and E. Muller
Table II. Some examples of maximal sap flow density measured for different trees.
Tree Sap flow
technique
Tree diameter
(cm)
Sap flow density
(dm
3
dm
–2
h
–1
)
Daily water uptake
(dm
3
day
–1
)
References
Populus x euramerica Lysimeter 14 3.41 86 Edwards 1986
Populus trichocarpa x deltoides Cermak sensor 15 Not given 51 Hinckley et al. 1994
Populus x eur. cv I45/51 Granier sensor 29 2.64 89 Present work
Populus nigra Granier sensor 22 2.68 45 Present work
Salix fragilis Cermak sensor 25 2.61 103 Cermak et al. 1984
Salix matsudana Lysimeter 12 5.14 48 Edwards 1986
Salix alba Granier sensor 15 3.59 42 Present work
Eucalyptus grandis other 18 5.44 94 Wullschleger et al. 1998
As seen from the tree trunk width, about half of the sap-
wood cross section is active (2 × 8 cm for 29 cm wide,
and 2 × 6 cm for 22 cm wide). The high sap flow repre-
sents around one third of the tree width (2 × 6 cm for 29
cm, and 2 × 4 cm for 22 cm). But seen from the surface,
the ratio between the sap wood area and the total cross
section of the trunk represents respectively 75% and
55% for total sapwood and sap wood with highsapflow.
However, the active sapwood depth may change
when the local hydrological constraints are modified.
Therefore, more long-term experiments are needed to
better understand the radial patterns of xylem sap flow in
diffuse-porous trees.
Long periods of sap flow measurements are very use-
ful for better understanding the evolution of the water
pool over the growing season. Some authors have re-
cently conducted such long-term research in boreal for-
ests, including research on pine and spruce in Europe [4]
and on the trembling aspen (P. tremuloides M.) in Can-
ada [14]. The results showed that, in each year, the sap
flow density evolution was different and the variability
of water fluxes at the tree level remained generally high.
For riparian woodlands there is often one additional
parameter. Because many managed rivers have experi-
enced vertical erosion (incision) in beds, the riverbanks
are more drained and the adjacent ground water tables are
now also deeper during summer drought. For example, in
this study the sap flux densities for the planted poplar
(I45/51) ranged from 2.2–2.6 dm
3
dm
–2
h
–1
(about
90 dm
3
day
–1
) in the wetter spring conditions and
dropped to 1.6–1.7 dm
3
dm
–2
h
–1
(about 60 dm
3
day
–1
)in
less favourable conditions. Under the worst conditions,
e.g., the especially long drought in the summer of 1998
(figure 5), these values dropped to 1.0–1.2 dm
3
dm
–2
h
–1
(about 40 dm
3
day
–1
), and even to 0.35 dm
3
dm
–2
h
–1
(about
12 dm
3
day
–1
) for a few days. This represent a decrease of
30, 50 and 85%, respectively, of the sap flux density dur-
ing the drought. Granier has also reported for oak a de-
crease up to 70% at the maximal drought intensity.
Low night and predawn sap flux values correspond to
the low sap flow rates that prevail during the overnight
rehydration of plant tissues. Therefore, night and pre-
dawn sap flux values could provide a good indication of
the plant deficits that accumulated during the previous
day [19, 20].
In the morning of a sunny day, water absorption lags
behind the transpiration rate. Internal water deficits de-
velop during this first phase and shrinkage processes oc-
cur, first at the leaves and then at the branches. The trunk
reservoir also loses its water and its diameter, as
measured by the microdendrometer, and slightly de-
creases (figure 6). When the transpiration declines with
solar radiation in the afternoon, absorption begins to ex-
ceed transpiration and the plant rehydrates. The process
is reversed and the trunk diameter slightly increases.
These internal water deficits are progressively cancelled
out during the night if there is a normal water supply in
the soil [1]. More information could be obtained by using
microdendrometers throughout the vegetative season.
The variation in stem width is not an indication of the xy-
lem sap transfer, but of the shrinkage of the soft tissues
due to root absorption lagging behind leaf evaporation.
Consequently, tensions develop in the xylem, water of
the nearby cells are attracted and the cells in the bark
shrink. These stem variations are counterbalanced a little
by the wood’s thermal expansion when the ambient tem-
perature increases [1].
Long-term dendrochronology and dendroclimatology
studies [22] showed correlations between the stream
flow and tree growth in a semi-desert riparian woodland.
In temperate conditions, trees display a more complex
and wide variation depending on the local soil moisture.
However, this study on trees growing in an area directly
influenced by the Garonne River level showed that there
was a quite homogenous growth tendency, partly corre-
lated with the late summer riverlevel(figure 7). This also
showed the importance of the minimal summer flow reg-
ulation of the Garonne River to maintain healthy riparian
vegetation for good water quality. Interpretations and
correlations are not easy to draw since it is difficult to
take into account the rapid river level on the long-term
growth of trees. Floods in summer are often very short
and, for the strongest, the microtopography can change
(deposit or digging of gravel or modification of the link
with the river), which could modify moisture conditions.
In New Zealand, rapidly growing poplars were used
for wood production and for the drying of isolated
wetlands. In a poplar-pasture system, evapotranspiration
of the poplar stand was 20–35% higher than that of the
open pasture, but the tree density was low [12].InFlorida
in a wide cypress-pine flatwoods, the water table rose
from 32–42 cm after the trees were removed [23]. The
water table was isolated and disconnected from any river
system. In riparian woodlands, large trees can uptake
100–150 L a day when the available water pool between
ground water and river water is enough to sustain the
trees, i.e., outside low water flow [17]. Watertaken up by
the trees is mainly evaporated, which positively influ-
ences the surrounding area due to oasis effects [18]. In
addition, the dew intercepted by the riparian trees is an
additional water input for the trees.
Sap flow of poplar and willow 313
5. CONCLUSION
This study is the first one using the Granier sap flow
technique to measure the water consumption of poplar,
and to a lesser extent willow, in an active floodplain. It
was difficult to obtain continuous long-term data follow-
ing problems with instrument damage during floods,
with humidity on electronic components and with the de-
struction of wire by rodents. The first results obtained
over a monitoring period of two years showed that sap
flows varied with both species and age. They also
showed that the high temporal variability of water con-
sumption and the multi-ring sap transfers are major char-
acteristics of poplars and willows and do not facilitate
simple statements on water uptake.
During periods of flood the evaporation process did
not stop, and sap fluxes could even be enhanced, whereas
during the summer drought, the sap fluxes were drasti-
cally reduced, certainly by stomatal closing. The black
poplar lost leaves that were probably in excess for the
available soil moisture and recovered new ones a few
weeks later when the available soil moisture increased.
Complementary long-term studies are clearly needed
to better understand the complex sap flow changes and to
be able to relate them to significant environmental fac-
tors, to leaf area and to physiological parameters such as
stomatal conductance and water potential. Comparison
of the same species at the same age between floodplains
under different climates and regimes would facilitate
such approach. One major difficulty comes from the fact
that it is not clear whether the contribution of the sap-
wood activity at different depths remain stable through-
out the season or, most probably, if it varies with climatic
and hydrologic constraints and how. Therefore the prior-
ity of future researches should be both long-term moni-
toring and simultaneous measurements of sap flows at
different depths. Such studies are prerequisites to the
modelling of water transfer and water balance in riparian
woodlands at the tree andat the stand scales. They should
be facilitated in the future using the newly manufactured
Granier sensors with 2 cm-long probes fixed at the ex-
tremity of needles of 2, 4, 6 and 8 cm.
Acknowledgements: We are grateful to André Granier,
INRA, Unité d’Écologie Forestière, Champenoux France,
for advice in using the sap sensors and for email assis-
tance during the experiment. Thanks are also expressed
to Thierry Ameglio, INRA, Clermont-Ferrand, France,
for information on the link between sap flow and the mi-
cro-variation of trunk diameter and to Rosa Richards,
University of Cambridge, UK, for her contribution to the
dendrochronologic measurements. We also thank the
two anonymous referees for their helpful comments and
suggestions. This study was funded by the European
Commission, contracts No. ENV4-CY96-0317 and
EVK1-1999-000154.
REFERENCES
[1] Ameglio T., Cruiziat P., Daily variations of stem and
branch diameter: short overview from a developed example.
NATO ASI series, Vol. H64. Mechanics of swelling: from clays
to living cells and tissues, edited by T. Karalis, Springer-Verlag
Berlin Heidelberg, 1992, pp. 193–204.
[2] Cermak J., Deml M., Penka, A new method of sap flow
rate determination in trees, Biol. Plant 15 (1973) 171–178.
[3] Cermak J., Jenik J., Kudera, J., Zidek V., Xylem water in
a crak willow (Salix fragilis L.) in relation to diurnal changes of
environment, Oecologia 64 (1984) 145–151.
[4] Cermak J., Prax A., Waterbalance of a southernMoravian
floodplain forest under natural and modified soil water regimes
and itsecological consequences, Ann.For. Sci. 58(2001) 15–29.
[5] Cienciala E., Kucera J., Lindroth,A., Long-term measure-
ments of stand water uptake in Swedish boreal forest, Agric. Fo-
rest Meteorol. 98–99 (1999) 547–554.
[6] Clark S., A new method of examining cottonwood cores,
Proc. of the Int. Symp. on Ecological Aspects of Tree Ring Ana-
lysis, 1987, pp. 695–698.
[7] Dawson T.E., Ehleringer J.R., Streamside trees that do
not use stream water, Nature 350 (1991) 335–337.
[8] Edwards W.R.N., Precision weighing lysimetry for trees
using a simplified tared-balance design, Tree Physiol. 1 (1986)
127–144.
[9] Granier A., A new method to measure the raw sap flux in
the trunk of trees, Ann. Sci. For. 42 (1985) 193–200.
[10] Granier A., Biron P., Breda N., Pontallier J Y., Saugier
B., Transpiration of trees and forest stands: short and long-term
monitoring using sapflow methods, Glob. Change Biol. 2 (1996)
265–274.
[11] Granier A., Biron P., Lemoine D., Water balance, trans-
piration and canopy conductance in two beech stands, Agric. Fo-
rest Meteorol. 100 (2000) 291–308.
[12] Guevara-Escobar A., Edwards W.R.N., Morton R.H.,
Kemp P.D., Mackay A.D., Tree water use and rainfall partitio-
ning in a mature poplar-pasture system, Tree Physiol. (2000)
97–106.
[13] Hinckley T.M., Brooks J.R., Cermak J., Ceulemans R.,
Kucera J., Meinzer F.C., Roberts D.A, Water flux in a hybrid po-
plar stand, Tree Physiol. 14 (1994) 1005–1018.
314 L. Lambs and E. Muller
[14] Hogg E.H., Hurdle P.A., Sap flow in trembling aspen:
implication for stomatal responses to vapor pressure deficit, Tree
Physiol. 17 (1997) 501–509.
[15] Hübert B., Schmidt E., Eine Kompensations Methode
zur thermoelektrischen Messung langsamer Stafströme, Bericht
der Deutschen Botanischen Gesellschaft 55 (1937) 514–529.
[16] Lambs L., Correlation of conductivity and stable isotope
18
O for the assessment of water origin in river system, Chem.
Geol. 164 (2000) 161–170.
[17] Le Maitre D.C., Scott D.F., Colvin C., A review of infor-
mation on interaction between vegetation and groundwater, S.A.
Water 25 (1999) 137–152.
[18] Malanson G.P., Riparian Landscapes, Cambridge study
in Ecology, Cambridge University Press, UK, 1993, 296 p.
[19] Nadezhdina N., Sap flow index as an indicator of plant
water status, Tree Physiol. 19 (1999) 885–891.
[20] Phillips N., Oren R., Zimmerman R., Radial patterns of
xylem sap flow in non-, diffuse- and ring-porous tree species,
Plant Cell Environ. 19 (1996) 983–990.
[21] Pontailler J Y.,A cheap quantum sensor usinga gallium
arsenide photodiode, Functional Ecology 4 (1990) 591–596.
[22] Stromberg J.C., Patten D.T., Riparian vegetation ins-
tream flow requirements: a case study from diverted stream in
the eastern Sierra Nevada, California, USA, Environ. Manage.
14 (1990) 185–194.
[23] Sun G., Riekerk H., Kornhak L.V., Ground-water-table
rise after forest harvesting on cypress-pine flatwoods in Florida,
Wetlands 20 (2000) 101–112.
[24] Tabacchi E., Lambs L., Guilloy H., Planty-Tabacchi
A.M., Muller E.H., Décamps H., Impact of Riparian vegetation
on hydrological processes, Hydrol. Process. Special Issues 14
(2000) 2959–2976.
[25] Wullschleger S.D., Meinzer F.C, Vertessy R.A., A re-
view of whole-plant water use studies in trees, Tree Physiol. 18
(1998) 449–512.
[26] Wullschleger S.D., King A.W., Radial variation in sap
velocity as a function of stem diameter and sapwood thickness in
yellow-poplar trees, Tree Physiol. 20 (2000) 511–518.
To access this journal online:
www.edpsciences.org
Sap flow of poplar and willow 315