Báo cáo khoa học: "A high density genetic map of maritime pine based on AFLPs" pps
Bạn đang xem bản rút gọn của tài liệu. Xem và tải ngay bản đầy đủ của tài liệu tại đây (311.31 KB, 10 trang )
D. Chagné et al.An AFLP map of maritime pine
Original article
A high density genetic map of maritime pine based on AFLPs
David Chagné
a
, Céline Lalanne
a
, Delphine Madur
a
, Satish Kumar
b
, Jean-Marc Frigério
a
,
Catherine Krier
a
, Stéphane Decroocq
a
, Arnould Savouré
c
, Magida Bou-Dagher-Kharrat
c
,
Evangelista Bertocchi
a
, Jean Brach
a
and Christophe Plomion
a*
a
INRA, Équipe de Génétique et Amélioration des Arbres Forestiers, 69 route d’Arcachon, 33612 Cestas Cedex, France
b
Forest Research, Applications of Genomic Science, Sala Street, Rotorua, 3021, New Zealand
c
Physiologie Cellulaire et Moléculaire des Plantes, UMR 7632 CNRS, Université Pierre et Marie Curie, case 156,
4 Place Jussieu, 75252 Paris Cedex 05, France
(Received 16 August 2001; accepted 13 February 2002)
Abstract – We constructed a high-density linkage map of maritime pine (Pinus pinaster Ait.) based on AFLP (Amplified Fragment Length Po-
lymorphism) markers using a three-generation outbred pedigree. In a first step, male and female maps were established independently with
test-cross markers segregating 1:1(presence:absence of the amplified fragment in the full-sib progeny). In a second step, both maps were merged
using intercross markers segregating 3:1 in the progeny. A combination of MAPMAKER and JOINMAP softwares was used for the mapping
process. A consensus map was obtained and is available at URL It covers
1441 cM and comprises a total of 620 AFLP markers on 12 linkage groups. The physical size of the maritime pine genome (51.5 pg/2C) was
measured by flow cytometry, providing a physical/genetic size ratio of 13.78 Mb/cM. This map will be used to dissect the genetic architecture
of economically (growth, wood quality) and ecologically (water-use efficiency) important traits into mendelian inherited components
(QTLs: Quantitative Trait Loci). It will also provide a framework to localize more informative markers (ESTs: Expressed Sequence Tags) to be
used as candidate genes in QTL detection experiments. The location of orthologous markers (ESTs and SSRs: Simple Sequence Repeats) will
also allow the study of the genome structure of closely related conifer species using a comparative genome mapping approach.
Pinus pinaster / genetic linkage map / AFLP / double pseudo-testcross / physical size
Résumé – Établissement d’une carte génétique à haute densité du pin maritime à partir de marqueurs AFLP. Nous avons construit une
carte génétique du pin maritime (Pinus pinaster Ait.) en génotypant une famille de plein-frères appartenant à la troisième génération du pro
-
gramme d’amélioration, avec des marqueurs AFLP. Dans un premier temps, les cartes des parents mâle et femelle ont été établies indépendam
-
ment avec des marqueurs de type « test-cross » ségréguant dans les proportions 1:1 (présence:absence du fragment amplifié dans la famille de
plein-frères). Dans un second temps ces deux cartes ont été fusionnées à l’aide de marqueurs de type « intercross », ségréguant dans les propor
-
tions 3:1. La construction des cartes a été réalisée à l’aide des logiciels de cartographie génétique JOINMAP et MAPMAKER. Une carte géné
-
tique consensus des deux parents comprenant 12 groupes de liaison a finalement été obtenue et est accessible à l’URL suivante :
Elle couvre 1441 cM et comprend 620 marqueurs. Par ailleurs, la taille physique
du génome du pin maritime a été estimée par cytométrie de flux à 51.5 pg/2C, donnant un rapport taille physique/taille génétique de 13.78
Mb/cM. Cette carte sera maintenant utilisée pour étudier l’architecture génétique de caractères d’intérêt économique (croissance, qualité du
bois) et écologique (efficience d’utilisation de l’eau). Il s’agira de localiser les zones du génome (QTL, Quantitative Trait Loci) impliquées dans
le contrôle génétique de ces caractères complexes. La carte génétique fournira aussi un support pour localiser d’autres types de marqueurs, tels
que des gènes (EST, Expressed Sequence Tags) qui seront utilisés comme marqueurs candidats pouvant correspondre aux QTL. La localisation
de marqueurs orthologues (EST et SSR, Simple Sequence Repeats) permettra d’étudier en outre la structure du génome des conifères en utilisant
une approche par cartographie comparée.
pin maritime / carte génétique / AFLP / double pseudo-testcross / taille physique
Ann. For. Sci. 59 (2002) 627–636
627
© INRA, EDP Sciences, 2002
DOI: 10.1051/forest:2002048
* Correspondence and reprints
Tel.: +33 5 57 12 28 38; fax: +33 5 57 12 28 81; e-mail:
1. INTRODUCTION
Maritime pine (Pinus pinaster Ait.) is the most economi
-
cally and ecologically important conifer species in the
southwestern Europe, where it covers about 4 millions hect
-
ares. In France, INRA (Institut National de la Recherche
Agronomique) started a breeding programme of maritime
pine in the early sixties to provide foresters with improved
varieties for growth and straightness. This program has now
reached its third generation. Although positive genetic gains
are obtained through classical breeding strategies [5], there is
a great need to improve selection efficiency. Indeed, forest
tree selection faces three major stumbling blocks: (i) late se
-
lection age (12 years of age for maritime pine, [32]), (ii) com
-
plex traits with low to medium heritabilities [17, 31, 48], (iii)
and late flowering (8 years of age for maritime pine). The de
-
velopment of molecular marker techniques provides new
tools to detect the genomic regions involved in the genetic
control of quantitative traits (QTLs, Quantitative Trait Loci,
[59]), which, in turn, will improve selection efficiency and
will increase genetic gains per unit of time. A prerequisite of
this strategy is the availability of a saturated genetic linkage
map for the studied species.
Previous reviews have described the specificity of the
different mapping strategies used in forest trees [14, 42]. A
comprehensive review of inheritance and mapping studies in
conifers, indicating the type of pedigree and marker techniques
used, is also available at: http: //www.pierroton.inra.fr/genet-
ics/labo/mapreview.html. Chronologically, inheritance and
mapping studies were performed using the mega-
gametophyte, a nutritive haploid tissue surrounding the em-
bryo of gymnosperm seeds and corresponding to the female
inheritance transmitted to the embryo [63]. Markers used by
the forest tree geneticists in the 70’s and 80’s were isozymes
[1]. However, a large proportion of the genome could not be
covered by a too few number of loci. The use of this haploid
tissue climaxed in the mid-90’s, when randomly amplified
polymorphic DNA (RAPD, [68]) became the most popular
marker technique to produce genetic maps for plant species.
In particular, the haploid megagametophyte of conifer seeds
avoided the drawback of the dominant nature of RAPDs. The
“megagametophyte-RAPD” strategy was used in several co
-
nifer species, including P. pinaster [44], from which the first
conifer saturated map was published. In the late 90’s, RAPDs
were progressively abandoned with the availability of a more
reliable technique: Amplified Fragment Length Polymor
-
phism (AFLP, [66]), which was used in several conifer spe
-
cies such as pinyon pine [62], loblolly pine [51] and maritime
pine [18, 53]. Although very popular in the forest geneticist
community, the megagametophyte approach faces two major
limitations. First, it requires the development of specific pop
-
ulations and is not applicable to QTL analysis for mature
traits in existing plantations. Indeed, the megagametophyte is
a temporary tissue that can only be collected from the seed
-
ling stage during the germination of the embryo. Therefore,
the dissection of the genetic architecture of adult trait would
require several years to start. In addition, only the maternal
effect of QTL can be estimated [45, 46]. Second, the haploid
progeny cannot be considered as a “perpetual” mapping pop
-
ulation, because of the relatively low amount of DNA that
can be extracted from this tissue. Consequently, it will pre
-
vent a high number of markers, as well as markers requiring a
high amount of DNA such as RFLPs (Restriction Fragment
Length Polymorphisms, [8]), from being mapped over time.
Conversely, adult trees can be grafted and propagated by
cuttings, and diploid progenies can constitute “perpetual”
population, analogous to Recombinant Inbred Lines in crop
plants. Carlson et al. [11] were the first to show that RAPD
primers could be screened for informative markers segregat
-
ing in a 1:1 ratio in diploid tissue of full-sib progenies. This
idea was extended by Grattapaglia and Sederoff [24] to con
-
struct parental maps of an interspecific eucalyptus hybrid
family, in a mapping strategy named “two-way pseudo-
testcross”. It was further used in conifers [3, 33] with RAPDs
and AFLPs.
Although dominant biallelic markers (RAPD and AFLP)
continue to be the most easy-to-use technique, they present
major limitation since they cannot capture the multiallelic na-
ture of QTLs. Alternatively, other research groups started to
use codominant markers such as RFLPs [10, 19, 54],
PCR-RFLP [26], ESTs (Expressed Sequence Tags) [12, 47,
61] and more recently SSRs (Simple Sequence Repeats) [19,
22, 43], allowing gene action to be precisely defined (estima-
tion of additive and dominant effects of QTLs, [55]) and pro-
viding anchor points in comparative mapping experiments
[39].
This brief review of the history of molecular marker devel-
opment can give us insights on how to proceed in the devel
-
opment of a molecular genetics project in maritime pine. In a
first step we identified a three-generation outbred pedigree
comprising 202 individuals and segregating for traits of inter
-
est. Second, we quickly established a fully saturated map
based on AFLP markers. Third, we are now mapping QTL for
traits of interest and developing SSRs and ESTPs (EST
Polymorphisms) to provide more informative markers which
should be easily transferred to other pedigrees of maritime
pine and other pine species, with the main objective of QTL
validation [39]. The main goal of this paper is to present a sat
-
urated map of maritime pine which corresponds to the second
step of this strategy.
2. MATERIALS AND METHODS
2.1. Mapping population
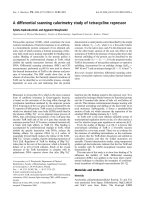
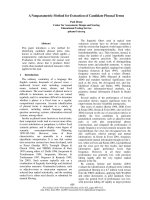
A three-generation outbred pedigree (9.103.3 × 10.159.3) was
used to construct the genetic map (figure 1). The two parental trees
were mated in 1980 and seeds from the controlled cross were sown
in spring 1982. They produced 202 progeny seedlings that were
628 D. Chagné et al.
planted in autumn 1982. The four grand parents were “plus trees”
phenotypically selected for stem growth and straightness in the local
provenance of the Landes de Gascogne, and grafted in clonal or
-
chards. These grand parents were tested in a polycross progeny test
and classified according to their breeding value as Vigor “+” (for
vigorous trees) and Vigor “–” (for less vigorous trees). The progeny
was located in Malente (Gironde, France) on a semi-humid podzolic
soil. Spacing was 4 m between rows and 1.1 m between individual
trees, i.e. 2 272 trees ha
–1
. This full-sib family belongs to a progeny
test of the third generation breeding population.
2.2. AFLP assay and gel electrophoresis
Genomic DNA was extracted as described by Doyle and Doyle
[21]. AFLP markers were obtained following the protocol of Costa
et al. [18] with slight modifications: the EcoRI primers used for se
-
lective amplification were radio labelled for 1.0 h at 37
o
Cin
1 × OPA buffer (Pharmacia), 9.5 U of T4 kinase (Pharmacia),
100 µM of primer and 10 µCi of γ
33
P-ATP. The reaction was stopped
by incubating the reaction mix for 10 min at 80
o
C. After selective
amplification, 4 µl of denaturated template was loaded, after one
hour of pre-run, on to 52 cm gels composed of 4% 19:1 acrylamide:
bis-acrylamide, 7 M urea and 1 × TBE. The run was performed at
80 W for 150 min or more, depending on the primer combination.
The gel was fixed after running in 10% acetic acid for 20 min, rinsed
in distilled water and dried overnight at 50
o
C. Finally, gels were ex
-
posed on Konica AX autoradiographic film for about 8 days.
Fifty-two primer-enzyme combinations (PEC, see table I) were
chosen on the basis of their repeatability, pattern (i.e. ease of scor
-
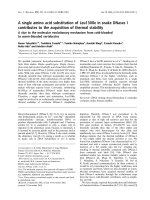
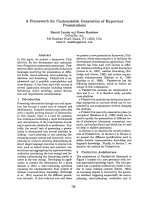
ing) and level of polymorphism. Presence or absence of AFLP frag
-
ments was directly scored on the gel image (figure 2).
Polymorphic AFLP fragments were named considering (1) the
PEC used; (2) the fragment length, and (3) the quality of the scoring:
“a” for intense bands, “b” for weak bands, and “c” for the bands that
were difficult to score. A table of correspondence between the locus
ID and the PEC used is available online at URL:
/>2.3. Mapping procedure
We used the two-way pseudo-test cross mapping strategy to con-
struct the linkage maps [24]. Markers were subdivided into two
groups considering their segregation patterns. The first group com-
prised markers in the testcross configuration between the parents
(heterozygous in one parent and homozygous null in the other),
which presented a 1:1 segregation ratio in the progeny. The second
group concerned markers heterozygous in both parents, and there-
fore segregating in a 3:1 ratio in the progeny. Mendelian segregation
of the markers was tested by chi-square tests (P > 0.01). The few dis-
torted 1:1 and 3:1 markers were discarded from further analysis.
They generally belonged to the “c” quality score category.
Because of the low information content between pairs of markers
segregating in the 1:1 and 3:1 configuration [52], a preliminary
grouping of the 1:1 markers only was performed for each parent us
-
ing MAPMAKER software [34] with a LOD threshold of 6. Our ob
-
jective was to construct precise parental maps with 1:1 markers to
compare with the results obtained later with JOINMAP. The two pa
-
rental maps based on 1:1 and 3:1 markers were built using
JOINMAP v1.4 software [57] with a minimum LOD of 3 used as
grouping criterion and then aligned based on 3:1 markers. Whenever
the ordering of 3:1 markers was disturbed, the corresponding mark
-
ers were discarded until a good ordering was obtained. A consensus
map was finally built using all 1:1 and selected 3:1 markers using
JOINMAP. Linkage groups were drawn using MAPCHART [65].
Recombination rates were converted to map distances in
centiMorgans (cM) using the Kosambi mapping function.
2.4. Physical size measurement
DNA content of embryos or megagametophytes was assessed by
flow cytometry. Ten seeds were first imbibed overnight and then
dissected to separate the megagametophyte from the embryo.
Triticum aestivum (2C = 30.9 pg, [35]) was used as an internal
standard. Pinus tissues and hexaploid wheat leaf were chopped to
-
gether with a razor blade in Galbraith buffer [23] slightly modified
by the addition of 10 mM metabisulfite, 1% (w/v), Triton X-100 and
An AFLP map of maritime pine
629
Plus tree
Second
generation
Third
generation
9.103.3
10.159.3
V+
V+
V–
V–
202 progeny
Accessions
0159
3115
0601
5101
Figure 1. Mapping pedigree: 202 full-sibs belonging to the third gen
-
eration of the maritime pine breeding programme (V+: vigorous trees,
V–: less vigorous trees).
Progeny
1 2
a
b
c
Figure 2. Example of AFLP profile showing the three types of segre
-
gation. Lanes 1 and 2 correspond to the parents (female and male) and
other lanes correspond to the full-sib progeny. (A) Inter-cross marker,
heterozygous in both parents and segregating 3:1 in the progeny; (B)
Test-cross marker, heterozygous in the male and absent in the female,
and segregating 1:1 in the progeny; (C) Test-cross marker, heterozy
-
gous in the female and absent in the male, and segregating 1:1 in the
progeny.
1% (w/v) polyethylene glycol (PEG) 8000. After addition of 5 units
mL
–1
RNase A (Roche, France) and 50 µgmL
–1
propidium iodide
(Sigma-Aldrich, France), nuclei were filtered through a 75 µmny
-
lon filter in order to eliminate cell debris. Samples were left 30 min
on ice before measurements.
Assuming a linear relationship between fluorescence ratio and
amount of DNA, total 2C DNA content was evaluated using the leaf
2C DNA value of hexaploid wheat. For each sample, measurements
were made on 2 500 nuclei with duplication. Fluorescence analysis
of the stained nuclei was performed on an Epics V cytometer
(Beckman-Coulter, Roissy, France) with an argon laser at 488 nm
for propidium iodide. The cytometer linearity was checked and ad
-
justed before each set of run.
3. RESULTS AND DISCUSSION
3.1. AFLP markers
The 52 PECs used in this study provided 766 non-distorted
AFLP markers. The number of polymorphic fragments
ranged from 8 to 29 with an average of 15 polymorphic mark
-
ers per combination. 253 (33%) markers segregated in the 3:1
ratio and 513 (66%) in the 1:1 ratio. A total of 251 (32.8%) of
these 513 markers were heterozygous for the male parent and
262 (34.2%) for the female parent.
In a short time, and for a rather low cost, the AFLP method
provided a sufficient amount of polymorphic markers to satu-
rate the genome of maritime pine. In spite of its large genome
size, the use of appropriate PECs allowed the production of
easy-to-score AFLP gels. The use of Pst-Mse PECs has been
reported to provide less complex gel patterns but also yields
non-randomly distributed markers in conifers [43]. PstIis
sensitive to methylation and the use of this endonuclease may
target low-copy clustered regions. To avoid this problem and
ensure full genome coverage, we used Eco – Mse PECs. By
using two selective nucleotides in the pre-amplification step
(EcoRI+2,MseI + 2), and three to four nucleotides in the se
-
lective amplification step (EcoRI+3/+4MseI + 4), we could
circumvent the complexity of the pine genome to produce
clear AFLP patterns [15, 25].
Remington et al. [51] reported a significant effect of the
composition of the selective extensions. They showed that
the amount of CpG was negatively correlated with the num
-
ber of polymorphic fragments. In this study, although a slight
decrease was also observed, an analysis of variance (not
shown) test showed that there were no significant relation
-
ship between the number of polymorphic bands and the CpG
content in both EcoRI and MseI primers (P-value = 0.21).
3.2. Linkage map
Some polymorphic markers were discarded from the link
-
age analysis because they were distorted (P < 0.01). It should
be noticed that the observed level of distorsion was not
significantly greater than that expected by chance alone. In
630
D. Chagné et al.
Table I. List of AFLP primer pairs used to construct the maritime
pine genetic map and number of polymorphic fragments.
PEC Number of
amplified
fragments
Number of
markers se
-
gregating 1:1
(1)
Number of
markers se
-
gregating 3:1
(2)
Total
(1)+(2)
1 E+ACA/M+CCAG 140 10 7 17
2 E+ACA/M+CCGA 130 9 7 16
3 E+ACG/M+CCGC 108 8 1 9
4 E+ACG/M+CCAG 60 9 5 14
5 E+ACG/M+CCGT 95 10 1 11
6 E+ACG/M+CCTA 56 4 4 8
7 E+ACG/M+CCCA 112 5 3 8
8 E+ACG/M+CCAA 118 12 1 13
9 E+ACG/M+CCTG 62 26 3 29
10 E+ACC/M+CCAG 140 13 5 18
11 E+ACC/M+CCTG 126 9 5 14
12 E+ACC/M+CCGT 70 7 1 8
13 E+ACC/M+CCTA 145 10 4 14
14 E+ACC/M+CCGA 110 8 2 10
15 E+ACT/M+CCGC 130 9 2 11
16 E+ACT/M+CCAG 110 11 1 12
17 E+ACT/M+CCTG 120 14 7 21
18 E+ACT/M+CCGT 130 7 5 12
19 E+ACT/M+CCCA 136 4 4 8
20 E+ACT/M+CCTA 105 9 6 15
21 E+ACAA/M+CCTA 95 6 9 15
22 E+ACAA/M+CCAC 100 6 5 11
23 E+ACAA/M+CCGC 140 9 3 12
24 E+ACAA/M+CCCA 140 12 5 17
25 E+ACAA/M+CCGA 110 4 5 9
26 E+ACAA/M+CCTT 136 17 4 21
27 E+ACAA/M+CCTG 70 9 4 13
28 E+ACAA/M+CCAG 75 10 4 14
29 E+ACAA/M+CCAT 110 12 4 16
30 E+ACAC/M+CCAA 100 9 2 11
31 E+ACAC/M+CCAT 130 16 10 26
32 E+ACAC/M+CCTA 100 7 2 9
33 E+ACAC/M+CCTT 100 12 8 20
34 E+ACAC/M+CCTC 90 9 3 12
35 E+ACAC/M+CCAG 123 9 3 12
36 E+ACAC/M+CCAC 100 13 4 17
37 E+ACAG/M+CCTG 114 15 4 19
38 E+ACAG/M+CCTA 107 9 3 12
39 E+ACAG/M+CCAT 104 18 9 27
40 E+ACAG/M+CCAA 99 14 3 17
41 E+ACAG/M+CCGA 120 6 6 12
42 E+ACAG/M+CCTC 110 5 7 12
43 E+ACAG/M+CCGT 130 3 6 9
44 E+ACAG/M+CCGC 145 9 5 14
45 E+ACAT/M+CCAG 115 10 7 17
46 E+ACAT/M+CCTA 110 15 9 24
47 E+ACAT/M+CCAT 132 7 6 13
48 E+ACAT/M+CCTC 143 20 9 29
49 E+ACAT/M+CCTG 105 2 6 8
50 E+ACAT/M+CCAC 138 13 9 22
51 E+ACAT/M+CCCA 145 6 8 14
52 E+ACAT/M+CCGA 115 7 7 14
TOTAL 5854 513 253 766
respect to the 3:1 markers, only a subset (42%) that showed
the same order in the parental maps were kept. Six hundred
and twenty markers were finally used to construct the consen
-
sus linkage map (figure 3). The map consisted of 12 linkage
groups, corresponding to the 12 haploid chromosomes of
P. pinaster.
The total lengths obtained for the female, the male and the
consensus maps using JOINMAP and MAPMAKER soft
-
wares are presented in table II. The total genetic length calcu
-
lated using MAPMAKER software on the female map
(1 807 cM) is not significantly different from those described
by Plomion et al. [44] and Costa et al. [18] on the same spe
-
cies (1 860 cM and 1 873 cM, respectively). On the other
hand, the comparison between the total genetic lengths ob
-
tained with JOINMAP or MAPMAKER are different, even if
the same mapping function (Kosambi) was used in both soft
-
ware. Qi et al. [49] in barley and Sewell et al. [54] in loblolly
pine reported the same phenomenon, which can be attributed
to how the software packages calculate the genetic distances:
in any case the assumed level of interference differs slightly
from the true interference.
3.3. Physical versus genetic size
Improvements of the extraction buffer allowed analysis of
fair quality with a highly reproducible fluorescence index
(2C
Pinus
/2C
standard
). Analysis of P. pinaster embryo tissues
yielded DNA histograms with coefficients of variation in the
2C peaks ranging from 2 to 4%. Hexaploid wheat was used as
an internal standard because its genome size is relatively high
and thus more convenient in the assessment of large genome.
The mean DNA value (2C) for P. pinaster was 51.49 ± 0.51 pg.
The ratio between the fluorescence peak of nuclei isolated
from the diploid P. pinaster embryos and the corresponding
megagametophyte haploid tissue was equal to 1.92.
The Pinaceae presents the widest range and diversity of
DNA contents in all gymnosperm families [30, 37, 40, 41].
P. pinaster, with a 2C DNA value of 51.49 pg/2C (25.7 × 10
9
base pair per 1C) is close to most of the Pinus species. The
highest DNA reported in Pinus genus and also in gymno
-
sperm is 63.5 pg/2C in Pinus lambertiana [37]. For the mo
-
ment, it is not clear if the large diversity of the Pinus genome
sizes procures an advantage to environmental conditions as
hypothesised by Wakamiya et al. [67].
Table III compares the genetic and physical size of mari-
time pine and several other plant genome, including forest
trees belonging to angiosperms (oak [6], poplar [16], euca-
lyptus [36]) and gymnosperms (Loblolly pine [54]). The two
pine species show higher physical lengths compared to the
other species, which translates into a much larger physi
cal/genetic size ratio (e.g.: 13.78 Mbp/cM in P. pinaster
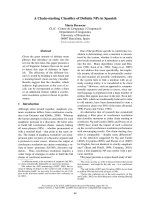
versus 0.22 Mbp/cM in Arabidopsis thaliana). Figure 4 shows
the relationship between the number of crossing-over and the
mean physical size of a chromosome. The number of cross-
ing-over is highly negatively correlated with chromosome
size (R = –0.88, P<0.01). As the number of crossing-over
occurring during the meiosis does not differ strongly between
An AFLP map of maritime pine 631
Table II. Total genetic lengths and number of linkage group (LG) ob
-
tained for female, male and consensus maps using two different map
-
ping softwares.
JOINMAP MAPMAKER
Female 1218 cM (12 LG) 1807 cM (12 LG)
Male 1297 cM (15 LG) 1541 cM (16 LG)
Consensus 1407 cM (12 LG) –
Table III. Genome characteristics of 15 plant species.
Species Physical size
(Mb)
Genetic length (cM)
(MAPMAKER estimates)
Chromosome
number
Mean genetic size per
chromosome (cM)
Physical/genetic size ratio
(Mb/cM)
1 Arabidopsis thaliana 150
[4]
675
[50]
5 135 0.22
2 Prunus persica 300
[4]
712
[20]
8 90 0.42
3 Oryza sativa 450
[4]
1490
[2]
12 125 0.3
4 Populus deltoides 550
[4]
2300
[16]
19 121 0.23
5 Eucalyptus grandis 600
[4]
1370
[64]
11 125 0.43
6 Brassica rapa 650
[4]
1850
[56]
10 185 0.35
7 Quercus robur 900
[4]
1200
[6]
12 100 0.75
8 Lycopersicon esculentum 980
[4]
1280
[57]
12 107 0.76
9 Solanum tuberosum 1540
[4]
1120
[58]
12 93 1.37
10 Zea mays 2500
[4]
1860
[13]
10 186 1.34
11 Lactuca sativa 2730
[4]
1950
[27]
9 217 1.4
12 Triticum tauschii 4200
[7]
1330
[38]
7 190 3.15
13 Hordeum vulgare 5500
[7]
1250
[29]
7 178 4.4
14 Pinus taeda 21000
[4]
1700
[19]
12 141 12.35
15 Pinus pinaster 25700
[4]
1850
[18]
12 154 13.78
632 D. Chagné et al.
A64–326
0.0
A201–463
5.0
A124–386
6.3
A98–349
A48–299
7.1
A155–417
7.5
A126–388
7.9
A53–304
8.6
A180–442
17.0
A194–445
17.1
A8–270
18.1
A533–543
22.9
A54–305
23.2
232
24.5
A143–405
25.1
A531–541
26.5
A53–315
27.9
A215–466
28.6
A198–460
29.8
A162–413
46.6
A25–276
47.3
A208–459
47.6
A51–313
48.5
A11–262
48.6
A88–339
49.4
A50–312
A227–478
50.8
164
51.8
151
51.9
157
52.6
A240–502
52.9
A217–479
53.5
A82–344
55.0
228
59.0
235
60.7
A33–295
66.7
58
67.2
A31–282
67.3
A123–385
70.3
26
71.1
A510–520
84.6
A15–266
85.1
A136–387
85.2
218
85.9
A119–370
86.4
A121–383
86.9
257
89.9
A6–257
93.9
A161–412
98.8
A156–407
102.1
75
103.8
A74–325
104.8
A30–292
106.4
207
108.2
A183–445
109.0
A154–416
111.1
A116–367
112.4
A115–366
113.4
A133–384
115.0
A106–357
117.3
A139–390
119.1
LG1
A56–307
0.0
A93–344
8.9
A181–432
13.4
A509–519
16.2
A104–355
16.5
A113–364
18.8
A170–421
25.8
A45–296
28.8
A92–354
30.7
230
31.9
A132–383
35.6
A23–274
40.1
A78–340
41.6
A85–347
42.1
90
46.7
A1–252
47.1
A27–289
48.3
A34–285
49.4
129
49.8
216
51.2
A103–354
52.5
217
54.0
A14–276
54.2
A96–347
54.6
A126–377
54.7
A8–259
55.5
A153–404
55.8
A13–264
56.1
A219–470
57.1
7
58.0
8
58.4
A187–449
60.7
A94–356
62.4
200
64.1
A144–406
68.2
A28–290
70.5
A38–300
72.6
A236–487
73.9
A117–379
76.3
A10–261
82.4
16
83.6
40
86.0
229
87.9
A219–481
88.0
A223–485
88.2
A123–374
90.5
A46–308
94.2
A132–394
95.7
220
95.8
A60–322
98.1
182
98.7
A101–363
99.5
A109–371
A32–283
99.8
A40–302
101.1
A165–427
101.7
161
104.9
A162–424
105.9
A215–477
A108–359
106.0
103
106.1
A186–437
107.4
A6–268
112.4
A246–508
119.4
A20–282
125.1
LG2
A147–398
0.0
A128–379
6.2
A211–462
10.0
A65–327
18.8
A193–444
22.8
A9–271
23.6
188
24.1
A127–389
24.9
69
26.4
139
26.7
A51–302
29.1
A178–429
29.6
138
33.4
A88–350
33.5
252
A157–408
36.5
A104–366
37.1
A157–419
38.2
A175–426
39.2
A25–287
41.2
183
41.5
93
43.4
A18–280
45.5
A97–348
48.6
A199–450
49.4
111
50.3
A87–349
51.5
A89–340
55.5
A62–313
57.8
A206–468
58.3
A532–542
58.6
A130–392
59.1
A216–467
63.9
A142–404
64.3
A166–417
68.8
A175–437
69.3
A178–440
70.1
A203–465
70.9
A14–265
71.8
A208–470
73.3
245
74.5
128
75.4
140
76.1
184
78.6
A110–372
79.7
A29–280
80.2
A236–498
85.6
31
92.0
A71–333
93.5
222
93.7
36
95.0
A139–401
96.0
A127–378
97.7
A144–395
101.0
A217–468
105.1
11
105.7
A234–496
107.1
A111–362
108.2
255
109.1
A204–466
A130–381
111.7
A220–471
113.6
A179–441
113.8
A146–408
114.7
A26–288
117.1
1
119.3
A31–293
122.4
LG3
18
0.0
233
4.0
A182–433
4.4
A43–294
12.1
A84–335
14.7
A179–430
23.5
213
24.7
A174–425
26.7
A1–263
28.5
A527–537
30.1
A69–331
31.2
A86–348
32.7
124
33.5
A171–433
33.7
27
34.0
A177–439
34.2
A218–480
35.8
A221–472
36.1
240
37.5
37
38.5
A69–320
38.6
203
40.6
A50–301
42.7
A52–314
46.7
242
49.3
A150–401
50.1
A182–444
52.2
A120–371
53.0
262
55.0
A172–423
58.3
A92–343
59.0
A4–266
59.5
A115–377
60.2
A67–329
61.6
A78–329
63.4
254
69.8
A100–362
70.6
A15–277
71.4
134
72.5
A169–420
72.7
179
73.2
A190–441
74.5
223
78.0
A140–391
78.1
A65–316
78.4
132
78.5
215
81.2
195
83.1
A45–307
84.8
227
88.3
A42–304
90.6
A242–504
93.5
83
93.9
152
97.7
20
101.8
A118–380
104.2
185
104.5
170
104.8
234
105.6
A112–374
107.9
A39–301
109.2
A59–321
115.5
A252–514
118.7
A525–535
122.0
169
126.9
LG4
A222–484
0.0
29
3.8
A34–296
4.5
A30–281
8.9
A196–458
9.1
A153–415
10.3
A129–380
10.5
A55–317
10.8
A84–346
11.1
187
15.6
A125–387
15.9
A203–454
19.3
A81–332
23.1
A17–279
25.1
110
26.4
A192–454
30.0
A120–382
32.4
A62–324
33.4
A116–378
34.6
A146–397
36.9
A250–501
45.4
A246–497
45.5
A245–507
46.5
A257–519
46.8
A196–447
47.7
181
49.0
A508–518
51.5
47
52.2
A185–436
53.7
A261–523
55.1
A210–472
55.9
142
A159–410
56.1
A142–393
59.8
A134–396
60.2
A202–464
61.7
A119–381
63.1
A35–297
65.1
A83–334
68.9
190
70.2
A225–487
74.0
A230–481
80.7
A237–499
83.6
A197–459
85.2
A241–503
88.1
A117–368
89.1
A528–538
91.1
106
94.2
A64–315
95.6
A77–339
97.4
A46–297
99.1
A183–434
99.8
46
100.5
A184–435
102.4
A141–392
102.5
A61–312
103.0
A59–310
103.5
A107–358
104.3
A73–324
106.2
253
107.5
A243–494
108.4
A152–414
109.2
A79–330
111.4
A145–407
113.6
A254–516
113.7
A189–440
113.9
A258–520
115.5
89
118.5
A101–352
120.3
A102–364
127.6
LG5
A95–357
0.0
A76–338
8.8
A81–343
10.4
A214–476
11.9
A505–515
15.5
A87–338
20.5
A52–303
21.1
204
24.3
84
27.6
A251–513
29.5
A41–292
31.6
A233–495
35.2
A158–409
35.4
244
37.9
A529–539
42.2
246
43.1
A171–422
45.8
A121–372
46.3
A166–428
47.7
A205–456
48.2
A18–269
49.5
A195–446
51.9
52
55.3
A187–438
A5–267
57.2
A67–318
59.2
A36–287
59.8
A96–358
60.3
A190–452
61.4
96
62.0
A168–419
62.6
48
63.0
A26–277
63.6
92
64.9
A70–321
72.8
165
74.0
102
74.2
A77–328
75.3
A193–455
78.6
A33–284
81.7
15
82.0
173
83.3
A44–306
85.1
A507–517
86.7
A224–486
87.4
126
87.7
A68–330
89.0
206
90.4
A165–416
91.7
A214–465
92.8
A149–411
107.4
A114–376
109.0
A3–265
110.0
A207–469
112.2
A131–382
114.3
A32–294
116.5
A125–376
117.6
A207–458
119.6
LG6
Figure 3. Consensus map based on 620 AFLP markers. Correspondence between marker ID and PEC is available at: />ble.html. Male and female maps are also available at the same URL.
An AFLP map of maritime pine 633
A163–425
0.0
144
4.8
A19–270
5.3
A149–400
7.0
64
9.2
A168–430
17.6
A122–384
18.5
A191–453
23.1
A63–314
23.2
A16–278
25.1
127
26.1
70
29.6
A133–395
31.1
A41–303
32.5
A97–359
34.2
261
34.6
150
36.8
243
39.3
A232–494
43.5
A57–308
44.0
A534–544
55.1
21
55.6
A181–443
57.4
A136–398
60.7
10
61.4
160
62.1
A186–448
62.8
A198–449
64.9
A22–284
68.9
A110–361
72.4
167
77.5
A148–410
80.8
A249–500
81.3
A106–368
82.8
A89–351
87.5
A57–319
90.2
A49–311
98.6
180
100.7
A63–325
104.2
A204–455
106.4
162
107.1
159
108.9
A140–402
110.4
205
110.7
A129–391
111.7
A134–385
113.2
A12–274
114.2
LG7
A48–310
0.0
A138–400
2.9
A2–264
4.3
53
4.7
91
5.9
A38–289
6.5
A188–450
13.6
A248–499
13.8
A114–365
14.3
A2–253
15.8
A102–353
15.9
87
16.3
A200–451
17.2
A94–345
23.8
109
25.3
A36–298
27.2
A212–463
28.6
50
28.7
116
30.3
211
32.7
A200–462
33.6
A105–356
35.1
A205–467
40.2
A76–327
44.8
A5–256
45.9
A71–322
A172–434
46.6
A138–389
47.6
A173–435
49.1
A156–418
50.7
A24–275
50.9
194
57.4
A7–269
58.6
3
58.7
118
60.1
A504–514
60.2
113
63.6
A58–320
64.1
A206–457
66.1
A216–478
67.4
214
68.6
A113–375
72.4
A11–273
80.5
A19–281
90.1
A137–399
92.5
A184–446
95.6
A169–431
103.8
A21–283
107.2
A91–353
110.8
A235–497
115.0
LG8
82
0.0
A213–464
1.3
A29–291
2.2
A68–319
3.5
107
4.4
A212–474
5.7
A530–540
5.9
A9–260
6.1
A58–309
8.2
A107–369
9.0
A218–469
9.7
A86–337
10.4
A177–428
11.0
A227–489
11.6
A85–336
12.5
105
14.1
A195–457
14.8
A228–490
16.9
88
17.2
A201–452
17.8
A255–517
20.8
A82–333
22.2
94
22.5
A173–424
25.0
193
26.0
A210–461
27.6
A176–438
30.8
A141–403
31.7
A194–456
35.5
A147–409
40.1
A17–268
41.0
A137–388
42.2
A56–318
44.2
A220–482
45.7
19
45.9
A143–394
46.1
163
55.2
156
56.5
81
56.6
A188–439
58.7
A167–418
59.8
A10–272
65.4
A249–511
71.2
LG9
A4–255
0.0
A66–317
2.2
A21–272
3.3
A60–311
4.2
A100–351
A118–369
4.4
A202–453
4.5
A16–267
8.4
38
9.8
A23–285
11.5
A167–429
18.2
A159–421
21.0
A124–375
24.4
166
32.0
A95–346
34.9
A213–475
36.4
133
40.7
186
42.9
147
45.3
146
47.6
A239–501
49.1
122
50.2
A105–367
50.8
A47–309
55.3
34
58.3
A503–513
62.7
A199–461
66.2
A180–431
66.8
A99–350
69.7
A151–413
70.0
A152–403
70.3
A90–341
73.1
A253–515
74.0
172
81.1
45
82.1
A98–360
86.4
A131–393
87.9
A148–399
89.4
A256–518
91.1
A154–405
91.4
155
97.4
137
97.5
A112–363
100.7
A22–273
103.0
A160–422
105.6
A103–365
105.8
154
117.9
A229–491
118.0
A108–370
119.9
23
122.4
LG10
A37–288
0.0
A40–291
4.4
A122–373
17.6
25
21.1
A160–411
28.8
A39–290
34.0
A28–279
35.1
130
46.0
A191–442
50.3
108
58.5
A506–516
60.3
43
61.8
A163–414
63.7
13
66.6
178
71.4
259
72.9
A176–427
74.8
256
80.3
A526–536
81.2
A512–522
81.4
219
86.5
A24–286
90.5
A111–373
94.3
A170–432
98.5
A54–316
102.3
A189–451
103.9
A37–299
122.3
A43–305
129.1
A128–390
132.6
A93–355
145.3
LG11
A211–473
0.0
54
3.1
A150–412
6.1
158
7.0
A79–341
10.2
236
11.6
67
13.1
A244–506
13.7
A174–436
14.6
115
15.6
148
21.3
208
22.7
A70–332
24.1
168
27.7
2
28.2
A83–345
31.6
A151–402
35.1
A197–448
A145–396
35.2
A61–323
38.6
A27–278
38.8
212
42.3
A91–342
43.9
A47–298
46.0
A155–406
47.1
A90–352
49.6
A164–415
51.1
A192–443
60.4
A209–460
62.2
A42–293
63.8
A185–447
65.2
A35–286
66.9
A161–423
67.0
A66–328
72.7
221
83.0
A7–258
86.1
136
86.3
41
90.9
A44–295
94.5
A262–524
95.6
80
101.5
LG12
Figure 3. Continued.
species (table III), species with small chromosomes will
present a larger amount of recombination per unit of physical
size.
4. PERSPECTIVES
The new maritime pine genetic map provides a very useful
tool for further genetic analysis. First, this map will serve as a
framework to locate comparative anchor tags for compara-
tive genomics. Although AFLP markers have been shown to
be poorly transferable between pine species, orthologous
markers such as RFLPs, ESTPs [61] or SSRs can be used as
anchor-points between the different maps already available
for conifer species. ESTs which have been mapped in Pinus
taeda [26, 61] and ESTs from P. pinaster cDNA libraries are
currently being located in the AFLP map of maritime pine as
part of the Conifer Comparative Genome Project (CCGP;
The aim
of CCGP is to compare conifer genetic maps with the P. taeda
reference map by providing orthologous markers. A hierar
-
chical approach based on different PCR-based methods is
used to detect polymorphism in ESTs: PCR fragment length
and conformation in denaturing or non-denaturing gel condi
-
tions (SSCP [47] and DGGE [60]) are first used because of
their low or medium cost and time efficiency. More powerful
methods such as point mutation detection by systematic se
-
quencing, or such as the prospecting of variation in the
non-coding regions flanking the ESTs [12], will also be used
to increase polymorphism rate.
As for the “intraspecific mapping comparison”, some of
the AFLP markers will be transferable between pedigrees
of maritime pine, but to compare maps constructed based on
different genetic backgrounds (e.g.: using experimental de
-
sign such as factorial and diallel), SSRs will be the marker of
choice. Their multiallelic nature will also allow tagging mul
-
tiple alleles at QTLs. Development of a battery of SSRs for
maritime pine is therefore a priority.
Secondly, genomic regions controlling adaptive and eco
-
nomically important traits are currently being studied in
maritime pine. These include QTLs for growth, wood quality,
end-uses properties and water use efficiency [9]. These stud
-
ies are based on a skeleton map based on evenly spaced AFLP
markers genotyped on the whole mapping pedigree (202
full-sibs; Pot, unpublished). The ESTs described in the previ
-
ous paragraph will also provide positional candidate genes,
i.e. whose position coincides with mapped QTLs. However,
because of the high physical/genetic size ratio in conifers, it
will be of great importance to find the actual genes underly
-
ing QTLs of interest, before any attempt of using this infor
-
mation in Marker-Assisted Breeding Program. The location
of candidate genes will also contribute to the establishment of
a “functional” genetic map.
In an integrative study, it will be essential to use the same
markers (ESTs) for comparative mapping and the candidate
gene approach, in order to validate the candidate gene-QTL
co-locations between phylogenetically related species [39].
Acknowledgements: The authors are grateful to the reviewers
for comments on the manuscript. This work was supported by fund
-
ing from the European Union (ANACONGEN, BI04-CT97-2125)
and the French Ministry of Research (BIOTECH, décision
n
o
98C0204).
REFERENCES
[1] Adams W.T., Joly R.J., Linkage relationships among twelve allozyme
loci in loblolly pine, J. Hered. 71 (1980) 199–202.
[2] Ahn S., Tanskley S., Comparative linkage maps of the rice and maize
genomes, Proc. Natl. Acad. Sci. USA 90 (1993) 7980–7984.
[3] Arcade A., Anselin F., Faivre Rampant P., Lesage M.C., Laurans F.,
Paques L.E., Prat D., Application of AFLP, RAPD and ISSR markers to gene-
tic mapping of European larch and Japanese larch, Theor. Appl. Genet. 100
(2000) 299–307.
[4] Arumuganathan K., Earle E.D., Nuclear DNA content of some impor
-
tant plant species, Plant Mol. Biol. Rep. 9 (1991) 208–218.
[5] Baradat P., Pastuszka P., Le pin maritime, in: Gallais A., Bannerot H.
(Éds.), Amélioration des espèces végétales cultivées, INRA édition, Paris,
1992, pp. 695–709.
[6] Barreneche T., Bodénès C., Lexer C., Trontin J.F., Fluchs S., Streiff R.,
Plomion C., Roussel G., Steinkellner H., Burg K., Favre J M., Glossl J., Kre
-
mer A., A genetic linkage map of Quercus robur (Pedunculate oak) based on
RAPD, SCAR, microsatellite, isozyme and rDNA markers, Theor. Appl. Ge
-
net. 97 (1998) 1090–1103.
[7] Bennett M.D., Smith J.B., Nuclear DNA amount in angiosperms, Phil.
Trans. R. Soc. Lond. B 274 (1976) 227–274.
[8] Botstein D., White R., Skolnick M., Davis R., Construction of genetic
linkage map in man using restriction fragment length polymorphism, Am. J.
Hum. Genet. 32 (1980) 641–656.
[9] Brendel O., Pot D., Plomion C., Rozenberg P., Guelh J M., Genetic
parameters and QTL analysis of δ
13
C and ring width in maritime pine, Plant
Cell Env. 25 (2002) 945–953.
[10] Byrne M., Murell J.C., Allen B., Moran G.F., An integrated genetic
linkage map for eucalypts using RFLP, RAPD and isozyme markers, Theor.
Appl. Genet. 91 (1995) 869–875.
[11] Carlson J.E., Tulsieram L.K., Glaubitz J.C., Luk V.W.K., Kauffeld
C., Rutledge R., Segregation of random amplified DNA markers in F1 proge
-
ny of conifers, Theor. Appl. Genet. 83 (1991) 194–200.
[12] Cato S.A., Gardner R.C., Kent J., Richardson T.E., A rapid PCR-ba
-
sed method for genetically mapping ESTs, Theor. Appl. Genet. 102 (2001)
296–306.
634 D. Chagné et al.
3
2
4
6
7
9
10
8
11
12
13
15
5
14
1
R = 0.8899
-5
-4
-3
-2
-1
0
0.0 0.5 1.0 1.5 2.0 2.5 3.0 3.5
Physical length per chromosome, Log(Mb/number chromosome)
Number of crossing-
over
Log (co/Mb)
Figure 4. Relationship between the number of crossing-over and the
mean physical size per chromosome in 15 plant species. The corre
-
spondence between the number and the 15 species is presented in
table III.
[13] Causse M., Santoni S., Damerval C., Maurive A., Charcosset A.,
Deatrick J., de Vienne D., A composite map of expressed sequences in maize,
Genome 39 (1996) 418–432.
[14] Cervera M.T., Plomion C., Malpica C., Molecular markers and ge
-
nome mapping in woody plants, in: Jain S.M., Minocha S.C. (Eds.), Molecular
Biology of Woody Plants, Vol. I, 2000, pp. 375–394.
[15] Cervera M.T., Remington D., Frigerio J.M., Storme V., Ivens B.,
Boerjan W., Plomion C., Improved AFLP analysis of tree species, Can. J. For.
Res. 30 (2000) 1608–1616.
[16] Cervera M.T., Storme V., Ivens B., Gusmao J., Liu B.H., Hostyn V.,
Van Slycken J., Van Montagu M., Boerjan W., Dense genetic linkage maps of
three populus species (Populus deltoides, P. nigra and P. trichocarpa) based
on AFLP and microsatellite markers, Genetics 158 (2001) 787–809.
[17] Costa P., Durel C.E., Time trends in genetic control over height and
diameter in maritime pine, Can. J. For. Res. 26 (1996) 1209–1217.
[18] Costa P., Pot D., Dubos C., Frigerio J M., Pionneau C., Bodénès C.,
Bertocchi E., Cervera M.T., Remington D.L., Plomion C., A genetic map of
maritime pine based on AFLP, RAPD and protein markers, Theor. Appl. Ge
-
net. 100 (2000) 39–48.
[19] Devey M.E., Bell J.C., Smith D.N., Neale D.B., Moran G.F., A gene
-
tic map for Pinus radiata based on RFLP, RAPD and microsatellite markers,
Theor. Appl. Genet. 92 (1996) 673–679.
[20] Dirlewanger E., Pronier V., Parvery C., Rothan C., Guye A., Monet
R., Genetic linkage map of peach [Prunus persica (L.) Batsch] using morpho
-
logical and molecular markers, Theor. Appl. Genet. 97 (1998) 888–895.
[21] Doyle J.J., Doyle J.L., Isolation of plantDNAfromfreshtissue, Focus
12 (1990) 13–15.
[22] Echt C.S., Nelson C.D., Linkage mapping and genome length in eas-
tern white pine (Pinus strobus L.), Theor. Appl. Genet. 94 (1997) 1031–1037.
[23] Galbraith D., Harkins K., Maddox J., Ayres N., Sharma D.,
Firoozabady E., Rapid flow cytometric analysis of the cell cycle in intact plant
tissues, Science 220 (1983) 1049–1051.
[24] Grattapaglia D., Sederoff R., Genetic linkage maps of Eucalyptus
grandis and Eucalyptus europhylla using a pseudo testcross: mapping strategy
and RAPD markers, Genetics 137 (1994) 1121–1137.
[25] Han T.H., van Eck H.J., de Jeu M.J., Jacobsen E., Optimization of
AFLP fingerprinting of organisms with large-sized genome: a study on Alstoe-
meria spp, Theor. Appl. Genet. 98 (1999) 465–471.
[26] Harry D.E., Temesgen B., Neale D.B., Codominant PCR-based mar
-
kers for Pinus taeda developed from mapped cDNA clones, Theor. Appl. Ge
-
net. 97 (1998) 327–336.
[27] Hulbert S.H., Hott T.W., Legg E.J., Lincoln S.E., Lander E.S.,
Michelmore R.W., Genetic analysis of the fungus, Bremia lactucae, using res
-
triction length polymorphism, Genetics 120 (1988) 947–958.
[28] Jacobs J.M.E., van Eck H.J., Arens P., Verkerk-Bakker B., te Lintel
Hekkert B., Bastiaansen H.J.M., El-Karbotly A., Pereira A., Jacobsen E.,
Stiekema W.J., A genetic map of potato (Solanum tuberosum) integrating mo
-
lecular markers, including transposons and classical markers, Theor. Appl.
Genet. 91 (1995) 239–300.
[29] Kleinhofs A., Kilian A., Saghai Maroof M.A., Biyashev R.M., Hayes
P., Chen F.Q., Lapitan N., Fenwick A., Blake T.K., Kanazin V., Ananiev E.,
Dahleen L., Kudrna D., Bollinger J., Knapp S.J., Liu B., Sorrells M., Heun M.,
Franckowiack J.D., Hoffmann D., Skadsen R., Steffenson B.J., A molecular,
isozyme and morphological map of barley (Hordeum vulgare) genome, Theor.
Appl. Genet. 86 (1993) 705–712.
[30] Kohler B., Guttenberger H., Borzan Z.G., C-banding pattern of the
chromosomes in the macrogametophyte of Norway spruce, Silvae Genet. 45
(1996) 16–21.
[31] Kremer A., Lascoux D.M., Genetic architecture of height growth in
maritime pine (Pinus pinaster Ait.), Silvae Genet. 37 (1988) 1–8.
[32] Kremer A., Lascoux M., Nguyen A., Morphogenetic subdivision of
height growth and early selection in maritime pine, Proceedings of the 21st
Southern Forest Tree Improvement Conference, 1991, pp. 203–221.
[33] Kubisiak T.L., Nelson C.D., Nance W.L., Stine M., RAPD linkage
mapping in a longleaf pine × slash pine F1 family, Theor. Appl. Genet. 90
(1996) 1110–1127.
[34] Lander E.S., Green P., Abrahamson J., Barlow A., Daly M.J., Lincoln
S.E., Newberg L., MAPMAKER: an interactive computer package for cons
-
tructing primary genetic maps of experimental and natural populations, Geno
-
mics 1 (1987) 174–181.
[35] Marie D., Brown S., A cytometric exercise in plant DNA histograms,
with 2C values for 70 species, Bio. Cell. 78 (1993) 41–51.
[36] Marques C.M., Araujo J.A., Ferreira J.G., Whetten R., O’Malley
D.M., Liu B.H., Sederoff R., AFLP genetic maps of Eucalyptus globulus and
E. tereticornis, Theor. Appl. Genet. 96 (1998) 727–737.
[37] Murray B., Nuclear DNA amounts in gymnosperms, Ann. Bot. 83
(1998) 3–15.
[38] Namuth D.M., Lapitan N.L.V., Gill K.S., Gill B.S., Comparative
RFLP mapping of Hordeum vulgare and Triticum tauschii, Theor. Appl. Ge
-
net. 89 (1994) 865–872.
[39] Neale D.B., Sewell M.M., Brown G.R., Molecular dissection of the
quantitative inheritance of wood property traits in loblolly pine, Ann. For. Sci.
59 (2002) 595–605.
[40] O’Brien I., Smith D., Gardner R., Murray B., Flow cytometric deter
-
mination of genome size in Pinus, Plant Sci. 115 (1996) 91–99.
[41] Ohri D., Khoshoo T.N., Genome size in gymnosperms, Pl. Syst. Evol.
153 (1986) 119–132.
[42] O’Malley D.M., Whetten R., Moleculars markers and forest trees, in:
Caetano-Anollès G., Gresshoff P.M. (Eds.), DNA markers: Protocols, Appli
-
cations and Overviews, 1997, pp. 237–257.
[43] Paglia G.P., Olivieri A.M., Morgante M., Towards second-generation
STS (sequence-tagged sites) linkage maps in conifers: a genetic map of Nor
-
way spruce (Picea abies K.), Mol. Gen. Genet. 258 (1998) 466–478.
[44] Plomion C., Bahrman N., Durel C.E., O’Malley D.M., Genomic map-
ping in Pinus pinaster (maritime pine) using RAPD and protein markers, He-
redity 74 (1995) 661–668.
[45] Plomion C., Durel C.E., Estimation of the average effects of specific
alleles detected by the pseudo-testcross QTL mapping strategy, Genet. Sel.
Evol. 28 (1996) 223–235.
[46] Plomion C., Durel C.E., O’Malley D.M., Genetic dissection of height
in maritime pine seedlings raised under accelerated growth conditions, Theor.
Appl. Genet. 93 (1996) 849–858.
[47] Plomion C., Hurme P., Frigerio J M., Ridolfi M., Pot D., Pionneau
C., Avila C., Gallardo F., David H., Neutelings G., Campbell M., Canovas
F.M., Savolainen O., Bodénès C., Kremer A., Developing SSCP markers in
two Pinus species, Mol. Breed. 5 (1999) 21–31.
[48] Pot D., Chantre G., Rozenberg P., Rodrigues J.C., Jones G.L., Pereira
H., Hannrup B., Cahalan C., Plomion C., Genetic control of pulp and timber
properties in maritime pine (Pinus pinaster Ait.), Ann. For. Sci. 59 (2002)
563–575.
[49] Qi X., Stam P., Lindhout P., Comparison and integration of four bar
-
ley genetic maps, Genome 39 (1996) 379–394.
[50] Reiter R.S., Williams J., Feldman K., Rafalski J.A., Tingey S.V.,
Scolnik P.A., Global and local genome mapping in Arabidopsis thaliana re
-
combinant inbred lines and random amplified polymorphic DNAs, Proc. Natl.
Acad. Sci. USA 89 (1992) 1477–1481.
[51] Remington D.L., Whetten R.W., Liu B.H., O’Malley D.M., Construc
-
tion of an AFLP genetic map with nearly complete genome coverage in Pinus
taeda, Theor. Appl. Genet. 98 (1999) 1279–1292.
[52] Ritter E., Gebhardt C., Salamini F., Estimation of recombination fre
-
quencies and construction of RFLP linkage maps in plants from crosses bet
-
ween heterozygous parents, Genetics 125 (1990) 645–654.
[53] Ritter E., Aragonés A., Markussen T., Acheré V., Espinel S., Fladung
M., Wrobel S., Faivre-Rampant P., Jeandroz S., Favre J M., Towards cons
-
truction of an ultra high density linkage map for Pinus pinaster, Ann. For. Sci.
59 (2002) 637–643.
[54] Sewell M.M., Sherman B.K., Neale D.B., A consensus map for lo
-
blolly Pine (Pinus taeda L.). I. Construction and integration of individual lin
-
kage maps from two outbred three-generation pedigrees, Genetics 151 (1999)
321–330.
[55] Sewell M.M., Bassoni D.L., Megraw R.A., Wheeler N.C., Neale
D.B., Identification of QTLs influencing wood property traits in loblolly pine
An AFLP map of maritime pine 635
(Pinus taeda L.). I. Physical wood properties, Theor. Appl. Genet. 101 (2000)
1273–1281.
[56] Song K.M., Suzuki J.Y., Slocum M.K., Williams P.H., Osnorn T.C.,
A linkage of Brassica rapa (syn. Campestris) based on restriction fragment
length polymorphism loci, Theor. Appl. Genet. 82 (1991) 296–304.
[57] Stam P., Construction of integrated linkage maps by means of a new
computer package: JOINMAP, Plant J. 3 (1993) 739–744.
[58] Tanksley S.D., Ganal M.W., Prince J.P., de Vicente M.C., Bonerbiale
M.W., Broun P., Fulton T.M., Giovannoni J.J., Grandillo S., Martin G.B.,
Messeguer R., Miller J.C., Miller L., Paterson A.H., Pineda O., Roder M.S.,
Wing R.A., Wu W., Young N.D., High dendity molecular linkage maps of the
tomato and potato genomes, Genetics 132 (1992) 1141–1160.
[59] Tanksley S.D., Mapping Polygenes, Ann. Rev. Genet. 27 (1993)
205–233.
[60] Temesgen B., Neale D.B., Harry D.E., Use of haploid mixtures and
heteroduplex analysis enhance polymorphism revealed by Denaturing Gra
-
dient Gel Electrophoresis, BioTechniques 20 (2000) 114–122.
[61] Temesgen B., Brown G.R., Harry D.E., Kinlaw C.S., Sewell M.M.,
Neale D.B., Genetic mapping of expressed sequence tag polymorphism
(ESTP) markers in loblolly pine (Pinus taeda L.), Theor. Appl. Genet. 102
(2001) 664–675.
[62] Travis S.E., Ritland K., Whitman T.G., Keim P., A genetic linkage
map of Pinyon pine (Pinus edulis) based on amplified fragment length poly
-
morphism, Theor. Appl. Genet. 97 (1998) 871–880.
[63] Tulsieram L.K., Glaubitz J.C., Kiss G., Carlson J.E., Single tree gene
-
tic linkage analysis in conifers using haploid DNA from megagametophytes,
BioTechnology 10 (1992) 686–690.
[64] Verhaegen D., Plomion C., Genetic mapping in Eucalyptus urophylla
and E. grandis using RAPD markers, Genome 39 (1996) 1051–1061.
[65] Voorips R.E., Mapchart version 2.0: Windows software for the gra
-
phical presentation of linkage maps and QTLs, Plant Research International,
Wageningen, The Netherlands, 2001.
[66] Vos P., Hogers R., Bleeker M., Reijans M., van der Lee T., Hornes
M., Frijters A., Pot J., Pelemam J., Kuiper M., Zabeau M., AFLP: a new tech
-
nique for DNA fingerprinting, Nucleic Acids Res. 23 (1995) 4407–4414.
[67] Wakamiya I., Newton R. Johnston J.S., Price H.J., Genome size and
environmental factors in the genus Pinus, Am. J. Bot. 80 (1993) 1235–1241.
[68] Williams J.G.K., Kubelik A.R., Livak K.J., Rafalski J.A., Tingey
S.V., DNA polymorphisms amplified by arbitrary primers are useful as gene
-
tic markers, Nucleic Acids Res. 18 (1990) 6531–6535.
To access this journal online:
www.edpsciences.org
636
D. Chagné et al.