Tài liệu Báo cáo khoa học: A differential scanning calorimetry study of tetracycline repressor pptx
Bạn đang xem bản rút gọn của tài liệu. Xem và tải ngay bản đầy đủ của tài liệu tại đây (366.09 KB, 10 trang )
A differential scanning calorimetry study of tetracycline repressor
Sylwia Ke
˛
dracka-Krok and Zygmunt Wasylewski
Department of Physical Biochemistry, Faculty of Biotechnology, Jagiellonian University, Krakow, Poland
Tetracycline repressor (TetR), which constitutes the most
common mechanism of bacterial resistance to an antibiotic,
is a homodimeric protein composed of two identical sub-
units, each of which contains a domain possessing a helix–
turn–helix motif and a domain responsible for binding tetra-
cycline. Binding of tetracycline in the protein pocket is
accompanied by conformational changes in TetR, which
abolish the specific interaction between the protein and
DNA. Differential scanning calorimetry (DSC) and CD
measurements, performed at pH 8.0, were used to observe
the thermal denaturation of TetR in the absence and pres-
ence of tetracycline. The DSC results show that, in the
absence of tetracycline, the thermally induced transitions of
TetR can be described as an irreversible process, strongly
dependent on scan rate and indicating that the protein
denaturation is under kinetic control described by the simple
kinetic scheme: N
2
À!
k
D
2
,wherek is a first-order kinetic
constant, N is the native state, and D is the denatured state.
On the other hand, analysis of the scan rate effect on the
transitions of TetR in the presence of tetracycline shows that
thermal unfolding of the protein can be described by the
two-state model: N
2
! U
2
À! D. In the proposed model,
TetR in the presence of tetracycline undergoes co-operative
unfolding, characterized by an enthalpy change (DH
cal
¼
1067 kJÆmol
)1
) and an entropy change (DS ¼ 3.1 kJÆmol
)1
).
Keywords: circular dichroism; differential scanning calori-
metry; tetracycline repressor; tetracycline; thermal denatur-
ation.
Resistance to tetracycline (Tc), which is the most common
form of antibiotic resistance in Gram-negative bacteria,
is based on the activation of the drug efflux through the
cytoplasmic membrane mediated by the antiporter protein
TetA. Expression of the tetA gene is strictly regulated by the
Tc repressor (TetR) protein. TetR occurs as a homodimer in
which two identical helix–turn–helix (HTH) motifs bind in
the absence of [Mg–Tc]
+
to two adjacent major grooves of
DNA, thus, preventing transcription of the tetR gene that
encodes TetR itself and of the tetA gene that encodes the
resistance protein TetA. If Tc enters a resistant bacterial cell,
it binds with high affinity to TetR [1]. This binding is
accompanied by conformational changes in TetR, which
abolish the specific interaction with DNA, reduces the
binding affinity for operator DNA by 6–8 orders of
magnitude [2] and finally induces the release of the TetR–
[Mg–Tc]
+
ternary complex, thereby initiating expression of
TetA [3,4]. Regulation of TetR by binding of [Mg–Tc]
+
takes place in the core of the repressor, which is formed by
helices a5toa10 of both subunits. Study of the crystal
structure of the TetR homodimer in complex with its
palindromic DNA operator shows that after [Mg–Tc]
+
insertion into the binding tunnel in the repressor core, Tc is
anchored by hydrogen bonds between its functional groups
and the C-terminal side chains of helix a4, and helices a5
and a6. This initiates conformational changes starting with
C-terminal unwinding and shifting of the short helix a6in
each monomer. Subsequently, it forces a pendulum-like
motion of helix a4, which increases the separation of the
attached DNA-binding domains by 3 A
˚
[5].
As TetR–tetO is the most efficient inducible system of
transcriptional regulation known so far, it is often used as a
tool for selective target gene regulation in eukaryotes [6,7].
From the studies of Backes et al. [8], it is known that
urea-induced unfolding of TetR is a reversible reaction
described by a two-state model. There was no evidence for
the existence of unfolding intermediates, so the conclusion
was drawn that the TetR dimer dissociates and unfolds in
coincident reaction and that the folded monomers are
unstable. Thermal denaturation studies, using temperature
gradient gel electrophoresis, indicate that the free TetR and
its complex with Tc exhibit monophasic transition upon
denaturation [9].
The main aim of this study is to show how binding of Tc
influences the stability of TetR. Differential scanning
calorimetry (DSC) was applied as the most direct experi-
mental technique to elucidate the energetics of conforma-
tional transitions of biological macromolecules [10–12].
Materials and methods
Materials
Acrylamide, phenylmethanesulfonyl fluoride, Tc and Tris
were purchased from Sigma. Dithiothreitol, MgCl
2
.6H
2
O
and NaCl were from Fluka. The Fractogel EMD
Correspondence to Z. Wasylewski, Department of Physical
Biochemistry, Faculty of Biotechnology, Jagiellonian University,
ul. Gronostajowa 7, 30-387 Krakow, Poland.
Fax: + 48 12 25 26 902, Tel.: + 48 12 25 26 122,
E-mail:
Abbreviations: TetR, tetracycline repressor; DSC, differential scanning
calorimetry; DLS, dynamic light scattering; CRP, cAMP receptor
protein.
(Received 26 June 2003, revised 15 September 2003,
accepted 29 September 2003)
Eur. J. Biochem. 270, 4564–4573 (2003) Ó FEBS 2003 doi:10.1046/j.1432-1033.2003.03856.x
SO
À
3
650 (M) was from Merck, and Q Sepharose Fast Flow
and Sephacryl S-200 HR were from Amsterdam Pharmacia
Biotech. The nutrients for bacterial growth were from Life
Technologies. All other chemicals were products of analyt-
ical grade from Polish Chemical Reagents (Gliwice,
Poland). Buffers in water purified by the Millipore system
were used throughout this work.
Protein purification
The wild-type Tet repressor was overproduced in Escheri-
chia coli strain RB 791 (a gift from W. Hillen, Universitat
Erlangen-Nurnberg, Germany).
Protein purification in general followed the scheme
described by Ettner et al. [13] with a few modifications
[14]. After the purification procedure, the protein was highly
pure (> 97%) as judged by SDS/PAGE and Coomassie
Brilliant Blue staining. The dimer repressor concentration
was determined spectrophotometrically using an excitation
coefficient e
280nm
¼ 30 · 10
3
M
)1
Æcm
)1
[15]. The activity of
the proteins was checked using the Tc titration method. The
concentration of Tc was determined in 0.1
M
HCl using an
excitation coefficient e
355nm
¼ 13320
M
)1
Æcm
)1
[16].
All measurements for unliganded protein were performed
in buffer A (10 mM Tris/HCl, 150 mM NaCl, 2 m
M
dithiothreitol, pH 8.0), but for the complex of protein with
Tc, buffer B, which also contained 10 mM MgCl
2
,was
used. The Tris/HCl buffer was chosen because the
[TetR–Tc] complex is stable at high pH up to 12. Below
pH 8.0, the complex stability decreases, and the binding of
Tc is completely inhibited at pH 5.0 [17]. It is known that
Tris buffer exhibits a pronounced dpK/dT dependence.
However, the results were not significantly affected by pH
change with increasing temperature. A comparison of
calorimetric enthalpy and denaturation temperature for
the protein in the absence of Tc, in buffer with and without
Mg, does not show any differences in these values.
Differential scanning calorimetry
DSC experiments were performed on a Calorimetry Sciences
Corporation (CSC) 6100 Nano II differential scanning
calorimeter with a cell volume of 0.3228 mL, interfaced with
a personal computer (IBM-compatible). Different concen-
trations of the protein samples within the 0.4–4.0 mgÆmL
)1
range and different scan rates of 0.1–2.0 KÆmin
)1
were used.
Before the measurements, the protein samples were exhaust-
ively dialyzed against buffer A, and the samples with Tc
against buffer B. The samples and reference solutions were
degassed for at least 5 min at room temperature and
carefully loaded into the cells to avoid bubble formation.
Cells were carefully cleaned before each experiment. A
constant pressure of 304 kPa was maintained to prevent
possible degassing of the samples on heating. A background
scan recorded with the buffer in both cells was subtracted
from each test scan. The reversibility of thermal transitions
was checked by examining the reproducibility of the
calorimetric trace in the second heating of the sample
immediately after fast cooling from the first scan.
The excess molar heat capacity was calculated using the
molecular mass of the Tet repressor of 46 708 Da and the
partial specific volume of the protein equal to 0.73 mLÆg
)1
,
which has been calculated from the amino-acid sequence as
described by Perkins [18]. To obtain the C
exc
p
,the
ORIGIN
software package (Microcal) was used for baseline subtrac-
tion and determination of total enthalpy change. The pre-
transition and post-transition parts of the DSC profiles were
extrapolated by nth order polynomial in the Origin,
although 4th order polynomial (in
SIGMA PLOT
)wasalso
checked. The differences in mean calorimetric enthalpy and
denaturation temperature obtained with these two methods
did not exceed 5% and 0.2 °C, respectively. The shape of
the pre-transition and post-transition baselines changed
from scan to scan, but these differences were not significant.
The transition curves were integrated numerically. Molar
transition enthalpies DH
cal
referring to the molecular mass
of the protein and the van’t Hoff enthalpies (DH
vH
)were
calculated from the equation:
DH
vH
¼
ART
2
max
C
exc;max
p
DH
cal
ð1Þ
where C
exc,max
p
is the excess of molar specific heat capacity
over the baseline value at maximum transition, T
max
is the
denaturation temperature in Kelvin, DH
cal
is the total molar
enthalpy change during the denaturation process, R is the
gas constant, and A is equal to 4.0 for monomer or for
nondissociated dimer [19].
Circular dichroism
CD measurements were performed on a Jasco-710 spectro-
polarimeter equipped with water-jacketed cell holder and a
Julabo F25 circulator bath with programmable temperature
controller. The actual temperature inside the quartz cell
(with path length of 1 mm) was measured with Digi-sense
thermocouple thermometer. Protein thermal denaturation
was monitored by following the changes in ellipticity at
222nm with a scan rate of 1KÆmin
)1
. Spectra were
collected in the temperature range 25–80 °C. The data were
analysed and the midpoint melting temperature (T
m
)values
were determined by noise reduction and differentiation of
curves using the Standard Analysis program provided with
the instrument.
Dynamic light scattering (DLS)
DLS measurements were made using a DynaPro-MS800
instrument from Protein Solution Inc. (Charlottesville, VA,
USA). All samples were filtered through a 0.02-lmmem-
brane (Whatman; Anodisc 13) into a 45-lL(3mmpath
length) quartz cuvette. The measurements were performed
at 20 ± 0.1 °C. DLS data were analyzed by the auto-
correlation method to calculate the translational diffusion
coefficient (D
T
) of the TetR protein and its complex with Tc.
The results were analyzed by applying monomodal and
bimodal models. The hydrodynamic radius (R
H
)isderived
from D
T
using the Stokes–Einstein equation:
R
H
¼ k
B
T=6pgD
T
ð2Þ
where k
B
is the Boltzman constant, T is temperature in
Kelvin, and g is the solvent viscosity. The theoretical
hydrodynamic radius (R
theo
H
) can be obtained from the
following formula:
Ó FEBS 2003 DSC study of tetracycline repressor (Eur. J. Biochem. 270) 4565
R
theo
H
¼½ð3Mðm þ hÞÞ=ð4pN
A
Þ
1=3
where N
A
is the Avogadro constant, m is the partial
specific volume, h is the hydration, and M is the molar
mass of the protein. The ratio R
H
=R
theo
H
provides informa-
tion about the shape of a molecule in the solution.
Results
DSC measurements
Wild-type TetR and its complex with Tc underwent
irreversible denaturation under all adopted conditions, even
if the sample was cooled immediately after the peak
absorption was completed and then it was scanned again,
or when heating was stopped near maximum point and then
the sample was cooled and reheated. Aggregation was
evident in samples extracted from the calorimetric cell.
There were substantial instrumental distortions that resulted
in uncertainties and baseline variability. In addition, an
exothermic peak was present for higher protein concentra-
tions on the high temperature side of the DSC endotherm.
The calorimetric effect for the sample (without Tc) at
protein concentrations lower than 0.4 mgÆmL
)1
was at the
level of the instrumental noise, which was approximately
±0.4 lW.
The concentration effect
Thermograms for TetR were measured in buffer A as a
function of protein concentration from 0.4 to 4.0 mgÆmL
)1
at a scan rate of 1.0 KÆmin
)1
. Denaturation scans for
samples with Tc were carried out in buffer B at a molar ratio
of 5 mol Tc per mol of the protein dimer, with a similar
concentration range and the same scan rate as for samples
without the ligand. The typical denaturation curves for
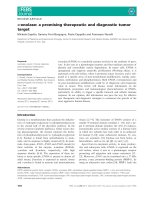
TetR and its complex with Tc are presented in Fig. 1. Fig. 2
shows the dependence of T
max
on the concentration of the
protein. In the case of TetR, the T
max
obtained decreases
with increasing protein concentration, which indicates that
TetR unfolds without dissociation. Indeed, if multimeric
proteins undergo unfolding with simultaneous dissociation
into monomers, T
max
should increase with the total protein
concentration [20,21]. The DSC profiles obtained for TetR
alone are highly asymmetrical, and the ratio DH
cal
/DH
vH
is much below unity, i.e. between 0.55 and 0.76
(Table 1), which indicates some oligomerization, which is
independent of protein concentration over the range used in
these studies. The calorimetric enthalpy, DH
cal
, although
determined with some inaccuracy because of the existence of
an exothermic peak, increases a little with a rise in TetR
concentration (Table 1).
The enthalpic effect that accompanies the aggregation
of TetR is pronounced above a concentration of
0.4 mgÆmL
)1
, and cannot be ignored. Furthermore, the
minimum of the negative peak shifts towards the low
temperature, and the exotherm intensity decreases as the
concentration increases. It is evident that the concentration
influences the two thermal phenomena in the same
direction, namely both peaks shift towards the low
temperature side when concentration increases. However,
this effect is greater for the exothermic peak than for the
endothermic one. As a consequence, at the high protein
concentration (% 4.0 mgÆmL
)1
) the two peaks almost
overlap.
The dependence of T
max
on the concentration of Tc
bound to TetR is more complex (Fig. 2). The very small
changes in the T
max
of the [TetR–Tc] complex observed on
increasing the temperature, together with the observation
that the transitions do not change their symmetrical shape
with increasing temperature, lead us to conclude that the
Fig. 1. Typical thermograms of TetR (broken line) and complex of TetR
with Tc (solid line). Measurements were made in buffer A (10 m
M
Tris/
HCl buffer, pH 8.0, containing 150 mM NaCl and 2 m
M
dithiothrei-
tol) at a scan rate of 1 KÆmin
)1
and buffer B (10 m
M
Tris/HCl buffer,
pH 8.0, containing 150 m
M
NaCl, 2 m
M
dithiothreitol and 10 m
M
MgCl
2
)atascanrateof1KÆmin
)1
, for TetR alone and for the com-
plex of TetR with Tc, respectively. Protein concentration in both cases
was 0.4 mgÆmL
)1
. The ratio of concentrations was 5 mol Tc/mol TetR
dimer.
Fig. 2. Effect of concentration on transition temperature (T
max
). The
circles correspond to T
max
for TetR obtained from DSC measurements
(d) and CD experiments (s). The triangles correspond to T
max
for the
complex of Tet repressor with Tc (5 mol excess of Tc over 1 mol of the
dimer was applied); (m) data obtained from DSC; (n)datafromCD
measurements.
4566 S. Ke˛dracka-Krok and Z. Wasylewski (Eur. J. Biochem. 270) Ó FEBS 2003
liganded TetR unfolds without simultaneous dissociation
into monomers.
For TetR alone, at a concentration of 0.4 mgÆmL
)1
and
scan rate of 1 KÆmin
)1
, T
max
is 60.4 °C. The denaturation
temperature, T
max
, of the complex of TetR with Tc is
70.4 °C, measured at a protein concentration of
0.4 mgÆmL
)1
and scan rate of 1 KÆmin
)1
(Figs 1 and 2).
Therefore, under these experimental conditions, binding of
Tc causes an increase in the T
max
of the protein of
% 10.0 °C. The ligand binding leads to a doubling of the
denaturation enthalpy value (Table 1).
Effect of the scan rate
Thermal denaturation of TetR was carried out at a protein
concentration of 0.6 mgÆmL
)1
andscanrate(v)of
0.1–2.0 KÆmin
)1
. Measurements of liganded protein were
performed in buffer B, at a protein concentration of
0.4 mgÆmL
)1
and at fivefold molar excess of Tc per mol of
the dimer. The denaturation enthalpy values of the proteins
(in the absence and presence of ligand) as a function of scan
rate are shown in Table 2. A small decrease in denaturation
enthalpy was observed on a rise in scan rate for the repressor
in the absence of Tc, whereas for the ligated protein, a
slight increase was noted.
The T
max
is the increasing linear function of the scan rate
of TetR (Fig. 3). These results indicate that denaturation of
TetR protein occurs as a kinetically controlled process,
which cannot be described by equilibrium thermodynamics
[21–23]. This kind of denaturation process is assumed to be
a first-order reaction with a rate constant, k, that changes
with temperature, according to the Arrhenius equation:
k ¼ Aexp À
E
a
RT
¼ exp
E
a
R
1
T
Ã
À
1
T
where E
a
is the activation energy and T* is the temperature
at which k ¼ 1min
)1
(the frequency factor is equal to
exp(E/RT*)). The rate of transition between these states is
limited by the energy of activation, which is determined by
the conformation of the transition state. In this case, the
excess heat capacity C
exc
p
is given by the equation [24]:
C
exc
p
¼
1
m
DHexp
E
a
R
1
T
Ã
À
1
T
ÂÀ
1
m
Z
T
T
0
exp
E
a
R
1
T
Ã
À
1
T
dT
8
<
:
9
=
;
ð3Þ
Table 1. Apparent thermodynamic transition parameters for TetR and complex of TetR with Tc at various concentrations. The buffer for TetR was
10 mM Tris/HCl, 150 mM NaCl, 2 mM dithiothreitol, pH 8.0. The buffer for TetR + Tc was 10 mM Tris/HCl, 150 mM NaCl, 2 mM
dithiothreitol, 10 mM MgCl
2
,pH8.0.
TetR TetR + Tc
c
(mgÆmL
)1
)
DH
cal
(kJÆmol
)1
) DH
cal
/DH
vH
c
(mgÆmL
)1
)
DH
cal
(kJÆmol
)1
) DH
cal
/DH
vH
0.40 397.84 0.59 0.30 954.40 0.89
0.60 411.54 0.55 0.40 1058.14 0.92
0.90 502.76 0.68 0.50 1230.56 1.08
1.50 517.59 0.71 1.00 1031.91 0.88
2.00 520.23 0.76 2.00 1134.11 1.03
3.00 515.79 0.57 2.80 1025.80 0.91
4.00 527.98 0.58 3.40 1080.94 0.89
– – 4.00 976.98 1.03 –
– – 4.00 988.80 1.13 –
Mean (± SD) – 484.82 (55.39) 0.64 (0.08) – 1053.53 (86.40) 0.97 (0.10)
Table 2. Apparent thermodynamic transition parameters of TetR and complex of TetR with Tc at various heating rates. The buffer for TetR was
10 mM Tris/HCl, 150 mM NaCl, 2 mM dithiothreitol, pH 8.0. The buffer for TetR + Tc was 10 mM Tris/HCl, 150 mM NaCl, 2 mM
dithiothreitol, 10 mM MgCl
2
,pH8.0.
TetR TetR + Tc
m
(KÆmin
)1
)
DH
cal
(kJÆmol
)1
)
DH
cal
/DH
vH
m
(KÆmin
)1
)
DH
cal
(kJÆmol
)1
)
DH
cal
/DH
vH
0.10 541.22 0.78 0.10 920.25 0.81
0.50 550.27 0.91 0.50 911.66 0.88
1.00 495.84 0.78 1.00 1084.25 0.97
1.50 482.10 0.76 1.50 1030.15 0.99
2.00 452.73 0.70 2.00 1061.91 1.05
Mean (± SD) – 504.43 (40.94) 0.78 (0.08) – 1001.62 (80.62) 0.94 (0.09)
Ó FEBS 2003 DSC study of tetracycline repressor (Eur. J. Biochem. 270) 4567
where DH is the enthalpy difference between the denatured
and native state, m ¼ dT/dt is the scan rate, and E
a
is the
activation energy.
The thermal dependence of heat capacity (C
exc
p
)forTetR
was fitted to the experimental curves. The results are
presented in Fig. 4. The mean value for the activation
energy, E
a
, was calculated as 409.14 ± 30.5 kJÆmol
)1
,and
the mean value of temperature T*wasdeterminedas
61.53 ± 0.9 °C. The results are presented in Table 3.
To check further the validity of the two-state kinetic
model, proposed for denaturation of TetR alone, the
following equations proposed by Kurganov et al. [24] were
used:
d ln C
exc
p
d1=T
¼
1
m
T
2
 exp
E
a
R
1
T
Ã
À
1
T
À
E
a
R
ð4Þ
1
T
¼
1
T
Ã
À ln
mC
exc
p
Q
t
À Q
E
a
R
ð5Þ
The estimated Arrhenius equation parameters obtained
from Eqns (3), (4), and (5) are in good agreement with
each other and clearly support the proposed model of
TetR denaturation in the absence of Tc.
The temperature dependence of excess molar heat
capacity of TetR in the presence of Tc, at various scan
rates is presented in Fig. 5, and the dependence of the
transition temperature, T
max
,onscanrateforTetR–
[Mg–Tc]
+
complexes is shown in Fig. 3. The T
max
rapidly
increases in the range of low scan rates, but for higher scan
rates, it reaches a noticeable plateau. Such a relationship
between T
max
and scan rate indicates that this type of
equilibrium thermodynamic analysis can be employed
[21,25,26]. The enthalpy change associated with transition
is equal to the area under the peak(s), i.e.
DHðT
max
Þ¼
Z
T
F
T
0
C
exc
p
dT:
The entropy change is given by
DSðT
max
Þ¼
Z
T
F
T
0
C
exc
p
T
dT;
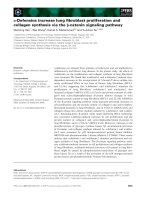
Fig. 4. Temperature dependence of excess molar heat capacity of TetR
at a scan rate of 0.5 (n), 1.0 (h), 1.5 (s)or2.0(e)KÆmin
)1
in buffer A.
Solid lines are the best fit to each curve according to Eqn (3). Protein
concentration was always 0.6 mgÆmL
)1
.
Fig. 3. Effect of scan rate on transition temperature. Data obtained
from DSC experiments. (d) T
max
for TetR; (m) T
max
for the complex
ofTetrepressorwithTc(5molexcessofTcover1molofthedimer
was applied). The continuous lines have no theoretical meaning and
are shown to guide the eye.
Table 3. Arrhenius equation parameters estimated from the two-state irreversible model of thermal denaturation of TetR according to Eqns (3), (4) and
(5). The buffer was 10 mM Tris/HCl, 150 mM NaCl, 2 mM dithiothreitol, pH 8.0.
TetR
m
(KÆmin
)1
)
DH
(kJÆmol
)1
)
E
a
(kJÆmol
)1
)
T*
(°C)
Based on:
Eqn 3
Based on:
Eqn 3
Eqn 4 Eqn 5
Based on:
Eqn 3
Eqn 4 Eqn 5
0.50 652.51 363.54 406.26 413.22 62.86 61.88 61.95
1.00 512.23 423.60 414.07 425.49 61.30 61.26 61.35
1.50 468.65 423.41 422.32 403.20 60.98 60.98 61.23
2.00 467.81 426.42 421.70 417.58 60.97 60.98 61.14
Mean (± SEM) – 525.30 (87.32) 409.24 (30.50) 418.95 (8.62) 415.11 (6.22) 61.53 (0.90) 61.28 (0.42) 61.42 (0.37)
4568 S. Ke˛dracka-Krok and Z. Wasylewski (Eur. J. Biochem. 270) Ó FEBS 2003
where T
0
and T
F
are lower and upper temperature limits
of transition, respectively, and T
max
is the excess heat
capacity associated with the transition. The Gibb’s free
energy, DG ¼ DH ) TDS, and thus the entire transition
energetics, can be calculated in a model-independent
fashion [10,22]. Unfortunately, it was impossible to
determine the change in heat capacity, because of
insufficient signal-to-noise ratio of the experimental data.
The thermodynamic parameters obtained are summarized
in Table 4.
Thermal transition of the TetR–[Mg–Tc]
+
complex was
analyzed according to a two-state model. The best fit for
scan rate curves above 1.0 KÆmin
)1
is shown in Fig. 5.
This model assumes that the total excess capacity is
the sum of n independent thermal transitions. The heat
capacity associated with thermal transition is deter-
mined by a temperature derivative of enthalpy changes,
as given by:
C
p
ðTÞ¼
dH ðTÞ
dT
ð6Þ
The enthalpy change is determined by the total enthalpy
of the transition, which is assumed to be a constant
multiplied by the fraction of the molecules that are
unfolded: H(T) ¼ f
u
(T)DH. The fraction of unfolded
molecules is determined by the equation:
f
u
ðTÞ¼
KðTÞ
1 þ KðTÞ
where the equilibrium constant is
KðTÞ¼exp
DH À T
DH
T
max
RT
"#
DSC curves were analyzed using the CpCalc software
package provided by CSC. It turned out that a two-state
model with one transition is good enough to describe
denaturation of the complex of TetR with Tc. The enthalpy
values obtained are listed in Table 4.
CD measurements
The CD measurements were performed in the same buffer as
the DSC experiments. Figure 6 shows an example of a CD
denaturation profile for TetR protein, and Fig. 7 presents a
typical CD denaturation curve for TetR protein in complexes
with Tc. Binding of Tc leads to increased symmetry of the
thermal transition. Moreover, the results confirm the
tendency of the behavior of the transition temperature
observed with the DSC method (Fig. 2). Converted to mean
residue ellipticity, CD thermal transition spectra for TetR
were analyzed using nonlinear least squares fitting. The result
is presented in Fig. 6. The fraction of denatured protein, F
U
,
was calculated from the spectral parameter used to follow
denaturation (y) before the minimization procedure accord-
ing to the relation:
F
U
¼ðy À y
N
Þ=ðy
U
À y
N
Þ
y
N
¼ a
1
+a
2
T and y
U
¼ b
1
+b
2
T are the means of y,
characteristic of the native and denatured conformation,
respectively. They were obtained by linear regression of the
pre-transition and post-transition baselines. The parameter
used to follow denaturation, y, can be expressed as a
function of the kinetic parameters according to the follow-
ing equation [24]:
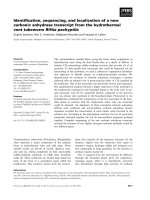
Fig. 5. Temperature dependence of excess molar heat capacity of the
complex of TetR with Tc at five different scan rates: 0.1, 0.5, 1.0, 1.5 and
2.0 KÆmin
)1
. Measurements were performed in buffer B with 5 mol
excess of Tc over 1 mol of the protein. The solid lines represent the best
one-transition two-state reversible model according to Eqn (6).
Table 4. Summary of DSC measurements. The buffer for TetR was 10 mM Tris/HCl, 150 mM NaCl, 2 mM dithiothreitol, pH 8.0. The buffer for
TetR + Tc was 10 mM Tris/HCl, 150 mM NaCl, 2 mM dithiothreitol, 10 mM MgCl
2
,pH8.0.
Species Effect
E
a
(kJÆmol
)1
)
T*
(°C)
DS (T
max
)
(kJÆmol
)1
ÆK
)1
)
DH
a
(kJÆmol
)1
)
TetR Scan rate 418.40 ± 15.74 61.41 ± 0.56 – –
TetR + Tc Concentration – – 3.06 ± 0.25 1077.2 ± 86.2
Scan rate – – 3.10 ± 0.08 1067.1 ± 36.3
a
Values from fitting one-transition two-state model, according to Eqn (6).
Ó FEBS 2003 DSC study of tetracycline repressor (Eur. J. Biochem. 270) 4569
y¼y
U
À½y
U
Ày
N
exp À
1
m
Z
T
T
0
exp
E
a
R
1
T
Ã
À
1
T
dT
8
<
:
9
=
;
ð7Þ
The kinetic parameters obtained from the analysis of
CD curves are 455.02 ± 2.83 kJÆmol
)1
for E
a
and 61.44 ±
0.04 °CforT*.
Additional quantitative validation of the two-state
reversible interpretation of the denaturation of the [TetR–
Tc] complex was obtained using a vant’Hoff analysis of the
CD data. Taking into account that the intensity of CD
signals is virtually insensitive to the aggregation process, and
that the unfolding of the complex is a two-state process, the
corresponding equilibrium constant is given by:
K ¼
U
2
N
2
; a ¼
K
1 þ K
) K ¼
f
u
1 À f
u
where, f
u
is the degree of advancement of the denaturation
process which refers to the unfolded fraction of a protein,
resulting from normalization of thermal CD profiles. The
denaturation CD profiles for the complex of TetR with Tc
were analyzed according to the following equation:
fðTÞ¼
½f
n
þm
n
Tþ f
u
þm
u
ðTÞ exp
DH
mH
R
1
T
m
À
1
T
hinohi
1þexp
DH
mH
R
1
T
m
À
1
T
hino
ð8Þ
where f(T) is the native fraction of the protein in the
temperature function, f
n
and f
u
are fractions of native
protein for pre-transition and post-transition curves,
respectively, obtained by extrapolation to 0 K, and m
n
and m
u
are slopes of the pre-transition and post-transition
curves (Fig. 6). The DH
vH
and T
m
values obtained are
917.78 ± 5.99 kJÆmol
)1
and 69.97 ± 0.01 °C, respectively.
DLS measurements
The buffer conditions in the DLS experiments were the
same as in the DSC measurements. The curves showing the
estimated hydrodynamic radius of wild-type TetR and its
complex with Tc as a function of protein concentration are
presented in Fig. 8. For evaluation of R
theo
H
,hydrationwas
estimated to be 0.2 g H
2
O per g protein and the partial
specificvolumetobe0.73cm
3
per g protein [18,27]. From
the comparison of R
H
values obtained from linear extra-
polation to zero concentration for wild-type TetR (2.98 ±
0.01 nm) and its complexes with Tc (3.04 ± 0.06 nm), it
appears that there are no pronounced differences in
hydrodynamic radii. The R
H
=R
theo
H
ratio higher than 1
(always % 1.15) indicates similar discrepancies in the
spherical shape of the protein in the absence and presence
of the ligand. The increasing linear dependence of R
H
on the
concentration of wild-type TetR suggests a strong tendency
of the protein to aggregate. Tc binding makes this protein
resistant to polymerization.
Fig. 6. Temperature dependence of residue ellipticity at 222 nm for
TetR in buffer A obtained on heating with a constant scan rate of
% 1KÆmin
)1
. The solid line is the best fit obtained using Eqn (7).
Fig. 7. Temperature dependence of folded fraction ( f)oftheTetR
complex with Tc in buffer A (5 M excess of Tc over 1 mol of the protein
was used) obtained on heating with a constant scan rate of % 1KÆmin
)1
.
The solid line is the best fit obtained using Eqn (8).
Fig. 8. Dependence of hydrodynamic radii on concentration of TetR (m)
in buffer A and TetR–Tc (s) in buffer B (5 mol excess of Tc over 1 mol
TetR).
4570 S. Ke˛dracka-Krok and Z. Wasylewski (Eur. J. Biochem. 270) Ó FEBS 2003
Discussion
In this study, DSC, CD and DLS were used to show how
binding of the [Mg–Tc]
+
inducer to TetR can influence the
gross structure of the protein and the repressor stability in
solution. Here we studied the TetR
B
homodimer variant,
which is believed to have a similar structure to the TetR
D
variant [3]. Crystallographic studies of TetR
D
have shown
that binding of [Mg–Tc]
+
is accompanied by conforma-
tional changes in TetR, which in turn can abolish the specific
interaction of the protein with the DNA operator
sequences [28]. [Mg–Tc]
+
binds to the two tunnel-like
cavities, which, in the absence of the inducer, are filled with
disordered water molecules, and interact by both hydrogen
bonding and hydrophobic interactions with the protein
moiety [29]. Our previous CD studies in solution showed
that, in the case of TetR
B
,[Mg–Tc]
+
binding does not lead
to dramatic changes in the secondary structure of the
protein [30]. However, it has been suggested that a small
decrease in the TetR helicity may occur as the result of
partial unfolding of the DNA-recognition helix of the
protein. This suggestion is supported by the observation that
the fluorescence of Trp43, localized in the HTH structure of
TetR, changes dramatically on inducer binding [30]. These
findings are further supported by Trp43 fluorescence
measurements of TetR
B
[31] and by infrared and Raman
spectroscopy measurements [32], which showed nearly
identical secondary conformation of TetR
B
with and
without the inducer in solution. A variety of point mutations
in TetR
B
have also been used to investigate how substitution
of amino acids in the protein molecule results in inducer
binding in the protein cavities [33]. These studies show that
substitution of protein residues engaged in hydrogen
bonding with [Tc–Mg]
+
results in reduced binding of the
inducer by several orders of magnitude, whereas substitu-
tion of residues engaged in hydrophobic interactions only
marginally reduces the affinity for the inducer.
The DLS results presented here show that TetR
B
alone
has a Stokes’ radius of 3.04 nm, which decreases very
slightly to 2.98 nm on binding of [Tc–Mg]
+
in the protein
pocket. It should be pointed out that binding of the inducer
to TetR does not lead to any changes in the global structure
of the protein. However, a much stronger tendency to
protein aggregation has been observed in the case of TetR
B
alone than for the complex of the protein with [Tc–Mg]
+
inducer. The DLS measurements indicate that at 20 °C
TetR alone, as well as in the presence of [Mg–Tc]
+
,was
dimeric. As the binding of two molecules of [Mg–Tc]
+
to
TetR leads to changes in the tertiary structure of the protein,
one can expect that these changes may lead to a decrease in
the tendency of the protein to aggregate.
The DSC thermograms of TetR alone, presented in
Fig. 1, show irreversible thermal unfolding of the protein,
assuming an asymmetrical shape. The observed decrease in
T
max
on increasing TetR concentration (Fig. 2) indicates
that the dimeric protein aggregated at higher TetR concen-
tration. The DH
cal
/DH
vH
ratio for TetR of 0.64 may also
indicate protein oligomerization on unfolding. However,
because of the irreversibility of the TetR transition, the
volume DH
cal
/DH
vH
ratio can be treated only qualitatively.
Detailed analysis of various theoretical models of the
irreversible denaturation of proteins [21,24,34,35] has been
performed in the literature. The simplest two-state kinetic
model has been used to describe thermal transition of
several proteins [23,36–39]. Analysis of the DSC results
shows that TetR alone undergoes irreversible thermal
denaturation during kinetically controlled reactions, which
can be described by the simplest model called the two-state
model, which is a limiting case of the Lumry–Eyring model
[11]:
N
2
À!
k
D
2
;
where k is first-order rate constant, and N and D are native
and irreversible denatured monomer of the protein, respect-
ively. This suggestion was verified by calculation of the
activation energy using different analytical transformations
to fit of the experimental data. The values of the average
energy of activation, E
a
, presented in Table 3, together with
T*(temperatureatrateconstant,k, equal to 1 min
)1
)arein
good agreement and further support the idea that the two-
state irreversible model offers a good explanation of the
TetR denaturation process. The model is also supported by
the observation that the T
max
of dimeric TetR does not
change significantly when the protein concentration is
increased. Such behavior would be expected from a
multimeric protein if its dissociation into monomers does
not take place before the rate-determining step and the
irreversible process shows first-order kinetics [21]. The
average activation energy, estimated to be 414 ± 15 kJÆ
mol
)1
for TetR, is equal to (8.9 ± 0.3) · 10
)3
kJÆmol
)1
after re-counting per gram of protein. This can be compared
with the value of (7.1 ± 5.8) · 10
)3
kJÆmol
)1
per g protein
determined as an average value for several other proteins of
different size, which undergo irreversible denaturation in the
one-step model [40]. The thermal denaturation of TetR was
also monitored by CD measurements; the irreversible rate-
controlled process was fitted to eqn (7) and yielded the T*
parameter and the activation energy for TetR. The values
derived from CD measurements are in reasonable agree-
ment with those obtained from the DSC measurements, and
this independent experimental approach further supports
the proposed model. Because the two-state irreversible
mechanism occurs in the thermally unfolding TetR, one
cannot use equilibrium thermodynamic analysis of
these DSC transitions to estimate the entropy of denatur-
ation and free energy. Nevertheless, the thermal denatura-
tion process of TetR can be described by a denaturation
enthalpy change of 504.9 kJÆmol
)1
, calculated as an
average from the data presented in Tables 1–3.
Protein stability is often defined as the Gibbs free energy
difference (D
D
N
G) between denatured and native states at a
given reference temperature (usually 25 °C). However, for
practical purposes, the denaturation temperature T
max
may
also be a useful measure of protein stability [11,41]. The
mean temperature of TetR denaturation, T
max
,determined
for the protein concentration range 0.4–4.0 mgÆmL
)1
is
60 °C. This value and that for denaturation enthalpy
changes are very close to those determined for the structur-
ally similar protein, cAMP receptor protein (CRP) (61 °C
and 503 kJÆmol
)1
, respectively) [42]. CRP, which has a very
similar molecular mass to TetR, is a homodimeric molecule
with a larger domain responsible for the cAMP binding and
a smaller domain, which possesses HTH structure, respon-
sible for the interactions with DNA sequences [32]. TetR
Ó FEBS 2003 DSC study of tetracycline repressor (Eur. J. Biochem. 270) 4571
undergoes reversible chemically induced denaturation by
urea, with simultaneous dissociation to monomers, charac-
terized by a Gibbs free energy change DG (H
2
O, 25 °C) of
75 kJÆmol
)1
[8]. It has been shown that CRP, which is
structurally similar to TetR, undergoes reversible denatur-
ation by guanidine hydrochloride, characterized by more
rapid dissociation into monomers followed by co-operative
unfolding of CRP monomers. The overall process of CRP
unfolding is characterized at 20 °CbyaDG (H
2
O) of
77.8 kJÆmol
)1
[43,44].
Analysis of the scan rate effect on the DSC transitions of
the TetR–[Mg–Tc]
+
complex shows that at a higher scan
rate the transition temperature, T
max
, approaches a plateau,
which supports the idea that under these conditions
equilibrium thermodynamics may be employed. Indeed,
theoretical simulation has demonstrated that kinetic distor-
tion caused by the irreversible process becomes negligible at
sufficiently high scan rate (precisely at an infinitive scan rate,
1/m ¼ 0) [11,21]. Figure 3 shows no scan rate effect on
transition temperature within the 1.0–2.0 KÆmin
)1
range
and, therefore, equilibrium thermodynamic analysis is
permissible at least to the transition temperature of the
DSC profile (the high temperature side is likely to be
distorted by aggregation). Furthermore, the measured shape
of the thermal transitions becomes more symmetrical with
increasing heating ratio (Fig. 5), and the van’t Hoff
enthalpy approaches calorimetric enthalpy, thereby render-
ing the co-operativity ratio DH/DH
vH
equal to 1 (Table 2).
In similar cases, where the T
max
was independent of scan
rate in the high range of the heating ratio, the irreversible
denaturation of annexin V E17G [25] and human phenyl-
alanine hydrolase and human phenylalanine hydrolase with
L
-Phe [26] was described by application of the equilibrium
thermodynamic analysis.
A two-state reversible model was used to describe the
thermal transition of the complex of wild-type TetR with Tc
(at high scan rate). This model is based on the general
Lumry–Erying model [21], simplified by excluding the
kinetic irreversible step, which is negligible at a scan rate
over 1 KÆmin
)1
:
N
2
Tc
2
!
K
2Tc þ U
2
This two-state model assumes that the total excess heat
capacity is a sum of n independent two-state thermal
transitions. As can be seen in Fig. 5, fitting of one-
transition two-state model seems to be satisfied (Table 4).
Applying the co-operative model to describe CD denatur-
ation profiles of liganded TetR gives as a consequence high
convergence of the experimental curve with the theoretical
one (Fig. 7) and the values obtained for the thermody-
namic parameters are in good agreement with those from
DSC, which strongly supports the validity of the two-state
reversible model.
Analysis of DSC thermograms of TetR–[Mg–Tc]
+
complex as a function of the protein concentration does
not show any significant changes on increasing the complex
concentration. The lack of significant change in T
max
with
concentration of the TetR–[Mg–Tc]
+
complex with accom-
panying DH
cal
/DH
vH
values close to unity can be explained
by this two-state model [11], in which a dimeric TetR
complex undergoes denaturation without simultaneous
dissociation into monomers, followed by protein aggrega-
tion at higher temperature. The reduction in protein stability
in the presence of Tc, observed at higher protein concen-
tration (Fig. 2), may be explained on the basis of the
complete Lumry–Erying model which can be depicted in the
following scheme:
N
2
Tc
2
!
K
2Tc þ U
2
À!
k
D
According to this model, the dimeric native TetR in the
presence of Tc undergoes two-state reversible unfolding
with simultaneous dissociation into monomers U and
ligand loss. The unfolded species thus obtained, U
2
,
undergoes an irreversible alteration to yield a final,
denaturated state D. It is assumed that chemical equilib-
rium between species N
2
Tc
2
and U
2
is always established in
such a way that the differences between the heat capacity
of the unfolded and native state (DC
p
) is negligible, and
that the irreversible step is a first-order kinetic process. It
should also be pointed out that the binding of [Mg–Tc]
+
to TetR causes a dramatic increase in protein stability, as
can be judged by the % 10 °CincreaseinT
max.
The
observed enthalpy of denaturation of TetR in the presence
of [Mg–Tc]
+
is 1005.6 kJÆmol
)1
, twice as high as that
observed for the protein in the absence of ligand
(502.8 kJÆmol
)1
).
Acknowledgement
We thank Professor W. Hillen for supplying us with the E. coli strain
overproducing Tet repressor.
References
1. Hillen, W., Gatz, Ch, Altschmied, L., Schollmeier, K. & Meier, I.
(1983) Control of expression of Tn10-encoded tetracycline
resistance genes. J. Mol. Biol. 169, 707–721.
2. Lederer, T., Takahashi, M. & Hillen, W. (1995) Thermodynamic
analysis of tetracycline-mediated induction of Tet repressor by
quantitative methylation protection assay. Anal. Biochem. 232,
190–195.
3. Hillen, W. & Berens, Ch (1994) Mechanism underlying expression
of Tn10 encoded tetracycline resistance. Annu. Rev. Microbiol. 48,
345–369.
4. Saenger, W., Orth, P., Kisker, C., Hillen, W. & Hinrichs, W.
(2000) The tetracycline repressor-a paradigm for a biological
switch. Angew. Chem. Int. Ed. 39, 2042–2052.
5. Orth, P., Schnappinger, D., Hillen, W., Saenger, W. & Hinrichs,
W. (2000) Structural basis of gene regulation by the tetracycline
inducible Tet repressor-operator system. Nat. Struct. Biol. 7,
215–219.
6. Baron, U., Schnappinger, D., Helbl, V., Gossen, M., Hillen, W. &
Bujard, H. (1999) Generation of conditional mutants in higher
eukaryotes by switching between the expression of two genes.
Proc. Natl. Acad. Sci. USA 96, 1013–1018.
7. Stebbins, M.J., Urlinger, S., Byrne, G., Bello, B., Hillen, W. &
Yin, J.C. (2001) Tetracycline-inducible systems for Drosophila.
Proc. Natl. Acad. Sci. USA 98, 10775–10780.
8. Backes,W.,Berens,Ch,Helbl,V.,Walter,S.,Schmid,F.X.&
Hillen, W. (1997) Combinations of the a-helix –turn–a-helix motif
of TetR with respective residues from LacI or 434Cro: DNA
recognition, inducer binding, and urea-dependent denaturation.
Biochemistry 36, 5311–5322.
4572 S. Ke˛dracka-Krok and Z. Wasylewski (Eur. J. Biochem. 270) Ó FEBS 2003
9. Wagenho
¨
fer, M., Hanses, D. & Hillen, W. (1988) Thermal dena-
turation of engineered Tet repressor proteins and their complexes
with tet operator and tetracycline studied by temperature gradient
gel electrophoresis. Anal. Biochem. 175, 422–432.
10. Freire, E. (1995) Differential scanning calorimetry. Methods Mol.
Biol. 40, 191–218.
11. Sanchez-Ruiz, J.M. (1995) Differential scanning calorimery of
proteins. Subcell. Biochem. 24, 133–176.
12. Freire, E. (2001) The thermodynamic linkage between protein
structure, stability, and function. Methods Mol. Biol. 168, 37–68.
13. Ettner, N., Mu
¨
ller, G., Berens, C.H., Backes, H., Schnappinger,
D., Schreppel, T., Pfleiderer, K. & Hillen, W. (1996) Fast large-
scale purification of tetracycline repressor variants from over-
producing Escherichia coli strains. J. Chromatogr. A 742, 95–105.
14. Ke˛dracka-Krok, S. & Wasylewski, Z. (1999) Kinetic and equili-
brium studies of Tet repressor–operator interaction. J. Protein
Chem. 18, 117–125.
15. Altschmied, L. & Hillen, W. (1984) Tet repressor tet operator
complex formation induces conformational changes in tet
operator DNA. Nucleic Acids Res. 12, 2171–2180.
16. Takahashi, M., Altschmied, L. & Hillen, W. (1986) Kinetic and
equilibrium characterization of Tet repressor–tetracycline complex
by fluorescence measurements. J. Mol. Biol. 187, 341–348.
17. Hillen, W., Klock, G., Kaffenberger, I., Wray, L.V. & Reznikoff,
W.S. (1982) Purification of the Tet repressor and Tet operator
from transposon Tn10 and characterization of their interaction.
J. Biol. Chem. 257, 6605–66013.
18. Perkins, S.J. (1986) Protein volumes and hydration effect. The
calculation of partial specific volume, neutron scattering match-
points and 280-nm absorption coefficients for proteins and gly-
coproteins from amino acid sequences. Eur. J. Biochem. 157,
169–180.
19. Sturtevant, J.M. (1987) Biochemical applications of differential
scanning calorimetry. Annu. Rev. Phys. Chem. 38, 463–488.
20. Takahashi, K. & Sturtevant, J.M. (1981) Thermal denaturation of
Streptomyces subtilisin inhibitor, subtilisin BPN¢,andtheinhi-
bitor–subtilisin complex. Biochemistry 20, 6185–6190.
21. Sanchez-Ruiz, J.M. (1992) Theoretical analysis of Lumry–Eyring
models in differential scanning calorimetry. Biophys. J. 61,
921–935.
22. Freire, E., van Osodol, W.W., Mayorga, O.L. & Sanchez-Ruiz,
J.M. (1990) Calorimetrically determined dynamics of complex
unfolding transitions in protein. Annu. Rev. Biophys. Chem. 19,
159–188.
23. Sanchez-Ruiz, J.M., Lopez-Locomba, J.L., Cortijo, M. & Mateo,
P.L. (1988) Differential scanning calorimetry of the irreversible
thermal denaturation of thermolysin. Biochemistry 27, 1648–1652.
24. Kurganov, B.I., Lyubarev, A.E., Sanchez-Ruiz, J.M. & Shnyrov,
V.L. (1997) Analysis of differential scanning calorimetry data for
proteins. Criteria of validity of one-step mechanism of irreversible
protein denaturation. Biophys. Chem. 69, 125–135.
25.Vogl,T.,Jatzke,C.,Hinz,H J.,Benz,J.&Huber,R.(1997)
Thermodynamic stability of annexin V E17R: equilibrium para-
meters from irreversible unfolding reaction. Biochemistry 36,
1657–1658.
26. Tho
´
ro
´
lfsson, M., Ibarra-Molero, B., Fojan, P., Petersen, S.B.,
Sanchez-Ruiz, J.M. & Martinez, A. (2002) 1-Phenylalanine bind-
ing and domain organization in human phenylalanine hydro-
xylase. A differential scanning calorimetry study. Biochemistry 41,
7573–7585.
27. Cantor, C.R. & Schimmel, P.R. (1980) Biophysical Chemistry.
W.H. Freedman & Company, New York.
28. Hinrichs,W.,Kisker,C.,Du
¨
vel, M., Mu
¨
ller, A., Tovar, K., Hillen,
W. & Saenger, W. (1994) Structure of the Tet repressor–tetra-
cycline complex and regulation of antibiotic resistance. Science
264, 418–420.
29. Orth, P., Cordes, F., Schnappinger, D., Hillen, W., Saenger, W. &
Hinrchs, W. (1998) Conformational changes of the Tet repressor
induced by tetracycline trapping. J. Mol. Biol. 279, 439–447.
30. Kaszycki, P., Guz, A., Drwieˆ ga, M. & Wasylewski, Z. (1996) Tet
repressor–tetracycline interaction. J. Protein Chem. 15, 607–619.
31. Antonioni, P.S., Hillen, W., Ettner, N., Hinrich, W., Fantucci, P.,
Doglia, S.M., Bousquet, J A. & Chabbert, M. (1997) Molecular
mechanics analysis of Tet repressor Trp-43 fluorescence. Biophys.
J. 72, 1800–1811.
32. Krafft, C., Hinrichs, W., Orth, P., Saenger, W. & Welfle, H. (1998)
Interaction of Tet repressor with operator DNA and with tetra-
cycline studied by infrared and Raman spectroscopy. Biophys. J.
74, 63–71.
33. Mu
¨
ller, G., Hecht, B., Helbl, V., Hinrichs, W., Saenger, W. &
Hillen, W. (1995) Characterization of non-inducible Tet repressor
mutants suggests conformational changes necessary for induction.
Nat. Struct. Biol. 2, 693–703.
34. Milardi, D., La Rosa, C. & Grasso, D. (1994) Extended theoretical
analysis of irreversible protein thermal unfolding. Biophys. Chem.
52, 183–189.
35. Lyubarev, A.E. & Kurganov, B.I. (1998) Modeling thermal pro-
tein denaturation at varying temperature. I. The model involving
two consecutive irreversible steps. Biochemistry (Moscow) 63,
434–440.
36. Kreimer, D.I., Shnyrov, V.L., Villar, E., Silman, I. & Weiner, L.
(1995) Irreversible thermal denaturation of Torpedo Californica
acetylocholinesterase. Protein Sci. 4, 2349–2357.
37. Shnyrov, V.L., Martinez, L.D., Roig, M.G., Lyubarev, A.E.,
Kurganov, B.I. & Villar, E. (1999) Irreversible thermal dentura-
tion of lipase B from Candida rugosa. Thermochimica Acta 325,
143–149.
38. Lyubarev, A.L., Kurganov, B.I., Orlov, V.N. & Zhou, H M.
(1999) Two-state irreversible thermal denaturation of muscle
creatine kinase. Biophys. Chem. 79, 199–204.
39. Pina, D.G., Shnyrova, A.V., Gavilanes, F., Rodriguez, A., Leal,
F., Roig, M.G., Sakharov, I.Y., Zhadan, G.G., Villar, E. &
Shnyrov, V.L. (2001) Thermally induced conformational changes
in horseradish peroxidase. Eur. J. Biochem. 268, 120–126.
40. Lyubarev, A.E. & Kurganov, B.I. (2000) Analysis of DSC relating
to proteins undergoing irreversible thermal denaturation.
J. Thermal Anal. Calorimetry 62, 51–62.
41. Plaza del Pino, I.M., Ibarra-Molero, B. & Sanchez-Ruiz, J.M.
(2000) Lower kinetic limit to protein thermal stability: a proposal
regarding protein stability in vivo and its relation with misfolding
diseases. Proteins 40, 58–70.
42. Błaszczyk, U. & Wasylewski, Z. (2003) Interaction of cAMP
receptor protein from Escherichia coli with cAMP and DNA
studied by differential scanning calorimetry. J. Protein Chem. 22,
285–293.
43. Harman, J.G. (2001) Allosteric regulation of cAMP receptor
protein. Biochim. Biophys. Acta 1547, 1–17.
44. Małecki, J. & Wasylewski, Z. (1997) Stability and kinetics of
unfolding and refolding of cAMP receptor protein from Escher-
ichia coli. Eur. J. Biochem. 243, 660–669.
Ó FEBS 2003 DSC study of tetracycline repressor (Eur. J. Biochem. 270) 4573