Báo cáo khoa học: " What can nuclear microsatellites tell us about maritime pine genetic resources conservation and provenance certification strategies" pptx
Bạn đang xem bản rút gọn của tài liệu. Xem và tải ngay bản đầy đủ của tài liệu tại đây (225.3 KB, 10 trang )
J. Derory et al.Genetic diversity in P. pinaster
Original article
What can nuclear microsatellites tell us about maritime pine genetic
resources conservation and provenance certification strategies?
Jérémy Derory
a
, Stéphanie Mariette
a,b
, Santiago C. Gonzaléz-Martínez
c
, David Chagné
a
,
Delphine Madur
a
, Sophie Gerber
a
, Jean Brach
a
, François Persyn
d
, Maria M. Ribeiro
e
and Christophe Plomion
a*
a
INRA, Équipe de Génétique et Amélioration des Arbres Forestiers, 69 route d’Arcachon, 33612 Cestas Cedex, France
b
Cemagref, Domaine des Barres, 45290 Nogent-sur-Vernisson, France
c
CIFOR-INIA, Department of Breeding and Biotechnology, P.O. Box 8111, 28080 Madrid, Spain
d
Services Espaces Verts, 62520 Le Touquet, France
e
Escola Superior Agrária, Dep de Silvicultura e Recursos Naturais, Quinta da Senhora de Mércules, Apdo 119, 6001-909 Castelo Branco, Portugal
(Received 16 August 2001; accepted 13 March 2002)
Abstract – Maritime pine (Pinus pinaster Ait.) is the first conifer used for reforestation in France and now covers 2.4 million ha of the Iberian
Peninsula. In order to preserve the genetic resources of this economically and ecologically important species prior knowledge of the distribution
of genetic diversity is needed. In this paper, a genetic diversity study was performed using nuclear simple sequence repeats (SSRs or microsatel-
lites). Classical parameters of diversity (allelic richness and heterozygosity) and differentiation were estimated for 47 populations of P. pinaster.
Most of the populations (40) were collected in France, six populations were also collected in the Iberian Peninsula and one Moroccan population
was also included in the study. The population genetic parameters indicated that some populations should be a focus of conservation efforts (hig-
her level of diversity, higher allelic richness and presence of rare alleles). A diagnostic test for sample origin was developed to distinguish Corsi-
can from Landes populations.
Pinus pinaster / nuclear microsatellites / genetic diversity / conservation / provenance identification
Résumé – Que nous indiquent les microsatellites nucléaires sur la conservation des ressources génétiques du pinmaritimeetsurlesstra
-
tégies de certification de provenances ? Le pin maritime (Pinus pinaster Ait.) est le premier conifère utilisé pour le reboisement en France et
couvre environ 2,4 millions d’hectares dans la péninsule Ibérique. Dans le but de conserver les ressources génétiques de cette espèce, importante
du point de vue économique et écologique, une connaissance préalable de la distribution de sa diversité génétique est nécessaire. Dans ce papier,
une étude de diversité génétique a été menée en utilisant des marqueurs microsatellites. Les paramètres classiques de diversité (richesse allélique
et hétérozygotie) et de différenciation ont été calculés au sein de 47 populations. La plupart des populations (40) ont été échantillonnées en
France, six populations ont été choisies dans laPéninsule Ibérique et une population marocaine a également été incluse dans l’analyse. Les résul
-
tats de génétique des populations montrent que certaines populations pourraient être intéressantes pour la conservation des ressources génétiques
de l’espèce (niveau d’hétérozygotie ou de richesse allélique plus élevée que les autres populations, présence d’allèles rares). Nous avons montré
que les résultats de cette analyse fournissent untestdiagnosticpourdistinguer les populations d’origine landaise des populations d’origine corse.
Pinus pinaster / microsatellites nucléaires / diversité génétique / conservation / certification de provenance
1. INTRODUCTION
Pinus pinaster Ait. occurs naturally in southwestern Eu
-
rope (France, Portugal, Spain and Italy) and northwestern Af
-
rica (Algeria, Tunisia and Morocco) (Farjon, [9]). Its distri
-
bution is discontinuous due to geographic isolation of popu
-
lations and to the ancient human impact in the Mediterranean
Basin. The rangewide genetic diversity of maritime pine is of
Ann. For. Sci. 59 (2002) 699–708 699
© INRA, EDP Sciences, 2002
DOI: 10.1051/forest:2002058
* Correspondence and reprints
Tel.: +33 5 57 12 28 38; fax: +33 5 57 12 28 81; e-mail:
interest for ecologic and economic reasons. In a large part due
to its economic importance as a plantation species, genetic re
-
sources of P. pinaster are now threatened. In France, 15 000
ha of improved seedlings are planted each year in the
south-west and the introduction of improved material may
modify the distribution of genetic diversity of the species.
Secondly, the introduction of seeds from other geographical
regions may alter the local genetic structure of the species
and may constitute populations that are not adapted to the lo
-
cal environment, as occurred when Portuguese seeds were in
-
troduced in the south-west of France (Boisseaux [5]). In areas
such as the Iberian Peninsula, stands of P. pinaster are under
a strong human impact through recurrent forest fires and re
-
forestation with seedlings of unknown origin (Ribeiro et al.
[21]). Southeastern and Corsican populations are affected by
the spread of the bast scale Matsucoccus feytaudi Duc (Jactel
et al. [14]; Jactel et al. [15]). Also, mediterranean popula
-
tions typically display low effective population sizes in con
-
trast with “atlantic” populations (Landes, Portugal, Galicia);
such that loss of genetic diversity may be more prevalent in
these populations.
To preserve the genetic diversity of P. pinaster, a conser-
vation strategy is being planned and identification tests are to
be developed to detect allochtonous seed flow in populations.
Prior knowledge of the geographical distribution of genetic
diversity level is needed for this purpose.
The genetic and phenotypic variation of P. pinaster has
been studied using various methods. Intraspecific phenotypic
variation of P. pinaster has been investigated in numerous
provenance trials establishedin different countries (Alía et al.
[1]; Alía et al. [2]; Harfouche and Kremer [13]). Those field
experiments have shown that morphological and adaptative
traits vary significantly among provenances and, generally, a
significant genotype-environment interaction is observed
(Alía et al. [2]). Several range-wide genetic diversity surveys
have been carried out using terpenes, isozymes, denaturated
proteins and chloroplast microsatellites (Baradat and
Marpeau-Bezard [4]; Bahrman et al. [3]; Petit et al. [19];
Vendramin et al. [25]). Recent studies have been undertaken
at a regional level using isozymes, AFLP markers (Amplified
Fragment Length Polymorphisms), nuclear and chloroplast
microsatellite markers (Salvador et al. [24];
González-Martínez et al. [11]; Mariette et al. [18]; Ribeiro et
al. [21]). A test based on chloroplast microsatellites has very
recently been developed in order to determine the putative or
-
igin of P. pinaster stands in the Aquitaine region of France
(Ribeiro et al. [22]). This test gives faster and more accurate
results than the previous terpene-based test developed by
Baradat and Marpeau-Bezard [4].
In this paper, forty-seven populations of P. pinaster (forty
from France, four from Spain, two from Portugal and one
from Morocco) were analysed with three nuclear simple se
-
quence repeats (SSRs or microsatellites). This marker type
was used in preference to isozymes or dominant markers as
its high rate of polymorphism is particularly useful for detec
-
tion of allelic richness within populations. The main objec
-
tive of this study was to synthetize patterns found for nuclear
SSRs with previously published results (Mariette et al. [18]).
We discus the effectiveness of microsatellites to define con
-
servation strategies in the species and described a test for
seed origin identification developed from nuclear SSR data.
2. MATERIALS AND METHODS
2.1. Plant material and DNA analysis
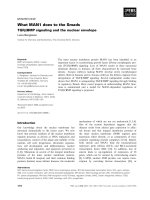
Forty-seven populations of P. pinaster were used in the present
study; their name and location are listed in table I. Their location in
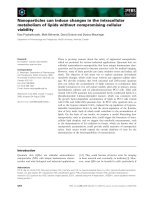
the natural range of P. pinaster is given in figure 1. From each popu
-
lation, 30 individuals were sampled. Sixteen populations from
France sampled in the west, in the centre and in the south-east were
studied. In addition, data from 23 P. pinaster populations from
France for the same SSR loci [thirteen from the south-west of France
(Aquitaine) and ten from Corsica] analysed in a previous study were
included (Mariette et al. [18]). A putative Corsican population
(Devinas), introduced in the Aquitaine region 35 years ago, was also
analysed. Finally, four populations from Spain (Coca, Cómpeta,
Boniches and Cazorla), two from Portugal (Oleiros and Leiria) and
one from Morocco were used.
The DNA was extracted from needles according to the Doyleand
Doyle [7] protocol and amplification of nuclear microsatellites was
performed as described by Mariette et al. [17]. Three SSRs (coded
FRPP91, FRPP94 and ITPH4516) were used.
2.2. Genetic diversity statistical analysis
Principal component analysis (PCA) was used to retrieve infor-
mation about the clustering pattern of the analysed populations.
PCA was performed based on the allele frequencies of the seven
most frequent alleles, for each microsatellite.
For each locus, the allelic richness (number of alleles, A), the
allelic frequencies, the observed heterozygosity (H
O
), the expected
heterozygosity (H
E
), and the fixation index [F
IS
=1–(H
O
/H
E
)] were
calculated as described by Brown and Weir [6]. These parameters
were estimated per population and for each geographical group of
populations detected with the PCA (West of France, South-East of
France, Iberian Peninsula), separately. The means over the three loci
were calculated.
700 J. Derory et al.
South West of France
13 populations
+ Devinas population
Portugal
2 populations
Spain
4 populations
Morocco
1 population
West of France
10 populations
Corsica
10 populations
South East of France
6 populations
Figure 1. Location of studied populations of P. pinaster.
Values of genetic differentiation, F
ST
, were estimated following
Weir and Cockerham [26]. However, as microsatellites can be as
-
sumed to evolve following a Stepwise Mutation Model, ρ
ST
values
were also estimated following Rousset [23]. These parameters were
calculated among all populations within each geographical group
and among all the populations. The significance of the differentia
-
tion between pairs of populations was tested following Raymond
and Rousset [20].
2.3. Test for provenance identification
Mariette et al. [18] showed that, for one of the microsatellites
(FRPP91), one allele (allele number 13, absolute size 173 bp) dis
-
played divergent frequencies in the Corsican and the Aquitaine
provenances (0.680 and 0.004, respectively). Furthermore, the dif
-
ferentiation between the two provenances (F
ST
= 0.184) was high
and significantly different from 0.
Ribeiro et al. [22] developed a statistical test on chloroplast
microsatellites to determine the putative origin (French versus
Northwest Iberic) of forest stands sampled in Aquitaine region of
France. The same approach was used in the present study with the
nuclear microsatellite data set in order to develop a test to distin
-
guish Corsican from Aquitaine populations. For this purpose, the
Devinas population, recently introduced in Aquitaine, was used as
the population to be tested. The test performed with each
microsatellite locus separately, and with all the loci combined to-
gether, was adapted to diploid data as follows (for details see
Ribeiro et al. [22]):
(1) a null hypothesis was drawn: “H
0
: the tested sample (Devinas)
belongs to the Aquitaine population” and the alternative hypothesis
was “H
1
: the tested sample (Devinas) belongs to theCorsica popula-
tion”;
(2) a statistic was built with the allelic frequencies of each locus or
all together:
Sxx
kij
R
j
n
i
r
ij
k
=
==
∑∑
(–)
11
2
;
(3) this formula was used to obtain the distribution of the null and
the alternative hypotheses, where r is the total number of studied
loci (r =1orr = 3), n is the total number of alleles at the ith locus
found in the Aquitaine and the Corsican groups of populations,
x
ij
R
is
the frequency of the jth allele at the ith locus in the reference popula
-
tion (chosen as the Aquitaine group of populations) and
x
ij
k
is the fre
-
quency of the jth allele at the ith locus in a sample k from the
Aquitaine group of populations (to obtain H
0
)or
x
ij
k
is the frequency
of the jth allele at the ith locus in a sample k from the Corsican group
of populations (to obtain H
1
); the size of each sample k that was used
in bootstraps was 30;
(4) the distribution of S
k
for the null and alternative hypothesis was
obtained by repeating 10 000 times the calculation (k = 1 to 10 000);
(5) the decision of either accepting or rejecting the null hypothesis
was made by comparing the value of the statistics for the tested sam
-
ple (Devinas), S
D
, with the values of S for H
0
and H
1
.
3. RESULTS
3.1. Population genetic diversity analysis at each locus
At the population level, the three analysed loci showed
heterogeneous levels of diversity and fixation index values.
FRPP91 showed a high level of heterozygosity and allelic
Genetic diversity in P. pinaster 701
Table I. List of the studied P. pinaster populations.
Data file
number
Population Id Population name Location
1 Aq1 Lit-et-Mixe Aquitaine (France)
2 Aq2 St-Julien-en-Born Aquitaine (France)
3 Aq3 Boulevard des Allemands Aquitaine (France)
4 Aq4 Ste-Eulalie-en-Born Aquitaine (France)
5 Aq5 Mimizan Aquitaine (France)
6 Aq6 Vielle-St-Girons Aquitaine (France)
7 Aq7 Domaniale de Biscarosse Aquitaine (France)
8 Aq8 Usagère de Biscarosse Aquitaine (France)
9 Aq9 Lège Aquitaine (France)
10 Aq10 Lacanau Aquitaine (France)
11 Aq11 Pointe de Grave Aquitaine (France)
12 Aq12 Carcans Aquitaine (France)
13 Aq13 Hourtin Aquitaine (France)
14 Co1 Pineto Corse (France)
15 Co2 Restonica Corse (France)
16 Co3 Ominanda Corse (France)
17 Co4 Tova Corse (France)
18 Co5 Cagna Corse (France)
19 Co6 Aullene Corse (France)
20 Co7 Pinia Corse (France)
21 Co8 Bonifatu Corse (France)
22 Co9 Vero Corse (France)
23 Co10 Ventilegne Corse (France)
24 Devinas Devinas Corse in Landes
25 Go1 St Trojan West of France
26 Go2 Olonne West of France
27 Go3 St Jean West of France
28 Go4 Erdeven West of France
29 Go5 Pleucadec West of France
30 Go6 Brain West of France
31 Go7 Pompogne West of France
32 Go8 Vieille Brioude West of France
33 Go9 Aubazines West of France
34 Go10 Le Touquet West of France
35 Se1 Maures South East of France
36 Se2 Alpes Maritimes South East of France
37 Se3 Var South East of France
38 Se4 Esterel South East of France
39 Se5 Gard South East of France
40 Se6 Corbières South East of France
41 Sp1 Coca Spain
42 Sp2 Cómpeta Spain
43 Sp3 Boniches Spain
44 Sp4 Cazorla Spain
45 Po1 Oleiros Portugal
46 Po2 Leiria Portugal
47 Mor Morocco Morocco
richness but a low mean level of fixation index (table II)
whereas FRPP94 revealed a limited level of diversity and a
higher fixation index than FRPP91 (table III). Finally,
ITPH4516 showed a high level of heterozygosity and allelic
richness but generally revealed a significant positive fixation
index within populations (table IV).
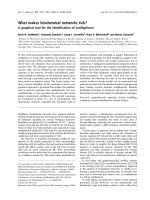
3.2. Principal Component Analysis grouping
of populations
Based on the PCA (figure 2) the P. pinaster populations
were clustered into three main groups. One group (No. 1 or
“west of France group”) composed with populations from
Aquitaine, West of France, Gard and Corbières, group 2 (or
“south east of France group”) composed with Corsican popu
-
lations and four south east of France populations (Maures,
Alpes Maritimes, Var and Esterel), and group 3 clustering
populations from the Iberian Peninsula (Spain and Portugal)
and Morocco. Clusteringthe Portuguese populations in group
3 was done for geographical reasons, for they could have
been grouped in “west of France group”, No. 1, instead.
The first component explained 34% of the total variance
and the secondcomponent explained 12%. In the first compo-
nent the highest correlation was obtained with the frequency
of the discriminant allele found between Corsican and
Aquitaine populations, at the locus FRPP91 (r = –0.900). The
frequency of this allele was 0.015, 0.579, 0.035, and 0.135 in
group 1, 2, the Iberian and the Moroccan populations, respec-
tively.
3.3. Within and among geographical groups diversity
analysis
Based on the results obtained with the PCA and the geo
-
graphical distribution of the populations, genetic analyses
were undertaken for the three groups of populations. When
H
E
and H
0
were considered, the highest levels of diversity
were found in group 3 (Moroccan and Iberian populations).
In addition, levels of diversity tended to be higher in the
“west of France group” than in the “south east of France
group” (table V). However, these results were not significant.
At the population level, A
P
was the higher in the populations
from the “west of France group” and in the Iberian Peninsula.
However, the number of rare alleles was higher in the “south
east of France group”, especially in Corsica, than in the other
groups (data not shown).
The mean fixation index (F
IS
) was higher in the popula
-
tions belonging to the group 2 than in the other groups
(tables II–V). Finally, as indicated by the levels of F
ST
in ta
-
ble V, populations from the “south east of France group” were
more differentiated among them (0.066) in comparison with
the differentiation found among the populations from the
“west of France group” (0.016) and among the group 3 popu
-
lations (0.030). ρ
ST
values indicated similar tendencies
(0.031 among the group 1 populations, 0.061 among the
702
J. Derory et al.
Table II. FRPP91 genetic diversity statistics in each population of
P. pinaster.
Population Id H
O
Sd(H
O
) H
E
Sd(H
E
) F
IS
A
Aq1 0.933 0.045 0.819 0.024 –0.162 12
Aq2 0.933 0.045 0.862 0.024 –0.103 18
Aq3 0.897 0.057 0.806 0.029 –0.134 12
Aq4 0.613 0.087 0.819 0.022 0.243 11
Aq5 0.821 0.072 0.815 0.023 –0.026 11
Aq6 0.724 0.083 0.750 0.027 0.018 7
Aq7 0.750 0.077 0.813 0.019 0.065 11
Aq8 0.810 0.086 0.830 0.033 0.001 12
Aq9 0.793 0.075 0.795 0.024 –0.014 9
Aq10 0.917 0.056 0.803 0.023 –0.169 9
Aq11 0.767 0.077 0.814 0.019 0.043 10
Aq12 0.793 0.075 0.766 0.035 –0.055 12
Aq13 0.750 0.082 0.856 0.022 0.110 13
Co1 0.417 0.101 0.431 0.091 0.014 12
Co2 0.400 0.098 0.442 0.087 0.077 9
Co3 0.227 0.089 0.426 0.092 0.459 7
Co4 0.333 0.096 0.454 0.087 0.254 8
Co5 0.375 0.099 0.595 0.072 0.361 7
Co6 0.409 0.105 0.480 0.086 0.132 7
Co7 0.435 0.103 0.504 0.089 0.120 10
Co8 0.696 0.096 0.612 0.071 –0.166 8
Co9 0.783 0.086 0.713 0.063 –0.125 9
Co10 0.280 0.090 0.442 0.087 0.359 9
Devinas 0.644 0.071 0.655 0.050 0.005 10
Go1 0.900 0.055 0.833 0.024 –0.100 12
Go2 0.933 0.045 0.825 0.023 –0.153 10
Go3 0.733 0.081 0.781 0.029 0.046 13
Go4 0.750 0.082 0.879 0.020 0.134 16
Go5 0.769 0.083 0.813 0.034 0.036 11
Go6 0.821 0.072 0.791 0.030 –0.057 10
Go7 0.731 0.087 0.835 0.029 0.110 13
Go8 0.654 0.093 0.834 0.033 0.204 16
Go9 0.571 0.094 0.872 0.020 0.337 15
Go10 0.885 0.063 0.836 0.023 –0.080 11
Se1 0.600 0.098 0.698 0.058 0.125 11
Se2 0.840 0.073 0.804 0.033 –0.067 11
Se3 0.875 0.068 0.807 0.037 –0.109 13
Se4 0.864 0.073 0.738 0.042 –0.203 9
Se5 0.739 0.092 0.824 0.035 0.085 13
Se6 0.870 0.070 0.883 0.023 –0.007 15
Sp1 0.900 0.055 0.894 0.017 –0.023 15
Sp2 0.767 0.077 0.923 0.010 0.158 19
Sp3 0.893 0.058 0.905 0.009 –0.004 13
Sp4 0.933 0.045 0.902 0.013 –0.053 16
Po1 1.000 0.000 0.864 0.028 –0.196 12
Po2 0.842 0.084 0.852 0.020 –0.015 9
Mor 0.958 0.041 0.875 0.019 –0.121 11
Mean 0.730 – 0.757 – 0.029 11.43
See references of parameters in the text.
Genetic diversity in P. pinaster 703
Table III. FRPP94 genetic diversity statistics in each population of
P. pinaster.
Population Id H
O
Sd(H
O
) H
E
Sd(H
E
) F
IS
A
Aq1 0.621 0.090 0.611 0.051 –0.034 7
Aq2 0.462 0.098 0.628 0.054 0.254 6
Aq3 0.556 0.096 0.634 0.054 0.109 7
Aq4 0.310 0.086 0.618 0.035 0.493 6
Aq5 0.556 0.096 0.643 0.050 0.122 7
Aq6 0.429 0.094 0.648 0.046 0.331 7
Aq7 0.536 0.094 0.603 0.046 0.097 5
Aq8 0.579 0.113 0.643 0.055 0.077 7
Aq9 0.483 0.093 0.600 0.037 0.185 6
Aq10 0.688 0.116 0.582 0.047 –0.226 5
Aq11 0.731 0.087 0.700 0.038 –0.066 8
Aq12 0.679 0.088 0.624 0.037 –0.109 7
Aq13 0.407 0.095 0.607 0.059 0.320 8
Co1 0.864 0.073 0.788 0.021 –0.124 6
Co2 0.667 0.096 0.745 0.026 0.088 6
Co3 0.591 0.105 0.771 0.040 0.220 9
Co4 0.500 0.102 0.839 0.024 0.396 12
Co5 0.625 0.099 0.731 0.033 0.129 6
Co6 0.444 0.117 0.741 0.037 0.390 7
Co7 0.773 0.089 0.830 0.020 0.048 8
Co8 0.682 0.099 0.704 0.034 0.009 6
Co9 0.875 0.068 0.729 0.033 –0.231 7
Co10 0.545 0.106 0.646 0.074 0.139 9
Devinas 0.689 0.069 0.774 0.026 0.101 11
Go1 0.600 0.089 0.553 0.033 –0.105 4
Go2 0.633 0.088 0.629 0.037 –0.024 6
Go3 0.700 0.084 0.600 0.044 –0.190 7
Go4 0.393 0.092 0.543 0.041 0.267 4
Go5 0.586 0.091 0.579 0.033 –0.030 6
Go6 0.600 0.089 0.690 0.035 0.118 7
Go7 0.778 0.080 0.673 0.048 –0.181 10
Go8 0.448 0.092 0.660 0.047 0.313 8
Go9 0.714 0.085 0.691 0.037 –0.054 8
Go10 0.667 0.091 0.645 0.039 –0.054 7
Se1 0.826 0.079 0.847 0.017 0.003 9
Se2 0.913 0.059 0.810 0.029 –0.156 10
Se3 0.714 0.099 0.840 0.024 0.132 10
Se4 0.680 0.093 0.863 0.019 0.200 13
Se5 0.600 0.110 0.670 0.051 0.084 7
Se6 0.550 0.111 0.580 0.072 0.029 6
Sp1 0.667 0.086 0.761 0.029 0.111 7
Sp2 0.667 0.086 0.773 0.025 0.125 9
Sp3 0.741 0.084 0.781 0.038 0.035 8
Sp4 0.667 0.086 0.767 0.033 0.118 7
Po1 0.667 0.111 0.690 0.049 0.007 6
Po2 0.526 0.115 0.611 0.042 0.118 4
Mor 0.667 0.136 0.806 0.042 0.144 8
Mean 0.623 – 0.691 – 0.079 7.32
See references of parameters in the text.
Table IV. ITPH4516 genetic diversity statistics in each population of
P. pinaster.
Population Id H
O
Sd(H
O
) H
E
Sd(H
E
) F
IS
A
Aq1 0.714 0.085 0.848 0.025 0.144 11
Aq2 0.724 0.083 0.835 0.028 0.119 13
Aq3 0.759 0.079 0.812 0.025 0.051 11
Aq4 0.567 0.090 0.812 0.021 0.294 9
Aq5 0.893 0.058 0.830 0.019 –0.097 9
Aq6 0.767 0.077 0.834 0.026 0.067 13
Aq7 0.800 0.073 0.840 0.023 0.032 11
Aq8 0.714 0.099 0.921 0.010 0.210 16
Aq9 0.846 0.071 0.898 0.018 0.040 17
Aq10 0.773 0.089 0.888 0.018 0.113 14
Aq11 0.640 0.096 0.799 0.035 0.186 11
Aq12 0.679 0.088 0.895 0.015 0.232 14
Aq13 0.759 0.079 0.865 0.025 0.110 16
Co1 0.696 0.096 0.817 0.019 0.132 7
Co2 0.926 0.050 0.702 0.046 –0.351 7
Co3 0.522 0.104 0.601 0.067 0.115 6
Co4 0.652 0.099 0.850 0.020 0.219 11
Co5 0.417 0.101 0.800 0.040 0.474 10
Co6 0.524 0.109 0.764 0.034 0.303 9
Co7 0.667 0.136 0.705 0.084 0.015 8
Co8 0.435 0.103 0.558 0.074 0.207 8
Co9 0.556 0.117 0.810 0.038 0.301 10
Co10 0.619 0.106 0.821 0.027 0.232 11
Devinas 0.622 0.072 0.747 0.037 0.159 12
Go1 0.767 0.077 0.866 0.017 0.101 13
Go2 0.833 0.068 0.853 0.020 0.007 11
Go3 0.733 0.081 0.762 0.042 0.022 12
Go4 0.714 0.085 0.881 0.023 0.177 17
Go5 0.786 0.078 0.834 0.035 0.041 14
Go6 0.655 0.088 0.797 0.035 0.166 15
Go7 0.704 0.088 0.907 0.017 0.213 18
Go8 0.630 0.093 0.871 0.020 0.267 13
Go9 0.552 0.092 0.813 0.033 0.314 13
Go10 0.655 0.088 0.832 0.029 0.201 15
Se1 0.571 0.108 0.800 0.045 0.274 12
Se2 0.348 0.099 0.807 0.025 0.565 8
Se3 0.727 0.095 0.833 0.039 0.109 15
Se4 0.318 0.099 0.832 0.029 0.614 11
Se5 0.636 0.103 0.889 0.016 0.273 15
Se6 0.667 0.103 0.907 0.017 0.252 17
Sp1 0.867 0.062 0.873 0.014 –0.010 12
Sp2 0.767 0.077 0.844 0.026 0.078 14
Sp3 0.889 0.060 0.840 0.025 –0.080 11
Sp4 0.900 0.055 0.870 0.021 –0.053 13
Po1 0.727 0.134 0.818 0.032 0.074 7
Po2 0.625 0.171 0.664 0.083 0.000 4
Mor 1.000 0.000 0.770 0.066 –0.413 8
Mean 0.688 – 0.817 – 0.138 11.74
See references of parameters in the text.
group 2 populations and 0.010 among the group 3 popula
-
tions).
3.4. Genetic differentiation between provenance
groups
The highest among provenances differentiation was found
between group 1 and 2, as indicated by F
ST
and ρ
ST
values:
0.071 and 0.106, respectively (table VI). Group 2 was signifi
-
cantly differentiated from the group 3 of populations
(F
ST
= 0.044 and ρ
ST
= 0.081), whereas the differentiation be
-
tween the west of France group and the group 3 of popula
-
tions (F
ST
= 0.018 and ρ
ST
= 0.017) had a much lower value,
while significantly different from 0.
Differentiation was highly significant for all pairs of
groups (all cases P < 0.0000).
3.5. Use of nuclear microsatellites to distinguish
Corsican from Aquitaine populations
The frequency of the discriminant allele at the locus
FRPP91 in the Devinas population was 0.550, very close
from the frequency found in the Corsican populations
(0.660). This indicated that Devinas could be classified as a
Corsican population. Moreover, the differentiation found be
-
tween Devinas and the Corsican populations was not signifi
-
cantly different from 0.
704
J. Derory et al.
Mor
Po2
Po1
Sp4
Sp3
Sp2
Sp1
Se6
Se5
Se4
Se3
Se2
Se1
Go10
Go9
Go8
Go7
Go6
Go5
Go4
Go3
Go2
Go1
Devinas
Co10
Co9
Co8
Co7
Co6
Co5
Co4
Co3
Co2
Co1
Aq13
Aq12
Aq11
Aq10
Aq9
Aq8
Aq7
Aq6
Aq5
Aq3
Aq2
Aq1
-4
-2
0
2
4
6
8
-6 -4 -2 0 2 4 6
First component: 34% of the total variance
Second component: 12% of the total variance
Figure 2. Principal component analysis on the 47 populations of P. pinaster.
Table V. Genetic diversity statistics for microsatellite loci in geographical groups of P. pinaster.
Geographical group A
P
Sd(A
P
) H
O
Sd(H
O
)
H
E
P
Sd(
H
E
P
)
F
IS
P
Sd(
F
IS
P
) F
ST
ρ
ST
West (group 1) 10.75 1.41 0.695 0.068 0.766 0.021 0.075 0.104 0.016 0.031
South east (group 2) 9.20 1.67 0.608 0.107 0.710 0.074 0.132 0.125 0.066 0.061
I. Peninsula (group 3) 10.33 2.94 0.792 0.068 0.826 0.055 0.022 0.068 0.033 0.010
See references of parameters in the text.
Table VI. Genetic differentiation (F
ST
and ρ
ST
) between geograph
-
ical groups of P. pinaster.
West
(group 1)
South east
(group 2)
South east
(group 2)
F
ST
= 0.071
ρ
ST
= 0.106
–
Iberian Peninsula
(group 3)
F
ST
= 0.018
ρ
ST
= 0.017
F
ST
= 0.044
ρ
ST
= 0.081
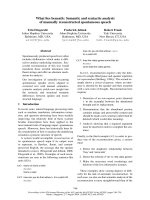
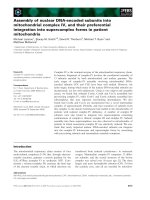
When the statistics test was constructed with the three
microsatellites, the S statistics of the Devinas population was
found to be 0.99. The comparison of this value with the S
distributions of Corsican and Aquitaine groups of popula
-
tions revealed that Devinas was originated from Corsica (fig
-
ure 3A). The use of only one microsatellite gave a similar
result, both for FRPP91 (figure 3B) and ITPH4516
(figure3D). However, in the case of FRPP94, despite the fact
that the two S distributions of Corsican and Aquitaine groups
of populations were distinct, the test did not allow to attribute
the Devinas population to Corsica (figure 3C). In conclusion,
the information given by locus FRPP91 or by locus
ITPH4516 was sufficient to clarify the origin of the Devinas
population.
4. DISCUSSION
4.1. Geographical genetic differentiation of P. pinaster
Based on terpene markers, palynological and paleo
-
climatological records, Baradat and Marpeau-Bezard [4] dis
-
criminated three major groups of P. pinaster: the “Atlantic
group”, comprising populations from southwestern France,
Portugal and Galicia in Spain; the “Mediterranean group”,
extending from central Spain to the Ligurian coast in Italy;
and finally the “North African” group that includes stands
from Morocco, Algeria and Tunisia. In another study,
Bahrman et al. [3] included eastern Spain in the “Atlantic
group”.
Genetic diversity in P. pinaster 705
A
B
C D
Figure 3. A. S distribution at the three locus for the Corsican and the Aquitaine provenances, and location of the statistics S
D
of Devinas popula
-
tion. B. S distribution at the locus FRPP91 for the Corsican and the Aquitaine provenances, and location of the statistics S
D
of the Devinas popu
-
lation. C. S distribution at the locus FRPP94 for the Corsican and the Aquitaine provenances, and location of the statistics S
D
of the Devinas
population. D. S distribution at the locus ITPH4516 for the Corsican and the Aquitaine provenances, and location of the statistics S
D
of the
Devinas population.
In our study, three major groups of populations were dis
-
criminated based on the PCA: group 1 comprising popula
-
tions from the west of France, (including Gard and
Corbières), group 2comprising Corsica and populations from
the south east of France (Maures, Alpes Maritimes, Var and
Esterel), and group 3 comprising populations from Portugal,
Spain and Morocco. Group 1 was highly differentiated from
group 2, but group 1 was only slightly differentiated from
group 3. These results suggest that the Spanish populations
could be included in the “Atlantic group” rather than the
“Mediterranean group”. This conclusion was also supported
by a wide-range study using mitochondrial data (Burban, per
-
sonal communication). However, it is important to stress that
the populations from Portugal were closer to the western
French populations than to the Spanish populations used in
the present study. Previous studies with allozymes did not al
-
low differentiation between Portuguese and Spanish origins
(Salvador et al. [24]). The use of nuclear SSRs could be a
promising tool to discriminate between seedlots from Portu
-
guese provenances and Mediterranean provenances from
central Spain.
An unexpected result was that the Moroccan population
was not differentiated from the “Atlantic group”. This popu-
lation might have been originated with seed coming from the
“Atlantic group”, as confirmed by a study made with cpSSR
(Vendramin, personal communication). However, this clus-
tering of the Moroccan provenance should be cheked by us-
ing a broader number of populations from this region.
Moreover, when the FRPP91 locus discriminant allele was
considered, its frequency in the Morocco population (0.135)
was intermediate between those found in the western popula-
tions (about 0) and in the eastern populations (0.579).
A general restriction of our study is the unequal number of
populations that were sampled through the natural range of P.
pinaster. However, based on the mitochondrial DNA study of
Burban (unpublished results), we have a representative sam
-
pling of the western (Landes, Portugal and Spain) and eastern
phylogenies. Moreover, the populations from Italy are also
‘represented’ as they belong to the eastern phylogeny. The
selection of a low number of Iberian populations is based on
previous studies. In fact, the four Spanish populations are
typical locations of the four main groups of populations de
-
tected in Spain with allozymes by Salvador et al. [24] and
González-Martínez et al. [11]: North West, East and South
East (which is divided in two subgroups, both represented in
the present study).
4.2. How far microsatellites can be used
to define genetic resources conservation strategies
in P. pinaster?
Microsatellite data obtained for P. pinaster showed con
-
trasting genetic characteristics among geographical groups.
The eastern populations (group 2) displayed a lower level of
heterozygosity and a higher fixation index than the western
populations (groups 1 and 3), indicating a deficiency of het
-
erozygotes in the populations. This is especially true for the
locus FRPP91 (table II). Moreover, the differentiation among
populations was much higher in the eastern populations
(0.066) than in the western populations (0.016 in the west of
France and 0.033 in the Iberian populations).
Conservation strategies should reflect those differences
found within each group of populations. In the eastern group,
microsatellite data could be useful to identify populations
with private alleles in order to hold diversity reservoirs. The
among population differentiation in the western groups was
low within each geographical group; thus, the choice of pop
-
ulations should follow other criterias, by reflecting different
types of ecological conditions for example. Moreover, the
Iberian Peninsula populations exhibited the highest values of
genetic diversity in the western group range of the species,
and one population (Cómpeta) was highly differentiated from
the others (figure 2). Therefore, this population could be con
-
sidered in conservation programmes.
Nevertheless, the microsatellite data presented here are
not sufficient to define genetic resource conservation strate
-
gies for P. pinaster. First, the number of markers that we con-
sidered is limited. Seventy-six SSR primer pairs from four
Pinus species were tested to amplify microsatellites in
P. pinaster (see details in Mariette et al. [17]). Twenty-six
primer pairs were taken from a microsatellite library for P.
pinaster and the other primer pairs were obtained from other
species of the same genus (P. radiata, P. strobus and P.
halepensis). Only three out of the 76 SSR primer pairs ampli-
fied at a single polymorphic locus in P. pinaster. It is unlikely
that a high number of SSR markers in this species will be
found in the very short term. As a consequence, at the range
scale of P. pinaster, all the available information from other
neutral markers (isozymes, chloroplast microsatellites,
AFLPs) should be considered to detect populations with
higher levels of diversity or population specific alleles.
Second, the F
IS
estimates are large enough to suggest not
only some inbreeding (particularly in Corsican populations)
but also the existence of null alleles, especially for FRPP94
and ITPH4516 locus. The three P. pinaster loci were posi
-
tioned on P. pinaster genetic maps and no null allele was de
-
tected. However, null alleles seem to be actually quite
frequent in conifer species. This has already been reported in
a study on P. radiata (Fisher et al. [10]), which pointed out
the high frequency of null alleles in microsatellites of this
species. It seems also to be the case in other species such as
Picea abies (Scotti, personal communication). The use of
microsatellites may therefore lead to underestimation of
heterozygosity and allelic richness in conifer species.
Finally, phenotypic information given by field trials
should be considered, for the stands to be preserved have to
be chosen integrating both molecular and quantitative data.
For example, some discriminant canonical analysis using
allozymes and three quantitative traits (survival, height and
706
J. Derory et al.
stem form) was performed and some correlation between
quantitative traits and molecular markers in maritime pine
was found (Gonzaléz-Martínez, unpublished results). A
slight concordance of morphological and allozymic variation
has also been reported for other forest species with wide
ranges (e.g. Pseudotsuga menziesii [8]; Picea abies [16];
Alnus rubra [12]).
4.3. A tool for origin identification
(Corsica × Aquitaine hybrid certification)
A breeding programme for P. pinaster was initiated in the
sixties in France, mainly based on the genetic variability
available in Aquitaine. The Corsican populations were re
-
cently integrated to the programme, because they exhibit a
better stem form, in general, whereas the Aquitaine popula
-
tions are more cold resistant and vigorous. Thus, Aquitaine ×
Corsica hybrids will be produced within the frame of the
programme. Moreover, the future development of hybrid va
-
rieties has been raised as a potential plan by the French state
agency (National Forest Office: ONF).
It was possible to discriminate the distribution curves of
the Aquitaine and the Corsican populations by using the three
microsatellites or each microsatellite separately (figures 3A
to 3D). The Devinas population was tested and was found to
be of Corsican origin by using the three microsatellites
pooled or by using either the FRPP91 or the ITPH4516.
A more economic efficient method could be achieved by
using only one microsatellite. The FRPP91 locus gave the
highest differentiation between the two provenances and
when the distribution curves were compared, this locus
showed very distinct distribution for the two provenances.
Therefore, this locus could be used solely in the identification
test.
The result obtained in the foregoing paper could be ap
-
plied for certification of Corsica × Aquitaine hybrid variet
-
ies. The S statistic distribution of a hybrid population could
be established by using a large number of individuals origi
-
nating from crossings between Aquitaine and Corsican indi
-
viduals. This distribution should be completely distinct from
the Aquitaine and the Corsica distribution curves, especially
when the three microsatellites are pooled, or when locus
FRPP91 or FRPP94 are used, since the Corsica and the
Aquitaine curves did not overlap in those cases. A statistic
could be computed from a λ sample (a seed lot which origin
ought to be controlled), and further compared with the three
distributions (Aquitaine, Corsica and hybrid). Moreover, the
marker and the statistical approach are useful for P. pinaster
provenance identification, but can also be applied to other
forest tree identification problems, provided that the
microsatellite information is available and that the distribu
-
tion curves will not overlap.
Acknowledgements: This work was supported by grants from
France (Ministère de l’Agriculture et de la Pêche-DERF
No. 61.21.04/98 and DERF No. 61.45.0401), Spain (Cooperation
project DGCN–INIA CC00-0035), and the European Union
(INCO-DC 18CT97-200). Santiago C. González-Martínez was sup
-
ported by a FPU scholarship from MECD (Ministerio de Educación,
Cultura y Deporte, Spain). The authors are very thankful to two
anonymous reviewers for their helpful comments on a previous ver
-
sion of the manuscript. We also thank Ivan Scotti for thoughtful
comments concerning null alleles in conifer species.
REFERENCES
[1] Alía R., Gil L., Pardos J.A., Performance of 43 Pinus pinaster prove
-
nances on 5 locations in Central Spain, Silvae Genet. 44 (1995) 75–81.
[2] Alía R., Moro J., Denis J.B., Performance of Pinus pinaster provenan
-
ces in Spain: interpretation of the genotype by environment interaction, Can.
J. For. Res. 27 (1997) 1548–1559.
[3] Bahrman N., Zivy M., Baradat P., Damerval C., Organization of the va
-
riability of abundant proteins in seven geographical origins of maritime pine
(Pinus pinaster Ait.), Theor. Appl. Genet. 88 (1994) 407–411.
[4] Baradat P., Marpeau-Bezard A., Le pin maritime, Pinus pinaster Ait.,
biologie et génétique des terpènes pour la connaissance et l’amélioration de
l’espèce, Ph.D. Thesis, University of Bordeaux I, 1988.
[5] Boisseaux T., Influence de l’origine génétique (landaise ou ibérique)
des peuplements de Pin maritime sur les dégâts causés par le froid de janvier
1985 au massif forestier aquitain. Mise au point d’un test variétal précoce utili
-
sable pour le contrôle de lots de graines, Mémoire de l’ENITEF Thesis, Uni
-
versity of Bordeaux, 1986.
[6] Brown A.H.D., Weir B.S., Measuring genetic variability in plant popu-
lations, in: Tanksley S.D., Orton T.J. (Eds.), Isozymes in plant genetics and
breeding Part A, Elsevier Science Publishers B.V., Amsterdam, 1983,
pp. 219–239.
[7] Doyle J.J., Doyle J.L., Isolation of plant DNA from fresh tissue, Focus
12 (1990) 13–15.
[8] El-Kassaby Y.A., Associations between allozyme genotypes and quan-
titative traits in Douglas-fir (Pseudotsuga menziesii (Mirb.) Franco), Genetics
101 (1982) 103–115.
[9] Farjon A., Pines: drawings and descriptions of the genus Pinus, Brill
E.J. (Ed.), Leiden, 1984.
[10] Fisher P.J., Richardson T.E., Gardner R.C., Characteristics of single–
and multi-copy microsatellites from Pinus radiata, Theor. Appl. Genet. 96
(1998) 969–979.
[11] González-Martínez S.C., Salvador L., Agúndez D., Alía R., Gil L.,
Geographical variation of gene diversity of Pinus pinaster Ait. in the Iberian
Peninsula, in: Müller-Starck G., Schubert R. (Eds.), Genetic response of forest
systems to changing environmental conditions, Kluwer Academic Press, Dor
-
drecht, 2001, pp. 161–171.
[12] Hamman A., El-Kassaby Y.A., Koshy M.P., Namkoong G., Multiva
-
riate analysis of allozymic and quantitative trait variation in Alnus rubra: geo
-
graphic patterns and evolutionary implications, Can. J. For. Res. 28 (1998)
1557–1565.
[13] Harfouche A., Kremer A., Provenance hybridization in a diallel ma
-
ting scheme of maritime pine (Pinus pinaster), Can. J. For. Res. 30 (2000) 1–9.
[14] Jactel H., Ménassieu P., Burban C., Découverte en corse de Matsu
-
coccus feytaudi Duc. (Homoptera: Margarodidae), cochenille du Pin mari
-
time, Ann. Sci. For. 53 (1996) 145–152.
[15] Jactel H., Ménassieu P., Ceria A., Burban C., Regad J., Normand S.,
Carcreff E., Une pullulation de la cochenille Matsucoccus feytaudi provoque
un début de dépérissement du Pin maritime en Corse, Rev. For. Fr. 50 (1998)
33–45.
[16] Lagerkrantz U., Ryman N., Genetic structure of Norway Spruce (Pi
-
cea abies): concordance of morphological and allozymic variation, Evolution
44 (1990) 38–53.
[17] Mariette S., Chagné D., Decroocq S., Vendramin G.G., Lalanne C.,
Madur D., Plomion C., Microsatellite markers for Pinus pinaster Ait., Ann.
For. Sci. 58 (2001) 203–206.
Genetic diversity in P. pinaster 707
[18] Mariette S., Chagné D., Lézier C., Pastuszka P., Raffin A., Plomion
C., Kremer A., Genetic diversity within and among Pinus pinaster popula
-
tions: comparison between AFLP and microsatellite markers, Heredity 86
(2001b) 469–479.
[19] Petit R.J., Bahrman N., Baradat P., Comparison of genetic differentia
-
tion in maritime pine (Pinus pinaster Ait.) estimated using isozyme, total pro
-
tein and terpenic loci, Heredity 75 (1995) 382–389.
[20] Raymond M., Rousset F., An exact test for population differentiation,
Evolution 49 (1995) 1280–1283.
[21] Ribeiro M.M., Plomion C., Petit R.J., Vendramin G.G., Szmidt A.E.,
Variation in chloroplast single-sequence repeats in Portuguese maritime pine
(Pinus pinaster Ait.), Theor. Appl. Genet. 102 (2001) 97–103.
[22] Ribeiro M.M., LeProvost G., Gerber S., Vendramin G.G., Anzidei
M., Decroocq S., Marpeau A., Mariette S., Plomion C., Origin identification of
maritime pine stands in France using chloroplast single-sequence repeats,
Ann. For. Sci. 59 (2002) 53–62.
[23] Rousset F., Equilibrium values of measure of population subdivision
for stepwise mutation processes, Genetics 142 (1996) 1357–1362.
[24] Salvador L., Alía R., Agúndez D., Gil L., Genetic variation and migra
-
tion pathways of maritime pine (Pinus pinaster Ait.) in the Iberian peninsula,
Theor. Appl. Genet. 100 (2000) 89–95.
[25] Vendramin G.G., Anzidei M., Madaghiele A., Bucci G., Distribution
of genetic diversity in Pinus pinaster Ait. as revealed by chloroplast microsa
-
tellites, Theor. Appl. Genet. 97 (1998) 456–463.
[26] Weir B.S., Cockerham C.C., Estimating F-statistics for the analysis of
population structure, Evolution 38 (1984) 1358–1370.
To access this journal online:
www.edpsciences.org
708
J. Derory et al.