Báo cáo khoa học: "Water balance of a Southern Moravian floodplain forest under natural and modified soil water regimes and its ecological consequences" pps
Bạn đang xem bản rút gọn của tài liệu. Xem và tải ngay bản đầy đủ của tài liệu tại đây (211.99 KB, 15 trang )
Original article
Water balance of a Southern Moravian floodplain
forest under natural and modified soil water regimes
and its ecological consequences
Jan C7Lermák and Alois Prax
Institute of Forest Ecology, Mendel University of Agriculture and Forestry, Zemedelska 3, 61300 Brno, Czech Republic
(Received 10 April 2000; accepted 20 June 2000)
Abstract – Stand water balance was calculated in a floodplain forest in Southern Moravia. A model was applied to actual and theo-
retical scenarios of climate and soil water supply. Rooted and root-free soil volumes were considered separately because root devel-
opment was poor for these trees. Input data, i.e., measured flows within the system including sap flow rate, characterize both the peri-
od of regular natural floods and period when floods were interrupted for over 20 years because of canalization of rivers in the region.
Under non-limiting underground water supply, net precipitation supplied only about 50 and 25% of water for actual evapotranspira-
tion,
E
T
, under mild and dry weather, respectively, and the other 30 and 60% came from underground sources. The model also char-
acterizes the theoretical situation of no underground water supply, when
E
T
may decrease significantly. An important limit for water
supply to the trees may be the maximum hydraulic conductivity
K, allowing horizontal transport in heavy soils, because a small
decrease in soil water content (2 to 4%
vol
) causes a large drop in K. K may become supply-limiting before soil water potential
becomes a limiting factor. Trees with smaller or damaged root systems or lower root/shoot ratio were especially threatened by
drought even on relatively moist heavy soils.
floodplain forest / large trees / root systems / water balance / soil hydraulic conductivity / limiting water supply / Southern
Moravia / modeling
Résumé
– Bilan hydrique d’une forêt dans une plaine alluviale du Sud de la Moravie en conditions naturelles ou sous des
régimes hydriques modifiés : ses conséquences écologiques.
Le bilan hydrique a été calculé dans des peuplements situés dans une
plaine alluviale du Sud de la Moravie. Un modèle a été appliqué à des scénarios actuels ou théoriques de climat et d’alimentation en
eau. Les volumes de sol, avec et sans racines, ont été pris en compte séparément du fait que le développement racinaire de ces arbres
était faible. Les valeurs entrées, par exemple les flux mesurés dans le système incluant le flux de sève, caractérisent l’ensemble des
périodes, celles des inondations naturelles régulières et celles durant lesquelles les inondations furent interrompues pendant plus de
20 ans du fait de la canalisation des rivières de cette région. Sous conditions non limitatives d’alimentation en eau du sol, les précipi-
tations nettes fournissent seulement environ 50 et 25 % de l’eau pour l’évaporation réelle,
E
T
, sous un temps moyen et sec, respecti-
vement, et les autres 30 et 60 % ont pour origine l’eau du sol. Le modèle caractérise aussi les situations théoriques d’une absence
d’alimentation en eau provenant du sol, lorsque
E
T
peut décroître significativement. Un facteur limitant important pour l’alimentation
en eau des arbres peut être le maximum de la conductivité hydraulique
K, permettant un transport latéral dans les sols lourds. À cause
de la faible diminution de la teneur en eau (2 à 4 %
vol
) cela provoque une forte chute dans la valeur de K. K peut devenir facteur limi-
tant de l’alimentation avant que le potentiel hydrique ne devienne le facteur limitant. Les arbres ayant un système racinaire réduit ou
endommagé ou bien avec un rapport racine/pousse faible, étaient spécialement menacés par la sécheresse, même sur les sols lourds
relativement humides.
plaine alluviale / gros arbres / systèmes racinaires / bilan hydrique / conductivité hydraulique du sol / alimentation en eau
limitante / Sud de la Moravie / modélisation
Ann. For. Sci. 58 (2001) 15–29 15
© INRA, EDP Sciences, 2001
* Correspondence and reprints
Fax: +42(0)5/4521-1422; e-mail:
J. C6Lermák and A. Prax
16
1. INTRODUCTION
Important hydrological changes induced by water
management policies including canalization of rivers
occurred in southern Moravia in late seventies and eight-
ies. This caused decreasing or complete cessation of
floods in the region and decreased the level of under-
ground water tables. This change has an impact on flood-
plain forests along the Dyje river, because the trees were
originally adapted to high water tables and regular sea-
sonal floods. There is concern that these forests (as the
typical plant community of the region) may be threat-
ened, and a need to understand which parameters of the
changing environment or stand water balance may be
critical for functional stability of forests and their sur-
vival [21, 23]. In particular we consider the sufficiency
of two sources of water, i.e., the amount of water coming
from local precipitation and the amount from under-
ground water supply (dependent on the water table in the
near-by river) and the influence of different soil
hydraulic properties [2, 48].
We tried to elucidate the questions through an analy-
sis of stand water balance [1, 24]. The water balance
model was based especially on the quantitative knowl-
edge of aboveground and underground structure of large
trees in floodplain forests [5, 66 45, 46, 47] and their
seasonal transpiration measured at the experimental site
[11, 12, 16, 34, 35]. Stand water balance was calculated
for unit of stand area, but was scaled down to the frac-
tion of stand area that belongs to a single model tree and
other components of the system of proportional sizes.
Long-term measurements allowed comparison of the
original situation at the time of regular floods with actual
and theoretical situations occurring under contrasting
water supply after ceasing of floods. The study focused
on describing the general approach, more detail analysis
using different time steps and evaluating errors follows
in subsequent studies.
2. MATERIALS AND METHODS
2.1. Location, stand
and the environmental conditions
The experimental site is situated near the small town
of Lednice in the southernmost part of Moravia (district
Breclav) in the alluvium of the Dyje river (elevation of
160 ± 1 m). The site is classified as Ulmeto-fraxinetum
carpineum, Rubus caesius L., Deschampsia cespitosa
(L.) Beauv., Dactylis polygama (Horv.) Dom. and Viola
sylvatica Fr. [46]. Local soils originated from sedimen-
tation of materials during spring floods, which occurred
almost every year up to 1972. The 1.5 to 2-m thick layer
of soils of quaternary origin is characterized as semigley
[33] or Fluvi-eutric gleysols – FAO 1970 [20] on medi-
um heavy to heavy alluvial sediments. In general, such
soils have poorly differentiated horizons, but vary slight-
ly in their physical properties with depth and site as a
result of variable conditions during their sedimentation
[2]. Within the experimental site the soil properties were
homogenous [26], although sedimentation of heavy allu-
vial layers occurs occasionally in rather small spots over
the area [29, 37]. These surface soils overlay an 8-m
thick layer of subsoil composed of gravel and sand sedi-
ments of quaternary origin laying above impermeable
clay sediments of tertiary origin.
The forest stand was composed of oak (
Quercus
robur L., 78% of basal area), ash (Fraxinus excelsior L.
and F. angustifolia Vahl., 18%), lime (Tilia cordata L.,
3%) and other hardwood species (Acer campestre L.,
Populus alba L., Ulmus carpinifolia L., 1%). The stand
was planted in 1877; mean age of dominant trees was
95 years during the last regular floods in 1972, stand den-
sity 90% (when compared to model values of Forest
Management Institute). The leaf area index was 5 for the
tree layer and 2 for the shrub layer [6, 45, 46, 47]. There
were local groups of young ash and lime. The main shrub
species of the undergrowth was Cornus sanguinea L.
Water balance in the soil-tree-atmosphere continuum
was calculated from the transpiration (sap flow rate) data
measured in average on six large trees at the experimen-
tal site during nine years over the period of 1972 to 1995
[11, 12, 16, 34, 35]. Data characterizing other terms in
stand water balance (precipitation, interception, stem
flow, soil water, soil evaporation, runoff) were estimated
by other colleagues at the same site [26, 37, 44, where all
the methodical details are given]. Data from the first
period of measurement (1972–1974), characterized the
state of almost undisturbed floodplain forest. Data
obtained from the subsequent ten years characterized the
transition period when the forest responded to gradually
drying soils [12] and data from most recent years [16]
corresponded to the situation after relative stabilization
of soil water conditions.
2.2. Size of components of the model
A floodplain forest of unit area A
stand
(1 ha) was con-
sidered as a basis for modeling. To ease the description
of stand structure all data were scaled down to a part of
stand area corresponding to a single model tree A
tree
and
its proportional surroundings (figure 1). A
tree
was derived
from the ratio of biometric parameters of the model tree,
particularly basal area weighted by tree height (i.e., timber
Water balance of a Southern Moravian floodplain forest
17
volume) of the model tree (V
T.tree
) and of the stand
(V
T.stand
) at the area of A
stand
A
tree
= A
stand
(V
T.tree
/V
T.stand
). (1)
Stand area represented by the model tree, A
tree
(with cor-
responding radius of r
tree
) is considered equal to the max-
imum possible area, that could be occupied by the tree
crown ground plan, A
ct
max
or similarly by the ground
plan of root systems, A
rt
max
, so that
A
tree
= A
ct
max
= A
rt
max
. (2)
The allometric relations of trees were calculated from
biometric data given by [47], who analyzed both above-
ground and underground systems of 15 large main
canopy trees in the same stand and [45, 46] who ana-
lyzed shrub and herbaceous layer. Standard errors of the
appropriate regressions were about 8% for aboveground
parts of trees and 7 and 19% for the depth and ground
plan area of root systems. The biometric parameters of
the model tree (table I) were derived using the quantile
of total [8, 14], which emphasizes the importance of
larger trees, instead of the simple arithmetic mean.
The rhizosphere was considered as a volume of soil
occupied by root systems of trees (with corresponding
root ground plan area). We distinguished the maximum
rhizosphere of main canopy trees,
V
rt
max
, as the total vol-
ume of soil below 1 ha of stand area down to the
observed maximum depth of root systems. This corre-
sponds to maximum root ground plan area, A
rt
max
. The
actual rhizosphere was that volume of soil,
V
rt
act
(and
corresponding actual root ground plan area,
A
rt
act
), which
was occupied by tree root systems estimated during
excavation studies [47]. Volume of the supplementary
rhizosphere V
rt
sup
represents the volume of soil (and cor-
responding supplementary root ground plan area,
A
rt
sup
)
not directly occupied by tree roots, but serving as the
additional water storage, which can be used by trees and
where their roots could eventually grow.
The actual values of ground plan areas of crowns
(A
ct
act
) were slightly smaller than the maximum possible
because of gaps between crowns in the upper canopy. At
the same level of the canopy, such gaps were caused by
abrasion of buds, leaves and shoots during movement of
crowns under strong winds [39]. However, no such gaps
were apparent from the viewpoint of the entire stand, due
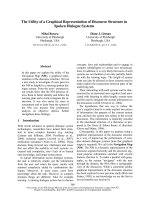
Figure 1. Spatial characteristics of Soil Plant Atmosphere
Continuum (SPAC) in the floodplain forest, southern Moravia
used in modeling stand water balance expressed proportionally
for the single (mean) tree. Part
A shows radii of the tree crown
and of the root system, when projected on the ground corre-
spond to defined stand areas. Space occupied by tree roots (the
rooted volume of soil and corresponding projected area) is typ-
ically smaller than that of crowns in the floodplain forest.
Supplementary space is the free volume in soils between indi-
vidual main canopy trees which is not occupied by root sys-
tems of such trees. Part
B shows water flows considered in the
model.
Table I. Main parameters of tree-soil system in the experimen-
tal stand of floodplain forest (site Horni les, forest district
Breclav), southern Moravia (based on measurement by Vyskot,
1976) applied in the model calculated for the entire stand as
represented by the model (mean) tree.
Variable Stand level Mean tree Proportion
Stand (crown) ground
plan area (m
2
) 10 000 90 100%
Root ground plan area (m
2
) 5 778 52 58%
Supplementary area (m
2
) 4 222 38 42%
Mean (maximum) rooting
depth (m) 1.48 (1.75)
J. C6Lermák and A. Prax
18
to overlapping crowns of trees of different height creat-
ing multi-layer systems in the forest. That is why ground
plan area of the model tree was taken as the proportion
of the tree in the entire stand area (A
ct
act
= A
stand
). The
same was true considering understorey vegetation. In
contrast and typically for the floodplain forest, signifi-
cant gaps between individual, relatively small tree-root
systems occurred in the soil [47].
A
stand
> A
ct
> A
rt
. (3)
Gaps in the soil between individual root systems were
considered as certain root-free supplementary space
(capable of supplying additional water) with correspond-
ing supplementary ground plan areas of root systems
(where roots can grow eventually), as
A
rt
sup
= A
stand
– A
rt
act
. (4)
Actual volume of soil containing the root systems, the
volume of rhizosphere (analog to phyllosphere for stand
canopy) of the model tree (V
rt
act
) was taken as the vol-
ume below the actual root ground plan area (A
rt
act
) down
to the mean depth of root systems (d
rt
): V
rt
act
= A
rt
act
d
rt
.
Similarly were considered also other volumes of soil,
i.e., that corresponding to the actual crown ground plan
area, V
ct
act
= A
ct
act
d
rt
and that corresponding to the maxi-
mum crown ground plan area (= stand area), V
stand
=
A
stand
d
rt
. Ratio of all such volumes and thus also their
calculation was similar as in the case of corresponding
ground plan areas (see equation (4)). This considers the
supplementary volume of rhizosphere (V
rt
sup
), i.e., the
total volume of soils outside the actual reach of root sys-
tems (V
rt
act
).
V
rt
sup
= V
stand
– V
rt
act
. (5)
2.3. Calculating the water balance
Stand water balance was calculated in mm or liters of
water on the basis of known soil hydrological data [26,
37, 38] and known space, i.e., the size of compartments
occupied by different components of the model [47]. The
period one growing season (between leaf flushing and
leaf fall), i.e., from May to October was considered
according to the equation
E
act
= E
i
+ E
T
= E
i
+ E
Q
+ E
res
= dW + P
n
+ P
sf
+ U (+H) – O (6)
where E
act
is the total actual evaporation from the stand,
E
i
is stand interception, E
T
is evapotranspiration of the
stand (Penman) and E
Q
is transpiration of the tree layer
in the stand. E
res
is so called “residual evapotranspira-
tion”, i.e., transpiration of the undergrowth, E
u
(shrubs
and herbaceous plants) and evaporation from the soil
surface, E
soil
. dW is the difference in water storage in the
soil between beginning and end of the study period, P
n
is
net precipitation (i.e., precipitation in the open, P after
subtracting the interception, E
i
). P
sf
is the amount of
water coming with the stem flow, U is the amount of
water within soils obtained from the underground water
table, H is the amount of water which comes to the actu-
al rhizosphere from the corresponding supplementary
rhizosphere by the local horizontal transport. (This is
possible in variants of the model considering smaller size
of actual rhizosphere than the potential.) O =
O
h
+ O
v
+ O
s
is the outflow from the system with com-
ponents: horizontal, vertical and surface outflows.
Proportion of individual items of water balance, “X”
corresponding to different compartments (subsystems),
was calculated from the values corresponding to the
whole system (i.e., its maximum area, A
stand
, see equa-
tion (1)) according to the ratio of root ground plan areas
of trees and stand
X
rt
= X
stand
(A
rt
/A
stand
) (7)
when values for corresponding compartments were cal-
culated analogically as in equation (4). This was applied
for E
act
, E
i
, P and P
n
. E
res
was calculated different ways
for both subsystems as described further. Considering
water storage terms, dW, similar calculations were made
according to corresponding soil (= rhizosphere) volumes
dW
rt
= dW
stand
(V
rt
/V
stand
) (8)
where values for corresponding subsystems were calcu-
lated analogically as in equation (5). Amount of water
calculated in m
3
ha
–1
in some equations was finally
expressed in mm.
Total actual evaporation from the stand of floodplain
forest (E
act
) was calculated from the meteorological data
as the potential evaporation (E
pot
, Penman). This assump-
tion was based on the previous study, when it was con-
firmed, that for the same year of study as analyzed here
under non-limiting water supply both these quantities are
equal for most of the growing season at the given stand
[50]. Data applied for calculations were measured at the
experimental site and partially those from the meteoro-
logical station of the University in Mendeleum, 2 km
aerial distance from the experimental site.
2.4. Estimation of individual terms of the equation
Both precipitation in the open, P and net precipitation,
P
n
were estimated directly in the experimental site on the
basis of daily records of data over several years, [44]
P
n
= P – E
i
(9)
Water balance of a Southern Moravian floodplain forest
19
where the interception was measured separately for the
tree layer, E
it
and the undergrowth layer, E
iu
using alto-
gether 32 meteorological rainfall troughs and gauges dis-
tributed along a transect line through the stand.
Considering corresponding areas
E
i
= E
it
+ E
iu
(10)
stem-flow, P
sf
measured on a total of 33 trees was low in
rough bark trees in the experimental stand, only about
0.5% of P
n
, so it was neglected in further calculations.
Evapotranspiration of the stand (i.e., for the maximum
area, A
stand
), E
T
, was calculated as the difference between
the total actual evaporation, E
act
, and interception, E
i
E
T
= E
act
– E
i
. (11)
E
T
was also considered equal to the sum of transpiration
of the trees, E
Q
, the undergrowth, E
u
and evaporation of
soil, E
soil
E
T
= E
Q
+ E
u
+ E
soil
= E
Q
+ E
res
. (12)
According to the above equation the E
T
was calculated
for the area of actual rhizosphere, A
rt
act
. From that equa-
tion the “residual” evapotranspiration is clearly
E
res
= E
u
+ E
soil
(13)
or can be derived from the equation (12) as the differ-
ence between stand evapotranspiration E
T
and transpira-
tion of the trees E
Q
E
res
= E
T
– E
Q
. (14)
In case of supplementary rhizosphere where no large
trees were growing (and thus
E
Q
= 0), we calculated
E
T
= E
res
.
Transpiration of the tree layer (main canopy species),
E
Q
was estimated by direct measurement of sap flow in
stems of sample trees. The trunk sector heat balance
method with internal (direct electric) heating and sensing
[10, 11, 27] and compensating measurement of tempera-
ture [7] was applied. An average of 6 tall trees were
measured over the nine growing seasons between 1972
and 1995 [11, 12, 16, 34, 35]. Data from individual trees
were scaled up to the stand according to their biometric
parameters [5, 8].
Water consumed from the soil over the growing sea-
sons (dW) was taken as the difference between water
storage at the beginning (W
1
) and at the end (W
2
) of
study periods (dW = W
1
– W
2
). This was estimated from
long-term measurement of the level of underground
water table and soil hydrolimits [26, 37, 38], derived
from the relation of soil water (%
vol
) on soil water poten-
tial (MPa or pF values) at the site (figure 2). Calculated
values of soil hydrolimits (table II) are weighted
Table II. Main soil hydrolimits (full water capacity, field capacity – water retention, point of decreased availability and wilting points)
and related soil parameters including soil hydraulic conductivity (
K
w
) and maximum possible horizontal soil water flow (H
w
) in the
floodplain forest (site Horni les, forest district Breclav), southern Moravia. Length of the growing season was considered 180 days.
Soil hydrolimits Water availability Water potential Water content Water storage Hydraulic Maximum
(pF) (pF) (Mpa) (%
vol
) (mm) conductivity horiz. Flow
(mm d
–1
) (mm season
–1
)
Full water cap. Over-watering 0 0 45 ± 3 237 960 172 106
Field water cap. Non-limiting 2.2 0.02 39 ± 3 148 0.995 178.4
Point of DWA Low-stress 3.3 0.2 34 ± 2 74 0.033 5.92
Temporary wilt. p. Moderate stress 3.6 0.38 31 ± 2 34 0.0017 0.302
Permanent wilt. p. Severe stress 4.18 1.5 28.5 ± 2 0 4.8 × 10
–0.6
0.000861
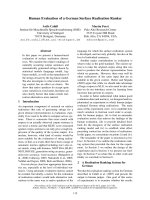
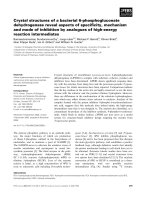
Figure 2. Soil water retention curve (relation of volumetric soil
water content to water potential) in the floodplain forest, south-
ern Moravia applied in modeling the stand water balance.
Arrows indicate values corresponding to different soil
hydrolimits. Soil water potential can be derived from water con-
tent by the relation:
y = 2.04 exp[0.86(x – 28.4)
0.7
]; r
2
= 0.99.
J. C6Lermák and A. Prax
20
averages considering five soil horizons, which cover the
whole soil profile within the reach of tree root systems.
In all water balance calculations we considered amounts
of soil water available above two hydrolimits: (1) point
of decreased water availability “pda” (U
soil
=–2
× 10
5
Pa) and (2) wilting point “wp” (U
soil
= –15
× 10
5
Pa).
Amount of water within the soil profile of the system
(i.e., the given size of the rhizosphere) obtained from
underground water table, i.e.,the unknown item of the
balance, U, was calculated from the main equation of the
balance (equation 6) arranged into its simplified form.
For calculations considering the size of the system as the
“maximum rhizosphere”, the equation was in the form
U
max
= dW
max
+ P
n
max
– E
T
max
. (15)
When we considered the situation within the actual rhi-
zosphere, also the item for local horizontal transport,
H
was included. This considers the amount of water which
flows out of the supplementary rhizosphere (with lower
value of E
T
) into the actual rhizosphere (with higher
value of E
T
), so that
+H
act
= –H
sup
. (16)
For the actual rhizosphere we calculated
(U
act
+ H
act
) = dW
act
+ P
n
act
– E
T
act
(17)
and similarly for the supplementary rhizosphere
(U
sup
+ H
sup
) = dW
sup
+ P
n
sup
– E
T
sup
. (18)
The amount of water representing the local horizontal
transport, H, was considered as flowing from the supple-
mentary to the actual rhizosphere (due to its larger water
consumption) and was derived for the actual rhizosphere
as positive value of
+
H
act
= (U
act
+ H
act
) – U
act
(19)
and similarly for the supplementary rhizosphere as a
negative value of
–H
sup
= (U
sup
+ H
sup
) – U
sup
. (20)
Surface outflow (O
s
) was neglected during calculations,
because the terrain was very flat and no such flow was
observed (with exception of flooding water). Items of
horizontal and vertical outflows (O
h
and O
v
) are included
in items of soil water and underground water.
For modeled theoretical conditions of limited water
supply, some terms of the water balance equation were
calculated in a slightly different way. In particular, to
calculate evapotranspiration under no underground water
supply (E
T.noU
), the originally calculated evapotranspira-
tion with ample underground water (E
T.aU
) was reduced
by subtracting the term of underground water flow (orig-
inally U
aU
>> 1, reduced U
noU
= 0), but still contained
the term for remaining horizontal water transport, H i.e.,
equations (11) and (12) was replaced by
E
T.noU
= E
T.aU
– U
aU
+ H (21)
and equation (14) for tree transpiration (E
Q
) was
replaced by the equation considering that E
Q
was lower
when the underground water U was cut off (i.e., similar
behavior as observed in different species – [4, 17, 18,
19], thus
E
Q.noU
= E
Q.aU
(E
T.noU
/E
T.aU
) (22)
where “
noU
” symbolizes the term for situation of no
underground water and “
aU
” for ample, non-limiting
underground water. All above terms were calculated sep-
arately for the entire stand and both compartments (root-
ed and supplementary volume) and hydrolimits of wilt-
ing point (wp) and point of decreased availability (pda)
as in the previous case. Nevertheless the values for the
point of decreased availability only were taken for fur-
ther evaluation.
2.5. Root area, soil hydraulic conductivity
and conditions considered in the model
Horizontal transport of soil water from the supple-
mentary soil compartment to the soil compartment con-
taining root systems was taken as through an area
enveloping the actual root systems. In the model, this
was taken as if the actual root system would grow in a
cylindrical volume with the diameter of the actual root
system (for the mean model tree, r
r.act
= 4.07 m).
Considering the mean rooting depth (see table I), the
horizontal enveloping area of the mentioned volume of
the model tree, A
r.pot
was than taken A
r.pot
= 37.9 m
2
(area
of the bottom of the cylindrical volume was not taken
into account, since this was active only for conditions of
non-limiting underground water supply).
Water balance was calculated for contrasting condi-
tions of seasonal evaporation, relatively humid and dry
years as characterized by their climatic water deficits
(dE
pot
= E
pot
– P), although always characterizing the dry
or sub-humid climate and underground water table as
dependent on distant precipitation and long-term climatic
conditions. We distinguished contrasting “Mild” and
“Dry” growing seasons characterized by water deficits of
about 170 (150 to 200) and 380 (350 to 400) mm,
respectively. The water balance was calculated for con-
ditions of ample water supply from underground water
table and for a limited supply as if this source was theo-
retically unavailable. Soil water was considered suffi-
cient after winter in some of above cases and as if it
Water balance of a Southern Moravian floodplain forest
21
would be partially exhausted (up to 50%) after previous
dry years. This way we obtained eight variants of water
balance.
Limits to the horizontal water transport given by the
soil hydraulic conductivity (
figure 3), where the
hydraulic gradient was caused by higher transpiration of
trees in the rooted compartment compared to the supple-
mentary one, were calculated from the equation
H = K
w
A
r.pot
d
season
. (23)
The water balance was calculated with the step of one
growing season, d
season
= 180 days (table II), and/or
mean day of the season (i.e., the day with non-extreme
environmental parameters).
3. RESULTS AND DISCUSSION
3.1. Actual stand water balance under ample
underground water supply
Under non-limiting underground water supply, the
level of underground water was within the upper layer of
heavy soil, partially in direct contact with deeper parts of
tree root systems. Input data on water balance character-
ize the situation to which the floodplain forest was
adapted in long-term (for several tens of years) and
which was actually measured for several years under
conditions of last regular natural floods in the region [11,
35]. Under such conditions, water use of the floodplain
forest was similar to other highly transpiring mature
forests as e.g., beech, but lower than in e.g. black alder
growing under non-limiting water supply in years with
high radiation input, which the authors [22] explain by a
lower capacity of stomatal regulation in alder.
Under mild weather conditions (with the climatic
water deficit of only 170 mm) seasonal transpiration of
main canopy trees, E
Q
and actual evapotranspiration,
E
T.act
were relatively low (261 and 338 mm, respectively
i.e., about 60% of that under dry years). This was due to
lower potential evapotranspiration and more frequent
occurrence of rainy and foggy days with higher intercep-
tion (table III). Considering possible sources of available
water within the entire soil-plant-atmosphere continuum
of water flows (figure 4A), net precipitation itself was
sufficient to cover completely the transpiration of main
canopy trees and over 80% of actual evapotranspiration.
Only a small fraction of water from underground water
table and from soil storage, (97 and 74 mm, respectively)
was needed to supply the actual evapotranspiration (i.e.,
29% and 22% of E
T.act
). This provided that trees had
access to about 100 mm of water from supplementary
soil volume outside of the direct reach of tree root sys-
tems. Soil water content and related hydraulic conductiv-
ity remained high enough to allow for sufficient hori-
zontal transport (also about 100 mm over the period
under study) of water from supplementary soil volume
into actually rooted volume of soil. The corresponding
soil water content at this conductivity is lower than field
water capacity (around 38%
vol
) and records of soil mois-
ture showed, that this situation really exists in long-term
[37]. Theoretical exhausting of 50%
vol
of internal soil
water storage (what simulated some drought in previous
years) showed no significant effect (see table III). There
is clearly no danger, that trees would suffer drought
under such conditions.
Under dry weather conditions (characterized by a cli-
matic water deficit of 380 mm) seasonal E
Q
and E
T.act
was substantially higher (434 and 509 mm, respectively).
Lower precipitation (even if also under lower intercep-
tion) could supply only about 42 and 36% for E
Q
and
E
T.act
, respectively, of the required water (figure 4B, see
table III). Requirements for underground water supply
increased about three times, up to 309 mm when consid-
ering amount of water up to the hydrolimit of point of
decreased availability, thus underground water supplied
most of the evaporated water (71 and 61% for tree tran-
spiration and potential evapotranspiration, respectively).
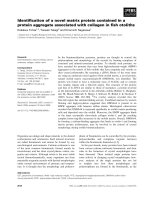
Figure 3. Relation of soil hydraulic conductivity to volumetric
soil water content in the floodplain forest, southern Moravia
applied in modeling the stand water balance. Arrows indicate
values corresponding to different soil hydrolimits. Soil water
conductivity can be derived from water content by the relation:
y = 52.4 / (46.2 – x)
4.3
; r
2
= 0.99. (Data in the region of gravita-
tional water may be by modified by movement of water in non-
capillary, gravitational pores.)
J. C6Lermák and A. Prax
22
Table III. Main items of water balance (in mm) in the floodplain forest (site Horni les, forest district Breclav), southern Moravia
under actually measured ample (non-limiting) water supply and under modelled no underground water supply for different weather
and soil water storage conditions.
Underground water: Ample No
Variable Soil water storage: Saturated Exhausted Saturated Exhausted
Weather: Dry Mild Dry Mild Dry Mild Dry Mild
Compartment: Stand total
E
pot
Potential evapotranspiration 567 446 567 446 567 446 567 446
E
act
Actual evaporation 567 446 567 446 258 349 221 312
P Precipitation above stand 184 275 184 275 184 275 184 275
P
n
Net precipitation 126 167 126 167 126 167 126 167
E
it
Interception (tree layer) 47 75 47 75 47 75 47 75
E
iu
Interception (understorey) 11 33 11 33 11 33 11 33
E
i
Interception (total) 58 108 58 108 58 108 58 108
E
T
Actual evapotranspiration 509 338 509 338 200 241 163 204
E
res
Evapotransp.(understorey+soil) 75 77 75 77 29 55 24 47
E
Q
Tree transpiration 434 261 434 261 171 186 139 157
dW Soil water storage 74 74 37 37 74 74 37 37
U Underground water supply –309 –97 –346 –134 0 0 0 0
Compartment: Actual rooted volume (rhizosphere)
r
E
pot
Potential evapotranspiration 328 257 328 257 328 257 328 257
r
E
act
Actual evaporation 511 367 511 367 221 280 186 246
r
P Precipitation above stand 106 159 106 159 106 159 106 159
r
P
n
Net precipitation 73 96 73 96 73 96 73 96
r
E
it
Interception (tree layer) 27 43 27 43 27 43 27 43
r
E
iu
Interception (understorey) 6 19 6 19 6 19 6 19
r
E
i
Interception (total) 34 62 34 62 34 62 34 62
r
E
T
Actual evapotranspiration 478 305 478 305 188 218 153 184
r
E
res
Evapotransp.(understorey+soil) 43 45 43 45 17 32 14 27
r
E
Q
Tree transpiration 434 261 434 261 171 186 139 157
r
dW Soil water storage 43 43 21 21 43 43 21 21
r
U Underground water supply –179 –56 –200 –77 0 0 0 0
r
H Horizontal flow –183 –110 –183 –110 –72 –78 –59 –66
Compartment: Root-free (supplementary) volume
s
E
pot
Potential evapotranspiration 239 188 239 188 239 188 239 188
s
E
act
Actual evaporation 56 78 56 78 37 69 35 65
s
P Precipitation above stand 78 116 78 116 78 116 78 116
s
P
n
Net precipitation 53 71 53 71 53 71 53 71
s
E
it
Interception (tree layer) 20 32 20 32 20 32 20 32
s
E
iu
Interception (understorey) 5 14 5 14 5 14 5 14
s
E
i
Interception (total) 24 45 24 45 24 45 24 45
s
E
T
Actual evapotranspiration 31 33 31 33 12 23 10 20
s
E
res
Evapotransp.(understorey+soil) 31 33 31 33 12 23 10 20
s
E
Q
Tree transpiration 0 0 0 0 0 0 0 0
s
dW Soil water storage 31 31 16 16 31 31 16 16
s
U Underground water supply –130 –41 –146 –57 0 0 0 0
s
H Horizontal flow 183 110 183 110 72 78 59 66
Resulting flows: Stand total
Total flow from underground –309 –97 –346 –134 0 0 0 0
Total horizontal flow 183 110 183 110 72 78 59 66
Total flow from outside 0 0 0 0 0 0 0 0
Missing water due to limiting K
max
–175 –102 –175 –102 –64 –70 –51 –58
Water balance of a Southern Moravian floodplain forest
23
Figure 4. Scheme of the components of stand water balance of the floodplain forest near Lednice in southern Moravia supplied with ample underground water under
different environmental conditions.
A and B represent really measured situations in the period of regular floods. C represents modeled theoretical situation derived
for conditions unfavorable for tree growth and a lower edge in the range of tree transpiration. (Other situations observed during long-term measurements at the
experimental site were within the above range.) Width of the arrows correspond to the relative water flow rates (per growing season) expressed in percentage of
potential evapotranspiration (
E
pot
). Terms without a prefix symbolize values of variables valid for the entire stand, terms with the prefix r symbolize values valid for
rooted volume of soil and with the prefix
s for the supplementary volume of soil. Thus
r
P and
s
P is precipitation in the open above the actual rhizosphere and above
the supplementary volume of soil, respectively; similarly
r
P
n
and
s
P
n
is net precipitation above the same areas. E
pot
is potential evaporation (dashed line shows higher
value of
E
pot
under dry weather), E
act
is actual evaporation. E
T.act
is actual evapotranspiration (evaporation not including terms of interception),
r
E
Q
is transpiration
of the main canopy species (estimated through the sap flow), and
r
E
res
and
s
E
res
is transpiration of understorey plant species plus evaporation from the soil surface,
the “residual evapotranspiration” for both above mentioned areas. Similarly
E
it
(
r
E
it
and
s
E
it
) and E
iu
(
r
E
iu
and
s
E
iu
) is interception from the main canopy and from the
understorey species,
r
dW and
s
dW are terms for soil water storage down to the hydrolimit of decreased water availability (pda),
r
U and
s
U is water from underground
water table.
H is water transported horizontally between supplementary volumes of soil and volume of actual rhizosphere (what is subtracted from the supplemen-
tary volume of soil, –
s
H, this is added to the rhizosphere, +
r
H).
J. C6Lermák and A. Prax
24
Requirements for horizontal transport in soils increased
to over 180 mm, i.e., by about 2/3 compared to the situa-
tion under mild weather conditions. Internal soil water
storage remained less important in this case, since it rep-
resents only 15% of required water (see table III). Soil
hydraulic conductivity allowing for transport of required
amount of water is high enough only under relatively
high soil water content close to the field water capacity
(about 39%
vol
). Any decrease of soil water content below
this value may cause, as hydraulic conductivity becomes
critical for the water supply (see table II), what may at
least partially happen under typical weather especially in
the second half of growing seasons [37]. Having in mind
individual variation of tree root system structure and soil
conditions within stands, it can be expected, that small
portions of main canopy trees may suffer drought [4, 17,
18, 19].
3.2. Theoretical stand water balance under
no underground water supply
If the level of underground water fell a few decime-
ters below the layer of heavy soils where all roots of
trees are located into the layer of sandy gravel, water
supply from this underground source would be interrupt-
ed due to very low capillary rise (roots could not adapt
themselves fast enough). This is characterized by the
theoretically derived model scenarios. We consider that
water consumption changed there, while interception,
soil water storage and potential evapotranspiration were
supposed to be the same as we actually found. In fact,
the model scenarios can occur in the given region in real-
ity, especially in rather frequent places where in addition
to cessation of floods the underground water was low-
ered due to its extraction from sandy-gravel aquifers, to
be applied as drinking water for local needs [38].
Without an underground water supply, the entire tree-
soil system adapted to different conditions would not
have sufficient water to keep transpiration as high as
under ample supply under the same weather conditions.
Stand evapotranspiration must decrease down at least to
the value, that would assure that all the water required
for evapotranspiration will be present in the system
(missing water in the rooted volume of soil would be
equal to the water present in the supplementary volume
of soil). A model situation without underground water is
theoretical only; however, in some years following the
cessation of floods after watershed management mea-
sures in the region accompanied by the regulation of
river beds, such situation is likely to occur in reality [16].
According to the model, under theoretical conditions
of no underground water but mild weather (and still
remaining higher water content in soils) transpiration of
main canopy trees and actual evapotranspiration would
decrease down to about 186 and 241 mm, respectively,
i.e., to 70% of that under ample underground water (see
table III). Net precipitation itself could almost meet all
the transpiration requirements of main canopy trees
(90%) and somewhat less considering the actual evapo-
transpiration of the stand (69%). Only about 78 mm, i.e.,
Table IV. Fractions of water in the calculated water balance of the floodplain forest (site Horni les, forest district Breclav), southern
Moravia, coming from different sources.
Underground water: Ample No
Soil water storage: Saturated Exhausted Saturated Exhausted
Weather: Dry Mild Dry Mild Dry Mild Dry Mild
Proportion of large tree transpiration (%E
Q
)
P Precipitation above stand 42 105 42 105 108 148 132 175
P
n
Net precipitation 29 64 29 64 74 90 91 106
U Underground water supply –71 –37 –80 –51 0 0 0 0
dW Soil water storage 17 28 9 14 43 40 27 24
H Horizontal flow 42 42 42 42 42 42 42 42
Proportion of stand evapotranspirat. (%E
T
)
P Precipitation above stand 36 81 36 81 92 114 113 135
P
n
Net precipitation 25 49 25 49 63 69 77 82
U Underground water supply –61 –29 –68 –40 0 0 0 0
dW Soil water storage 15 22 7 11 37 31 23 18
H Horizontal flow 36 33 36 33 36 33 36 33
Water balance of a Southern Moravian floodplain forest
25
32% of the water needed for evapotranspiration should
be supplied from the supplementary soil volume by the
horizontal water transport, which would be possible
under a given soil hydraulic conductivity (see tables II
and IV). The majority of main canopy trees probably
will not suffer significantly due to limited underground
water supply, since transpiration would be kept low due
to low evaporation demands.
Without an underground water supply but high evapo-
ration demands of dry weather and corresponding par-
tially exhausted soil water storage, stand water consump-
tion would be lower by the amount of water equal to that
supplied from underground sources (see table III).
Scheme of flows considered in this version of water bal-
ance is shown on (figure 4C). Transpiration of main
canopy trees and actual stand evapotranspiration accord-
ing to the model would theoretically decrease down to
about 140 and 160 mm (for “pda” and “wp” conditions,
respectively), i.e., down to almost 1/3 compared to that
under ample underground water and the same weather
conditions. Calculated water balance showed, that net
precipitation itself would supply the lowered transpira-
tion of main canopy trees in a similar proportion as
under mild weather. Only about 37 and 23% from under
originally saturated and partially exhausted soil water,
respectively of the required water for evapotranspiration
could be supplied from soil water storage and about 60
to 70 mm (i.e., 36% of corresponding actual evapotran-
spiration) from supplementary soil volume under dry
weather (see table III). All situations which occurred
during long-term measurements at the experimental site
[11, 12, 16, 34, 35, 36, 50] were within the above range.
3.3. Hydraulic conductivity and limiting
horizontal flows
Values of soil hydraulic conductivity, K
w
for different
hydrolimits (see figure 3) and corresponding maximum
possible horizontal flow, H
max
calculated for the whole
growing season (see table II) were important in the cal-
culated stand water balance as discussed in the previous
chapter. Under ample underground water supply and
mild weather conditions the actual hydraulic conductivi-
ty of soil is higher than required and represents no limit
to plant water supply. However under dry weather, even
with ample underground water, the hydraulic conductivi-
ty may become limiting even under relatively high soil
moisture (figure 5). In the given example of stand water
balance this limit occurred when soil water content
decreased to the field water capacity (±1%
vol
), i.e., less
water will be available for plants than that calculated in
the model considering soil water down to the usual
hydrolimit of decreased availability. Supposing evapo-
transpiration of the forest stand remained as high without
underground water as under ample underground water,
then the required soil hydraulic conductivity should be
about two orders higher compared to that corresponding
to field water capacity. This is not likely to occur under
such conditions. Even if the stand evapotranspiration
decreased down to the value, that would assure that all
the water required for evapotranspiration will be theoret-
ically available in the entire system (missing water in the
rooted volume of soil would be equal to the water pre-
sent in the supplementary volume of soil), the required
hydraulic conductivity would be about an order higher
compared to actual one considered for the modeled con-
ditions.
Soil hydraulic conductivity is a physical property of
crucial importance for groundwater flows in different
scales [49]. Our results mean, that in reality under slight
decrease of soil water content (by about 2 to 4%
vol
), the
water supply will be still more limited than shown in the
given model. Particular figures valid for a period of one
growing season may differ for shorter periods of time,
when the mentioned limits will be still more important.
Fortunately large buffering capacity of heavy soils
smoothed excessive changes in its properties [31, 40],
which supports our conclusions. In general the results
show, that where using applied hydraulic parameters of
soils, the soil water content as well as corresponding soil
Figure 5. Relation of limiting horizontal flow of water result-
ing from soil hydraulic conductivity for a model soil-tree sys-
tem in the floodplain forest, southern Moravia. Lower arrows
indicate values corresponding to most important soil hydrolim-
its. Upper arrows indicate values critical for trees under differ-
ent environmental conditions.
J. C6Lermák and A. Prax
26
water potential do not represent sufficient information
for correct estimation the plant water supply. The
inevitable third soil parameter which is important espe-
cially in heavy soils is the hydraulic conductivity. This
parameter is somewhat tricky, since it may become
severely limiting under seemingly sufficient soil water,
which is significantly higher than that under which the
bulk soil water potential might become limiting. It also
may become important within much lower range of
changes in corresponding soil water contents.
Limits of hydraulic conductivity for soil water supply
in heavy soils may occur in large scales as well as in the
very local scales (down to individual trees or roots). Soil
water content cannot equilibrate between distant places
fast enough and thus significant differences may persist
there. This was observed e.g., in stands of large beech
trees growing on heavy soils [15] or on similar soils near
roots of maple trees growing in the city [18].
3.4. Limitations of the present model
and possible improvements
The time step applied in the model is longer than that
usually taking place under natural conditions (when soil
water can change faster after rain or during severe
drought). However the above described situations were
aimed to demonstrate the phenomena which may play
important role for tree survival under conditions of
seemingly sufficient soil moisture rather than to describe
a particular year or different time steps of water balance
(which is the task of following studies). Situation can be
even more severe under natural conditions, especially if
considering, that substantial changes in transpiration,
which is followed by corresponding changes of sap flow
and absorption of water by roots can proceed very fast in
study species – within minutes or even shorter time
intervals – [13, 27, 32] and similarly fast can probably be
also changes in soil moisture within a boundary layer of
soil adjacent to root surfaces. These questions are under
further studies now.
Individual figures presented in the results are valid for
soil properties present in the given forest stand character-
ized as the defined forest type. (1) Extrapolation of the
model to other sites is possible only provided all neces-
sary quantitative input soil parameters for each site are
available, such as described by Prax [37] in the flood-
plain of Dyje and Moravia rivers in Southern Moravia.
(2) In order to get still more accurate figures on the actu-
al limits of plant water supply, a shorter time step than
one growing season (such as months, days or even
hours) could be applied (as in our following studies). It
is clear that the soil limits will be more strict under such
conditions (e.g., when maximum daily transpiration and
corresponding hydraulic gradients may be about twice as
high as seasonal mean daily transpiration under fine
weather). However, to validate this by the experimental
data would require much more instrumentation (direct
measurement of gradients near all roots, etc.) than was
available at the beginning of studies years ago. (3) Trees
may gradually adapt their root structure to the new situa-
tion when continuously changing the soil water supply.
Such adaptations will differ in different species and trees
of different age and social position – this all will be
reflected by tree behavior in long-term.
3.5. Soil water supply in woody species
with different root systems
The actual size of the tree-root system applied in the
model corresponded to the situation, when trees were
adapted in long-term to the supra-optimal water supply
under high water table and occurrence of regular floods.
Under such situations, some species as oaks develop rel-
atively small root systems – projected area of root sys-
tems is smaller compared to that of crowns – [25]. With
limitations to the water supply after water management
measures in the region we may expect gradual adaptation
of root systems, i.e., increase of root length [28, 30, 41,
43] but only after years; old age may limit adaptive capa-
bilities of large trees [21, 23], especially in heavy soils
[48].
Structural prerequisites of trees seem to be important
for their survival and/or their mortality. Considering the
short-term responses, individual trees with already
developed deeper and/or more extensive root systems are
in a more favorable situation compared to trees with less
developed roots. Most large oaks and ashes in the experi-
mental plot have well developed roots, however in trees
of both species growing in slightly suppressed or inter-
mediate social positions relatively to large trees, poorer
development of root systems was observed [47]. This is
best visible on the root/shoot ratio calculated for the
whole tree level as the ratio of “Root Enveloping Area”
(applied in this study) to sunlit leaf area or “Solar
Equivalent Leaf Area” sensu C6Lermák [5] at the same
stand. Trees with low root/shoot ratio seems to be espe-
cially endangered by drought, because their crowns are
still reaching the main canopy and requiring more water
for transpiration which less developed roots cannot sup-
ply. Minimum root/shoot ratio corresponded to the maxi-
mum of tree mortality recorded over the last 20 years at
the given stand (figure 6).
Shallow root systems were observed in shrubs e.g.,
frequent Cornus sanguinea at the same site [45]. This
Water balance of a Southern Moravian floodplain forest
27
suggests that they might decline first in case of severe
drought (what we observed in reality at the site) since
they can be easily over-competed for water by large
trees. This has been found also elsewhere in similar con-
ditions [15].
3.6. Soil water supply, stand density and health
state of trees
Significant lowering the water supply for transpiration
which leads to decreasing the leaf and root water poten-
tials may reach a level under which the resistance of
roots against fungi is impaired, since some of such
pathogens can grow better under lower potentials than
higher plants. Drought can break the roots physical and
biochemical barriers or increasing the disease suscepti-
bility as a predisposition of infections [3, 42]. This sec-
ondary impact of drought stress was confirmed by the
phytopathologic search in the experimental stand, where
occurrence of different fungi species (e.g., Phellinus
robustus (P.Karst) Bourd.et Galz., Armillaria mellea
(Vahl.ex Fr.) Kumm. and Inonotus dryophilus (Berk.)
Murr.) increased dramatically after partial drought com-
pared to the original status during regular floods (C8Lerny5u,
1990, personal communication). Drought induced infec-
tion by fungi which reduce absorbing surfaces in root
systems and caused increasing mortality (see
figure 6)
also leads to significant lowering the mechanical stabili-
ty of forests. Trees with heavily decomposed roots, typi-
cally with the coarse roots rotten from their tops down to
the distance only slightly longer then stem diameter
(about 1.6 × DBH) from tree trunks easily fell down
under any minor atmospheric perturbations (as wind or
rain). Impaired root system of such trees (even if there
are no visible symptoms) was clearly reflected by signif-
icantly lowering sap flow [9].
Under conditions of limited water supply transpiration
may decrease theoretically in all trees by the same pro-
portion or less in some trees and more in others.
According to the same principle, in some trees transpira-
tion can be reduced to a low level, which does not allow
them to survive. When these trees die, more free space in
the soil (larger portion of stand area to accept precipita-
tion and/or underground water) will remain available for
other neighbor trees, which will improve their situation
(this is the principle of artificial control of tree water
supply through modification of stand density, i.e., thin-
ning). Results of water balance on the level of both
stands and individual trees can be further applied to esti-
mate an acceptable stand density under certain environ-
mental conditions and eventually predict (or prevent)
mortality after their significant changes.
5. CONCLUSIONS
1. In forest stands growing on heavy soils and adapted
to ample underground water supply (where tree root sys-
tems do not occupy the soil completely), it may be useful
to consider two compartments when calculating the
stand water balance: rooted volume (subjected to higher
depletion of water) and root-free (supplementary or
“storage”) volume of soil, connected by the horizontal
transport of water.
2. Under non-limiting underground water and mild
weather (low potential evapotranspiration) transpiration
of forest trees is fully supplied by net precipitation.
Under dry weather, net precipitation supplied only a
fraction of water for actual evapotranspiration and trees
need to extract most of their water demands for transpi-
ration (up to 70%) from the underground water table,
and a significant portion of water from that present in the
supplementary soil volume.
3. Under theoretical conditions of no underground
water supply, actual evapotranspiration must be reduced
at least to the level that would assure that all the water
required for evapotranspiration will be present in the sys-
tem, even for conditions of mild weather. Under dry
Figure 6. Tree mortality associated with unfavorable
root/shoot ratio. “Root/shoot” ratio on the whole (large) tree
level was expressed as the ratio of “Root enveloping area/Solar
equivalent leaf area”. This is compared to the density of living
and dead trees (= mortality over the period of 20 years) in the
experimantal floodplain forest (site Horni les, forest district
Breclav), southern Moravia. Critical values are marked by
arrows.
J. C6Lermák and A. Prax
28
weather it will be reduced more dramatically and may
fall below a level critical for tree survival.
4. Soil hydraulic conductivity is one of the most
important limiting factors for plant water supply. Usual
parameters as the soil water content or soil water poten-
tial are insufficient to explain the plant water supply,
especially on heavy soils under non-saturated conditions.
5. Local drought can occur in heavy soils under rela-
tively high soil water content, usually close to their field
water capacity. This may cause misunderstanding when
interpreting soil water data in terms of tree behavior,
especially when in practice the water content is mea-
sured at a certain distance from absorbing root surfaces.
6. Suppressed trees with less developed root systems
and those which root systems are damaged by fungi can-
not absorb sufficient water due to smaller absorbing sur-
faces, what is easily visible on their low sap flow. Such
trees are less mechanically and functionally stable and
show higher mortality.
Acknowledgements: The authors express their best
thanks to Dipl. Ing. Jiri Kuc3lera, Environmental
Measuring Systems, Brno, for his excellent help with the
sap flow measurement. The study was supported by EU
grant No.ERBEV5V-CT94-0468 and CS grant VS
96077.
REFERENCES
[1] Ambros Z., Water balance of forest stands in the
Carpathians (in Slovak), Lesnictvi-Forestry 24 (1978)
203–221.
[2] Aruga M., Nakamura F., Kikuchi S., Yajima T.,
Characteristics of floodplain forests and their site conditions in
comparison to toeslope forests in the Tokachi river, J. Jpn. For.
Soc. 78 (1996) 354–362.
[3] Ayres P.G., Water relations of diseased plants, in: Water
deficits and plant growth, Vol. V, Academic Press, New York,
San Francisco, London, 1978, pp. 1–60.
[4] C
6Lermák J., Short- and long-term response of transpira-
tion flow rate in full-grown trees to water stress, in: Proc. 18th
IUFRO World Congress, Whole-Plant Physiology Working
Party (S 2.01-15), 7–21 September 1986, Ljubljana, 1986,
pp. 187–193.
[5] C
6Lermák J., Solar equivalent leaf area as the efficient bio-
metrical parameter of individual leaves, trees and stands, Tree
Physiol. 5 (1989) 269–289.
[6] C
6Lermák J., Leaf distribution in large trees and stands in
floodplain forest of southern Moravia, Tree Physiol. 18 (1998)
727–737.
[7] C
6Lermák J., Kuc6lera, J., The compensation of natural tem-
perature gradient in the measuring point during the sap flow
rate determination in trees, Biol Plant (Praha) 23 (1981)
469–471.
[8] C
6Lermák J., Kuc6lera J., Scaling up transpiration data
between trees, stands and watersheds, Silva Carelica 15 (1990)
101–120.
[9] C
5Lermák J., Kuc6lera J., Changes in transpiration of
healthy mature trees due to environmental conditions and of
those with damaged water conductive system, in: Klimo E.,
Materna J. (Eds.), Proc. Cs.MAB Natl. Comm./IUFRO
Internat. Workshop, Verification of hypotheses and possibili-
ties of recovery of forest ecosystems, 4–8 September 1989,
Beskydy Mt., Agr. Univ. Brno., 1990, pp. 275–286.
[10] C
6Lermák J., Deml M., Penka M., A new method of sap
flow rate determination in trees, Biol Plant (Praha) 15 (1973)
171–178.
[11] C
6Lermák J., Ulehla J., Kuc6lera J., Penka M., Sap flow
rate and transpiration dynamics in the full-grown oak (
Quercus
robur
L.) in floodplain forest exposed to seasonal floods as
related to potential evapotranspiration and tree dimensions,
Biol Plant (Praha) 24 (1982) 446–460.
[12] C
6Lermák J., Kuc6lera J., Stepankova M., Water consump-
tion of full-grown oak (
Quercus robur L.) in a floodplain forest
after the cessation of flooding, in: Penka M., Vyskot M., Klimo
E., Vasicek F. (Eds.), Floodplain forest ecosystem II, Dev.
Agric. Mana. For. Ecol. 15B, Elsevier, Amsterdam, Oxford,
New-York, Tokyo, 1991, pp. 397–417.
[13] C6Lermák J., Kuc6lera J., Extremely fast changes of xylem
water flow rate in mature trees, caused by atmospheric, soil
and mechanical factors, in: Raschi A., Borghetti M. (Eds.),
Proc. CEC Internat. Workshop, Methodologies to assess the
impacts of climatic changes on vegetation: analysis of water
transport in plants and cavitation of conduits, 29–31 May 1991,
Florence, 1991, pp. 181–190.
[14] C
6Lermák J., Michalek J., Selection of sample trees in
forest stands using the “quantiles of total” (in Czech), Lesnictvi
37 (1991) 49–60.
[15] C
6Lermák J., Matyssek R., Kuc6lera J., Rapid response of
large, drought stressed beech trees to irrigation, Tree Physiol.
12 (1993) 281–290.
[16] C
6Lermák J., Kravka M., Krejzar T., Kuc6lera J., Studies
of revitalization of floodplain forests in southern Moravia. I.
Transpiration of floodplain forest in Lednice during periods
with no natural and artificial floods (in Czech), Res. Rep. Inst.
For. Ecol., Mendel Univ. Brno for the Ministry of Agriculture
and the Forest Enterprise of Czech Republic in Zidlochovice,
1995, 20 p.
[17] C
6Lermák J., Cienciala E., Kuc6lera J., Lindroth A.,
Bednarova E., Individual variation of sap flow rate in large
pine and spruce trees and stand transpiration: A pilot study at
the central NOPEX site, J. Hydrol. 168 (1995) 17–27.
[18] C
6Lermák J., Hruska J., Martinkova M., Prax A., City
tree roots and survival near houses analyzed using sap flow and
ground penetrating radar technique, Plant and Soil 219 (2000)
103–115.
[19] Cienciala E., Kuc
6lera J., Lindroth A., C6Lermák J., Grelle
A., Halldin S., Canopy transpiration from a boreal forest in
Sweden during a dry year, Agric. For. Meteorol. 86 (1997)
157–167.
Water balance of a Southern Moravian floodplain forest
29
[20] Collective, Elements of the legend for the soil map of
Europe at scale 1:1000000, FAO, Rome, 1970.
[21] Dister E., Flood tolerance of floodplain forest trees on
loamy sites (in German), Verhandlungen der Gesselschaft fur
Okologie 10 (1983) 325–336.
[22] Herbst M., Eschenbach K., Kappen L., Water use in
neighbouring stands of beech (Fagus sylvatica L.) and black
alder (Alnus glutinosa (L.) Gaertn.), Ann. For. Sci. 56 (1999)
107–120.
[23] Hughes F.M.R., The influence of flooding regimes on
forest distribution and composition in the Tana river flood-
plain, Kenya, J. Appl. Ecol. 27 (1990) 475–491.
[24] Joffre R., Rambal S., How tree cover influences the
water balance of Mediterranean rangelands, Ecology 74 (1993)
570–582.
[25] Korpel St., Growth, production and form of individual
trees (in Czech), in: Vyskot M. (Ed.), Zaklady rustu a produkce
lesu, SZN, Praha, 1971, pp. 157–213.
[26] Krontorad K. Water regime and ecologically important
physical properties of semigley soils under the floodplain forest
of southern Moravia, in: Ecosystem study on floodplain forest
in southern Moravia, Czechoslovak IBP Report No. 4, Univ.
Agric. Brno, 1974, pp. 329–337.
[27] Kuc
6lera J., C6Lermák J., Penka M., Improved thermal
method of continual recording the transpiration flow rate
dynamics, Biol Plant (Praha) 19 (1977) 413–420.
[28] Linder S., Axelsson B., Changes of carbon uptake and
allocation patterns as a result of irrigation and fertilization in a
young Pinus sylvestris stand, in: Waring R.H. (Ed.), Carbon
Uptake and Allocation in Subalpine Ecosystems as a Key to
Management, Univ. Oregon, Corvallis, Oregon, 1982,
pp. 38–44.
[29] Lozek V., Nature in quarternary period (in Czech),
Priroda ve ctvrtohorach, National Agric. Publ. House, SZN
Praha, 1973, 350 p.
[30] Mooney H.A., Winner W.E., Carbon gain and growth
as affected by atmospheric pollutants., in: Schulte-Hostede S.,
Darral N.M., Blank L.W., Wellburn A.R. (Eds.), Air pollution
and plant metabolism, Elsevier, London, New-York, 1988,
pp. 272–287.
[31] Nemec J., Hydrology (in Czech), National Agric. Publ.
House, SZN, Prague, 1965, 240 p.
[32] Pallardy S.G., C
6Lermák J., Ewers F.W., Kaufmann
M.R., Parker W.C., Sperry J.S., Water transport dynamics in
trees and stands, in: Smith P.G., Hinckley T.M. (Eds.),
Resource physiology of conifers-acquisition, allocation and uti-
lization, Academic Press, San Diego, New-York, Boston,
London, Sydney, Tokyo, Toronto, 1995, pp. 301–389.
[33] Pelisek J., The dynamics of ecological soil properties in
floodplain forest of south Moravia (Lednice) under the impact
of water management (in Czech), in: Proc. Funkce, produktivi-
ta a struktura ekosystemu luzniho lesa, Publ.VSZ Brno, 1975.
[34] Penka M., C
6Lermák J., Stepanek V., Palat M., Diurnal
courses of transpiration rate and transpiration flow rate as
determined by the gravimetric and thermometric methods in a
full-grown oak tree (
Quercus robur L), Acta Univ. Agric.
(Brno) Ser C 48 (1979) 3–30.
[35] Penka M., C
6Lermák J., Prax A., Ulehla J., Zidek V.,
Water consumption of oak (
Quercus robur L.) in the alluvium
of the Dyje river in non-limiting moisture conditions (in
Czech), Lesnictvi-Forestry 29 (1983) 481–496.
[36] Pivec J., A comparison of actual evapotranspiration of
a floodplain forest in S. Moravia six and 15 years after regular
floods (in Czech), Lesnictvi 39/5 (1993) 187–191.
[37] Prax A., The hydrophysiological properties of the soil
and changes in them, in: Penka M., Vyskot M., Klimo E.,
Vasicek F. (Eds.), Floodplain Forest Ecosystem II, Elsevier,
Amsterdam coed. Academia, Prague, 1991, pp. 145–168.
[38] Prax A., Palat M., Soil moisture regime of South-
Moravian floodplains (in German), Arch. Hydrobiol. Suppl.
101, Large Rivers 9 (1995) 513–523.
[39] Putz F.E., Parker G.G., Archibald R.M., Mechanical
abrasion and intercrown spacing, Am. Midl. Nat. 112 (1984)
24–28.
[40] Rakhmanov V.V., Hydroclimatic role of forests (in
Russian), Leshnaya promyshlennost, Moscow, 1984, 240 p.
[41] Riedacker A., Rythmes de croissance et de régénéra-
tion des racines des végétaux ligneux, Ann. Sci. For. 33 (1976)
109–138.
[42] Schoeneweiss D.F., Water stress as a predisposing fac-
tor in plant disease, in: Water deficits and plant growth, Vol. V,
Academic Press, New-York, San Francisco, London, 1978,
pp. 61–90.
[43] Schulze E D., Chapin F.S., Plant specialization to
environments of different source availability, Ecol. Stud. 61
(1987) 120–148.
[44] Uhrecky I., Smolik Z., Havlicek V., Mrkva R.,
Radiation, temperature and rainfall regimes of the floodplain
forest ecosystem, in: Penka M., Vyskot M., Klimo E., Vasicek
F. (Eds.), Floodplain forest ecosystem I, Elsevier, Amsterdam
coed. Academia, Prague, 1985, 33–51.
[45] Vasicek F., Shrub layer in the ecosystem of floodplain
forest (in Czech), Res. Rep. VI-2-1/B, Univ. Agr. Brno., 1975.
[46] Vasicek F., Natural conditions of floodplain forests, in:
Penka M., Vyskot M., Klimo E., Vasicek F. (Eds.), Floodplain
Forest Ecosystem 1, Elsevier, Amsterdam coed. Academia,
Prague, 1985, pp. 13–29.
[47] Vyskot M., Tree story biomass in lowland forest in
south Moravia, Rozpravy CSAV 86 Publ. Academia, Praha,
1976, 166 p.
[48] Wendelberger G., Heavy-hardwood forest subject to
(regular) flooding: a contribution to the ecology of the Central
European floodplain forest, Vegetatio 5-6 (1973) 253–281.
[49] Xian-Huan Wen, Gomez-Hernandez J.J., Upscaling
hydraulic conductivities in heterogenous media: An overview,
J. Hydrol. 183 (1996) 9–32.
[50] Zidek V., Actual and potential evapotranspiration in
the floodplain forest, Ekologia 7 (1988) 43–59.


![Tài liệu Báo cáo khoa học: Specific targeting of a DNA-alkylating reagent to mitochondria Synthesis and characterization of [4-((11aS)-7-methoxy-1,2,3,11a-tetrahydro-5H-pyrrolo[2,1-c][1,4]benzodiazepin-5-on-8-oxy)butyl]-triphenylphosphonium iodide doc](https://media.store123doc.com/images/document/14/br/vp/medium_vpv1392870032.jpg)