Báo cáo khoa học: "Hydraulic architecture of trees: main concepts and results" pdf
Bạn đang xem bản rút gọn của tài liệu. Xem và tải ngay bản đầy đủ của tài liệu tại đây (2.45 MB, 30 trang )
P. Cruiziat et al.Hydraulic architecture of trees
Review
Hydraulic architecture of trees: main concepts and results
Pierre Cruiziat
*
, Hervé Cochard and Thierry Améglio
U.M.R. PIAF, INRA, Université Blaise Pascal, Site de Crouelle, 234 av. du Brezet, 63039 Clermont-Ferrand Cedex 2, France
(Received 10 March 2001; accepted 13 February 2002)
Abstract – Since about twenty years, hydraulic architecture (h.a.) is, doubtless, the major trend in the domain of plants (and especially trees) wa
-
ter relations. This review encompasses the main concepts and results concerning the hydraulic of architecture of trees. After a short paragraph
about the definition of the h.a., the qualitative and quantitative characteristics of the h.a. are presented.Thisisanoccasionto discuss the pipe mo-
del from the h.a. point of view. The second part starts with the central concept of embolism and give a review of important experimental results
and questions concerning summer and winter embolism. The last part deals with the coupling between hydraulic and stomatal conductances. It
discusses the theoretical and experimental relationships between transpiration and leaf water potential during a progressive soil drought, the in-
crease of soil-root resistance and its consequences in term of xylem vulnerability, the factors controlling the daily maximum transpiration and
how stomates can prevent “run away embolism”. In conclusion different kinds of unsolved questions of h.a., which can be a matter of future in-
vestigations, are presented in addition with a classification of trees behaviour under drought conditions. To end, an appendix recalls the notions
of water potential, pressure and tension.
hydraulic architecture / cohesion-tension theory / summer embolism / winter embolism / drought resistance
Résumé – Architecture hydraulique des arbres : concepts principaux et résultats. Sans aucun doute, depuis une vingtaine d’années, l’archi
-
tecture hydraulique (a.h.) est devenue une approche majeure dans le domaine des relations plantes-eau (et particulièrement pour les arbres).
Cette revue présente les principaux concepts et résultats concernant l’a.h. Après un bref paragraphe sur la définition de l’a.h., les caractéristiques
qualitatives et quantitatives définissant l’a.h. sont passées en revue. À cette occasion le « pipe model » est discuté du point de vue de l’a.h. La se
-
conde partie commence avec le concept central d’embolie et continue avec une présentation des principaux résultats et questions touchant l’em
-
bolie estivale et l’embolie hivernale. La dernière partie analyse le « couplage » entre les conductances hydraulique et stomatique. Il y est discuté
des relations théoriques et expérimentales entre la transpiration et le potentiel hydrique foliaire durant la mise en place d’une sécheresse progres
-
sive du sol, de l’augmentation de la résistance sol-racines et de ses conséquences en terme de vulnérabilité du xylème, des facteurs contrôlant la
transpiration maximale journalière et de quelle manière les stomates peuvent prévenir l’emballement de l’embolie. La conclusion fait état de dif
-
férentes questions non résolues, qui pourraient faire l’objet de recherches futures et esquisse une classification du comportement des arbres vis-
à-vis de la sécheresse. Pour finir, un appendice rappelle les notions de potentiel hydrique, de pression et de tension.
architecture hydraulique / théorie de la cohésion-tension / embolie estivale / embolie hivernale / résistance à la sécheresse
Ann. For. Sci. 59 (2002) 723–752
723
© INRA, EDP Sciences, 2002
DOI: 10.1051/forest:2002060
* Correspondence and reprints
Tel.: +33 04 73 62 43 66; fax: +33 04 73 62 44 54; e-mail:
1. INTRODUCTION
During the last decades a new approach of plant and, espe
-
cially, tree water relations has developed. It is well structured
around two main axes: the cohesion-tension theory [37, 38,
92] of the ascent of sap which deals with the physics of the
sap movement, and the electrical analogy used for modeling
water transport within the tree and in the soil-plant water con
-
tinuum, using resistances, capacitances, water potentials,
flow. Presentation of the cohesion-tension theory and its cur
-
rent controversies have been presented in many recent papers
[26, 33, 82, 113, 135]. The use of an electrical analogy for de
-
scribing the water transfer through the soil-plant water sys
-
tem is rather old: the idea probably comes from Gradmann
[47], but really begins with the article “Water transport as a
catenary process” by Van den Honert [143]. It was the main
formalism used to deal with water transport in the soil-plant-
atmosphere continuum from that date until the 1980’s, before
the hydraulic architecture approach takes over.
It is important to remember that after a period of intense
work and debate (from the end of the 19th century to ca. the
first half of the 20th), research on the cohesion-tension theory
was abandoned with focus instead put on Ohm’s law analogy
[32]. The resurrection of studies concerning this theory is
mainly the result of some pioneers like J.A. Milburn, M.H.
Zimmermann and M.T. Tyree.
Hydraulic architecture (h.a.) has made a big improvement
in our knowledge by taking into account these two ap-
proaches and linking them in a way which allows a much
more realistic and comprehensive vision of tree water rela-
tionships. Although several papers have been devoted to h.a.
[23, 89, 127, 137], we think that there is still a place for a
comprehensive and updated introduction intended, as a hand
-
book for frequent reference, to scientists, technicians who are
working on tree functioning from one way or another, and
students learning tree physiology, but without being special
-
ized in plant water relations. Therefore, to facilitate the un
-
derstanding, many illustrations have been included in the text
where explanations of the figures could be given at greater
length than in the legend.
2. CHARACTERIZATION OF THE HYDRAULIC
ARCHITECTURE (H.A.)
2.1. What is the hydraulic architecture?
The h.a. can be considered as a quite well defined region
within the vast domain of tree water relations. The expression
“hydraulic architecture” was coined by Zimmermann proba
-
bly in 1977/78, after the first congress on “The architecture of
Trees” organized in 1976 in Petersham (MA, USA) by Hallé,
Tomlinson and Oldeman, during which he probably got the
idea. However, surprisingly, his article of 1978 and, espe
-
cially, his remarkable book “Xylem Structure and The Ascent
of sap” (1983), whose chapter 4 is entitled “Hydraulic
Architecture”, does not contain any definition of this new ex
-
pression.
Since that time several definitions have been proposed:
– “h.a. describes the relationship of the hydraulic conduc
-
tance of the xylem in various parts of a tree and the amount of
leaves it must supply” [125];
– “h.a. governs frictional resistance and flow capacity of
plant organs” [89];
– “h.a. is the structure of the water conducting system”
[127];
– “h.a., that is how hydraulic design of trees influences
the movement of water from roots to leaves” (Tyree, 1992,
unpublished talk);
– “the set of hydraulic characteristics of the conducting
tissue of a plant which qualify and quantify the sap flux from
roots to leaves” (Cochard, 1994, unpublished talk).
The soil-root interface can be considered either as a
boundary conditions of the plant’s hydraulic architecture or
as a part of this hydraulic system. As we will see in Section 4,
it plays an importantrole in the tree’s water use, in any case.
In fact, h.a. has two different meanings:
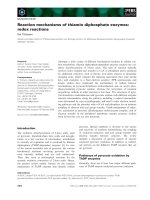
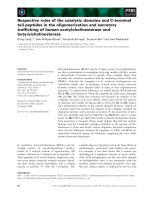
(a) A special approachto the functioning of a tree as a hydrau-
lic system. A tree can be considered as a kind of hydraulic
system (figure 1). Any such system (dam, irrigation system
for crops or houses, human blood vascular system, etc.) is
composed of the same basic elements: a driving force, pipes,
reservoirs, regulating systems. For trees (and for plants in
general) the driving “force” is, most of the time, the transpira-
tion which, as the cohesion-tension theory states, pulls water
from the soil to the leaves, creates and maintains a variable
gradient of water potential throughout the plant. The energy
requirement for transpiration is mainly solar radiation. Thus,
when transpiration occurs, the water movement is a passive
process along a very complex network of very fine capillaries
(vessels and tracheids), which form the xylem conducting
system. This conducting (or vascular) system has two kinds
of properties: qualitative and quantitative properties.
(b) The result of this approach in terms of maps of the differ
-
ent hydraulic parameters and other measured characteristics,
which define the peculiar h.a. of a given tree. It is of course
impossible to build such a complete hydraulic map for a large
tree; only parts of this map are usually drawn which give
some general or species-dependentcharacteristics of the h.a.
Examples of relevant questions which can be answered
through a study of h.a. are: “How do trees without apical con
-
trol ensure that all branches have more or less equal access to
water regardless of their distance from the ground? In times
of drought how do trees program which branches are sacri
-
ficed first? [127]. What determines the highest level of refill
-
ing after embolism? Can we explain some of the differences
in life history or phenology of trees or even herbaceous plants
(e.g. drought deciduousness) in terms of differences in
724 P. Cruiziat et al.
hydraulic architecture? Does hydraulic constraints limit tree
height or tree growth?
2.2. Qualitative characteristics of the hydraulic
architecture
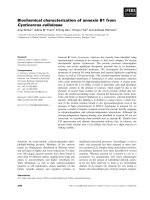
The hydraulic architecture of a tree shows three general
qualitative properties: integration, compartmentation and re
-
dundancy.
Integration (figure 2, right) means that in most cases (for
exceptions see for example [145], the vascular system of a
tree seems to form a unique network in which any root is
more or less directly connected with any branch and not with
a single one. In other words, the vascular system of a tree
forms a single, integrated network. Let us represent the tree
vascular system by a graph, each leaf and each fine root being
Hydraulic architecture of trees 725
Figure 1. Tree as a hydraulic system; P = pump; g
s
= stomatal
conductance; wr = water reservoir.
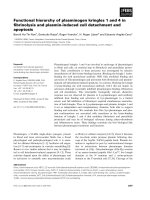
Figure 2. Illustration of the three main qualitative characteristics of
the hydraulic architecture of a tree: integration, compartmentation
and redundancy.
a different summit. To say that the vascular system forms a
unique network means that there is always at least one path
between any given summit (between any given root and any
given leaf). It is of course impossible to check such an as
-
sumption with a large tree. Nevertheless the main idea to
keep in mind is the fact that within a tree many possible ana
-
tomical pathways, with different resistances, can be used to
connect one shoot and one root. It means that water is allowed
to flow not only vertically along the large number of parallel
pathways formed by files of conducting elements, but also
laterally by the pit membrane of these elements which pro
-
vide countless transversal ways between them. Among the
different observations supporting this conclusion, two can be
quoted: the dye injection experiments and the split-roots ex
-
periments. Roach’s work [97] deals with tree injection, i.e.
when a liquid is introduced into a plant through a cut or a hole
in one of its organs. As Roach said: “The development of
plant injection was mainly the indirect result of the attempts
of plant physiologists to elucidate the cause of the ascent of
sap in trees”. Unfortunately the work of Roach is not aimed at
tracing the path followed by the transpiration stream. Never
-
theless and even if we should be aware of the fact that dyes
and water pathways can differ, Roach’s work gave extremely
interesting and curious information about the connections be-
tween different parts of a tree from the leaf level to the whole
tree level. As an illustration, here are some quotations from
his article:
– “In working with young leaflets, such as those of to-
mato, a half leaflet is the smallest practical injection unit”
(p. 177);
– “If a leaf-stalk injection be carried out on a spur carry-
ing a fruit either the whole fruit or only a single sector of it
may be permeated, according to the position of the injected
leaf-stalk in regard to the fruit” (p. 183);
– “Experience with apple and other trees has shown that
the cut shoot immersed in the liquid must be at least as large
as the one to be permeated, otherwise permeation will not be
complete” (p. 197);
– “The lower the hole is placed on the branch the greater
is the amount of liquid which enters other parts of the tree”
(p. 202);
– “There is not a root corresponding to each chief branch
and the roots seem to divide quite independently of the divi
-
sion into branches” (p. 207).
The results of Roach are difficult to interpret because they
are very dependent on the experimental conditions (time of
the year, transpiration and soil water conditions, etc.) on the
one hand and the species (distribution of the easiest pathways
between a given point, injection point, and the rest of the tree)
on the other hand. In split-root experiments [5, 45, 62] part of
the roots of a plant is in a dry soil compartment, the rest being
in a well-watered soil. Under these conditions, which in fact,
reproduce what happens for the root system of a tree in a dry
-
ing soil, the whole shoot and not just part of it, is supplied
with water.
Compartmentation (figure 2, middle) is almost the oppo
-
site property of the vascular system. It simply follows from
the fact that the conducting system is built up to hundreds of
thousands or millions or even more elementary elements, tra
-
cheids and vessels. Each element is a unit of conduction, in
communication with other elements by very special struc
-
tures, the pits, which play a major role in protecting the con
-
ducting system from entrance of air (see Section 3.4.). There
are two main types of conduits: tracheids and vessels. Even if
some tracheids can be quite long (5–10 mm), those of most of
our present-day conifers do not exceed 1 or 2 mm. By con
-
trast, vessels, especially in ring porous trees like oaks, can
reach several meters, and may even, be as long as the plant
(John Sperry, personal communication). However in most
cases (there are notable exceptions, like oak species), these
conduits are very short in comparison with the total length of
the vascular system going from roots to leaves. It forms a
kind of small compartment. When air enters the vascular sys
-
tem it invades an element. Such a property is the necessary
property complementary to integration because it allows the
conducting system to work under a double constraint: to be
continuous for water, and discontinuous for air. In fact, con-
duit length affects water transport in two opposing ways [29,
154]. Increased length reduces the number of wall crossings,
therefore increasing the hydraulic conductance of the vascu-
lar pathway. However, a countering effect arises, when cavi-
tation occurs, from the fact that a pathway composed of long
conduits will suffer a greater total conductance loss for an
equivalent pressure gradient. Another aspect that can be
linked up with compartmentation is the “hydraulic segmenta-
tion” idea of Zimmermann [154] which can be defined “as
any structural feature of a plant that confines cavitation to
small, distal, expendable organs in favor of larger organs rep
-
resenting years of growth and carbohydrates investment”
[127].
Redundancy (figure 2, left) has two meanings in the pres
-
ent context. First of all, it says that in any axis (trunk, branch,
twig, petiole), at a given level, several xylem elements are
present, like several pipes in parallel. Therefore if one ele
-
ment of a given track is blocked, water can pass along another
parallel track. This is very well illustrated by saw cutting ex
-
periments [70]. The second meaning has been pointed out by
Tyree et al. [133]. It takes into account an additional anatomi
-
cal fact: in general a track of conducting elements is not alone
but is in close lateral contact with other track of vessels or tra
-
cheids. In this case redundancy can be defined (in quantita
-
tive terms) as the percentage of wall surface in common.
Such a design where conduits are not only connected end to
end but also through their side walls, shows pathway redun
-
dancy. Figure 2 (left) clearly indicates that in this case the
same embolism (open circles) does not stop the pathway for
water movement. Redundancy is higher in conifers than in
vessel-bearing trees.
726 P. Cruiziat et al.
2.3. Quantitative characteristics
of hydraulic architecture
Quantitative characteristics concern the two main ele
-
ments of the conducting system, namely the resistances and
the reservoirs. Several expressions deal with the resistances
or the inverse, the conductances. In fact, two main types of
quantities are used: conductances (k), where flow rate is ex
-
pressed per pressure difference, and conductivities (K),
where flow rate is expressed per pressure gradient. When ei
-
ther a conductivity or a conductance is expressed per area of
some part of the flow path, the k and K can be provided with a
suffix (ex.: “s” for xylem area, “l” for leaf area, “p” for whole
plant leaf area, “r” for root area, “g” for ground area, etc.).
The hydraulic conductance k (kg s
–1
MPa
–1
) is obtained by
the measured flow rate of water (usually with some % of KCl
or other substance that prevent the presence of bacteria or
other microorganisms which tend to block the pits) divided
by the pressure difference inducing the flow. Hydraulic con
-
ductance is then the reciprocal of resistance. The water can be
forced through isolated stem, root or leaf segment by applied
pressures, by gravity feed, or drawn by vacuum with similar
results, as long as the pressure drop along the plant segment is
known. Hydraulic conductance refers to the conductance for
the entire plant part under consideration [43].
The hydraulic conductivity K
h
(kg s
–1
MPa
–1
m) is the most
commonly measured parameter. K
h
is the ratio between water
flux (F, kg s
–1
) through an excised branch segment and the
pressure gradient (dP/dx, MPa m
–1
) causing the flow (figure 4).
The larger K
h
, the smaller its inverse, the resistance R. K
h
can
also be considered as the coefficient of the Hagen-Poiseuille
law which gives the flow (m
3
s
–1
) through a capillary of radius
r due to a pressure gradient ∆P/∆x along the pipe:
Flow = dV/dt = (ρ r
4
/8 η)/(∆P/∆x)=K
h
(∆P/∆x)
with V = volume of water; ρ = the density of water; η = coef
-
ficient of viscosity of water (kg m
–1
s
–1
) and t = time.
Viscosity depends upon solute content (for example, a
concentrated sugar solution is quite viscous and slows down
the flow considerably). In general, the solute concentration of
xylem sap is negligible and does not measurably influence
viscosity. Viscosity is also temperature-dependant [1, 25]. It
is important to note that flow rate, dV/dt, is proportional to
the fourth power of the capillary diameter. This means that a
slight increase in vessel or tracheid diameter causes a consid
-
erable increase in conductivity. As an example [154] lets us
suppose we have three vessels. Their relative diameters are 1,
2 and 4 (for example 40, 80 and 160 µm). Under comparable
conditions, the flow in the first capillary being 1, will be 16 in
the second and 256 in the third. This tells us that if we want to
compare conductivities in different woody axes, we should
not compare their respective transverse-sectional vessel area,
vessel density or any such measure. We must compare the
sums of the fourth powers of their inside vessel diameters (or
radii). As a consequence, small vessels carry an insignificant
amount of water in comparison with large ones. In the
previous example, the smallest capillary would carry 0.4%,
the middle one 5.9% and the large one 93.8% of the water.
When many capillaries of different diameters, d
i
, are pres
-
ent in parallel, like the vessels in the transverse section of a
branch, the Poiseuille-Hagen law is written as follows:
Flow K P / x with K d
hh i
4
i=1
n
==
∑
∆∆ ().πρ/128η) (
The principle of measurement of the hydraulic conductiv
-
ity K
h
proceeds from the above equation. The branch segment
is submitted to a small water pressure difference ∆P which in
-
duces a flux. This flux is measured with a suitable device like,
for example, a recording balance. Knowing the flux, ∆P, and
the length L of the sample, K
h
can be calculated. It should be
remembered that, although the principle of this method is
very simple, its applicationrequires many precautions [107].
According to the Hagen-Poiseuille law, K
h
should in
-
crease if the number n of conduits per unit-branch cross-sec
-
tion or the average conduit diameter increases. However it is
important to realize that when measuring K
h
of a branch, one
does not refer either to the diameter of the conducting ele
-
ments or to their number. Therefore, saying that K
h
can be
viewed as the coefficient of the Hagen-Poiseuille law does
not imply that K
h
is proportional to r to the fourth power.
There is no simple and stable relation between the total cross
section of a branch and the composite conducting surface of
the tracheids or vessels, which change along the branch.
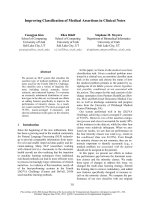
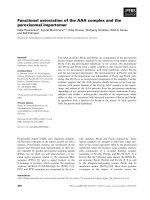
Regression curves of K
h
versus branch diameter are shown in
figure 3 [16]. They lead to a relation between K
h
and S as: K
h
=
S
α
with 1 < α <2.
Hydraulic architecture of trees 727
Figure 3. Example of regression between the hydraulic conductivity
K
h
, and the diameter of the different tree species. Note that all coeffi
-
cients of regression are > 2, meaning that K
h
is more than proportional
to the branch section (from [16]).
Whole plant leaf specific conductance k
p
(kg s
–1
MPa
–1
m
–2
)
can be calculated by dividing the measured flow rate of water
through the stem by the pressure difference and the total leaf
surface of the tree. It is a useful parameter because it allows
calculation of the soil-to-leaf average pressure drop for a
given rate of water.
Recently, published results [144, 156], have shown an
effect of ionic composition on hydraulic conductance. This
effect seems to be small (10%) in most of the experimented
plants species and dose-dependent, but it can be significant in
other plants, depending on the ion concentration, pH, and
non-polar solvent. In addition, concerning the significance of
728 P. Cruiziat et al.
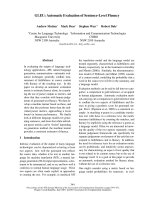
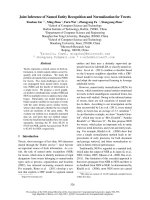
Figure 4. Examples of results of the hydraulic conductivity K
h
, and leaf specific conductivity K
l
. A: Log-log relation between K
h
(ordinate) and
stem diameter (excluding barck, abscissa) per unit stem lenght for Thuja,
; Acer, ; Schefflera, (from [128]). B: Same log-log relation for
the same species, but for leaf specific conductivity K
l
(from [128]). C: Log-log relation between K
h
(ordinate) and stem diameter (excluding
barck, abscissa) for three types of shoots of Fagus sylvestris (from Cochard, unpublished data). D: Ranges of K
l
by phylogeny or growth form,
read from the bottom axis. Dashed line indicates Ficus spp; “x” indicates a range too short to be represented (from [90]).
these results in relation to the paradigm of the xylem as a sys
-
tem of inert pipes, they also suggest that measurements of
conductance should be made with standard solutions, in term
of ionic concentration at least.
Hydraulic resistance R
h
, and hydraulic specific resistance
R
hs
. Definition of these two quantities derives from the basic
Ohm’s equation: flux = ∆Ψ/R
h
. Therefore the units of hydrau
-
lic resistances will depend on those expressing the flux (as
-
suming ∆Ψ is in MPa). For flux expressed in kg s
–1
,R
h
will
be in MPa kg
–1
s and for flux expressed as a density of flux
(the corresponding surface referring to either the sap wood or
the leaf surface), then R
hs
will be in MPa kg
–1
sm
2
(see fig
-
ure 15C as an example where kg is replaced by dm
3
).
The specific conductivity K
s
which is given by K
s
=K
h
/S
(kg s
–1
m
–1
MPa
–1
), where S is the sapwood cross-section and
K
h
the hydraulic conductivity expressed in kg s
–1
m MPa
–1
.It
is a measure of the “porosity” of the branch segment. As there
are many ways to determine this cross-section it is important
to specify which one is used, otherwise differences in K
s
can
-
not be directly compared. Besides, according to its defini
-
tion, K
s
is proportional to the section of conducting wood of a
branch: it means that the Poiseuille-Hagen law is no more
valid at the branch level, since along the branch the composi-
tion of wood (distribution and number of conducting ele-
ments of different diameter) will vary.
The leaf specific conductivity K
l
(kg s
–1
m MPa
–1
)isob-
tained when K
h
is divided by the leaf area distal to the branch
segment (A
l
,m
2
). This is a useful measure of how a branch
supplies water to the leaves it bears. Its main use is to calcu-
late the pressure gradients along an axis. Let us suppose that
we know the average transpiration flux density (T, kg s
–1
m
–2
)
from the leaves supplied by the branch segment and that there
is no capacitance effect (no change in the water content), then
the pressure gradient in the branch segment (dP/dx) is equals
to T/K
l
. So the higher the K
l
, the lower the dP/dx needed to
supply the leaves of this axis with water. This conclusion in
-
volves two constraints: transpiration per leaf surface is the
same, capacitance effects are negligible. A water potential
gradient ∆Ψ/∆x is therefore defined for a given rate of tran
-
spiration.
The Hubert value HV. Among the different approaches
which have been worked out to get a better understanding of
the building of this vascular system, Huber [56] made several
measures of the following ratio, named by Zimmermann
[154], the “Huber Value” (HV) defined as the sapwood cross-
section (or the branch cross-section) divided by the leaf area
(or sometimes the leaf dry weight) distal to the branch. It is
easy to see that K
l
=HV× k
s
.
Two main series of results (expressed as the ratio of the to
-
tal cross section, in mm
2
, of the xylem at a given level, over
the total fresh weight of leaves above that level, in g), have
been obtained by Huber:
– inside a tree this HV is not constant: sun leaves have
larger HV than shade leaves as the apical shoot in comparison
with the lateral branches;
– between species adapted to various climates, large dif
-
ferences also exist: Dicots and Conifers from temperate cli
-
mates of the north hemisphere have HV values around
0.5 mm
2
g
–1
. For species living in humid or shaded sites, HV
values are lower: 0.2 for underground story herbs, 0.02 for
Nymphea. On the contrary, plants from dry and sunny coun
-
tries have HV of 5.9 in average. It is interesting to note that
succulents, which have solved the problem of water supply
by storage, show very low HV, around 0.10. We will see
hereunder that this approach is close to the pipe model pro
-
posed by Shinozaki.
As quoted by Zimmermann [154] this parameter is not
very useful for two main reasons. Firstly, the true conducting
surface of a trunk or branch is a variable portion of the whole
section, which should be determined. Secondly and more im
-
portant (see above the discussion of the Poiseuille law), the
flux of a capillary is proportional to the fourth power of the
radius. In other words, through the same cross section of
wood and with the same gradient of water potential, dΨ/dx,
small to very large fluxes can run depending on the distribu-
tion of the section of the vessel elements. This is why Zim-
mermann [153] has proposed the use of the K
l
.
Water-storage capacity. There is considerable evidence
that trees undergo seasonal and diurnal fluctuations in water
content. These fluctuations can be viewed as water going into
and out of storage. Water-storage capacity can be defined in
different ways [43]. The relationship between water content
and water potential is known as the (hydraulic) capacitance,
C
w
, of a plant tissue; it is the mass of water ∆M
w
, that can be
extracted per MPa (or bar) change in water potential (∆Ψ)of
the tissue: C
w
= ∆M
w
/∆Ψ (kg MPa
–1
). It is also customary to
define C
w
for a branch as C
w
per unit tissue volume
(kg MPa
–1
m
–3
) or for leaves, per unit area (kg MPa
–1
m
–2
). In
general these capacitances are difficult to measure, especially
because they are not constant but vary with the water poten
-
tial. Another expression is the water-storage capacity (WSC),
which is the quantity of water that can be lost without irre
-
versible wilting. Theoretically, WSC = V(1 – θ), where WSC
is the storage capacity (e.g. in kg), V is the weight of water
when the tissue is at full turgidity and θ is the critical relative
water content leading to irreversible wilting (dimensionless
number less than 1). There are practical problems in applying
the above equation [43].
According to Zimmermann [154] there are three mecha
-
nisms involved in water storage in a tree: capillarity, cavita
-
tion and elasticity of the tissues. Cavitation and capillarity
effects are the most poorly understood of these. Elasticity of
tissue is certainly, for most species, the prevailing mecha
-
nism of water storage. Living cells of different parts of the
tree have high water content and “elastic” walls. They act as
minute water reservoirs having a given capacitance in a
Hydraulic architecture of trees 729
series-parallel network arrangement. When cells rehydrate,
they swell, when they dehydrate, they shrink. The
ecophysiological significance of the storage capacity of trees
is that it may influence the ability of the tree to continue pho
-
tosynthesis and, even growth, despite temporary drought
conditions.
Some results involving the previous definitions will now
be given. Figure 4A [128] shows some examples of K
h
data,
and figure 4B [128] the relationship between the logarithm of
K
h
and the logarithm of the diameter of the stem for three spe
-
cies. The relation is approximately linear. More important,
when the diameter changes by two orders of magnitude (1 to
100), K
h
varies by six orders of magnitude. As a consequence,
K
h
will change along a branch. The figure also shows large
differences between the K
h
of branches belonging to different
species. For example the smallest leaf-bearing branches of
Schefflera had K
h
close to those of Acer branches of the same
diameter. However, K
h
of larger branches (20 to 30 mm in di
-
ameter) were 3 to 10 times larger in Schefflera than in Acer.
Thuja has K
h
s 10 to 20 times smaller than the other two spe
-
cies for branches of the same diameter [128]. Figure 4C
shows with Fagus sylvatica another interesting result which
demonstrates that there are links between the “botanical” ar-
chitecture as developed by the French School of Montpellier
[11, 54] and the hydraulic architecture. The curves express
the same type of correlation between the logarithm of K
h
and
the logarithm of the diameter for one year shoots. The upper
curve summarizes data from long shoots, the lower curve
data from short shoots. It is clear that for a given diameter, K
h
of the short shoots tends to be less than K
h
of long shoots. It
seems therefore that the conditions undergone by a branch
during its development can have hydraulic implications [22].
Similarly considerable differences between the whole plant
hydraulic conductance of two co-occurring neotropical rain
-
forest understory shrub species of the genus Piper have been
fund [39bis]. These results reflect the conditions where both
species are encountered: P. trigonum occurs in very wet
microsites, whereas, in contrast, P cordulatum is the most
abundant in seasonally dry microsites.
Results dealing with root hydraulic conductances are quite
rare. An interesting comparison between shoot and root hy
-
draulic conductances in seedling of some tropical tree species
shows that, at this stage, shoot and root conductances (and
leaf area) all increased exponentially with time [136]. Con
-
cerning the roots also, uncertainty appears to exist in the
scarce literature regarding the effects of mycorrhizal fungi
(ecto and endo-) on the host root hydraulic conductance. So
far most studies have been performed in very young seedlings
(two to ten months). A recent comparison [83bis] between 2-
year-old seedlings of Quercus ilex inoculated and non-inocu
-
lated with Tuber malanosporum Vitt. showed that root con-
ductance of the inoculated seedlings is 1.27 time greater than
those of the non-inoculated seedling. This result has been ob-
tained when the root conductance is scaled by leaf area; in
contrast this root hydraulic conductance is lower if reported
per unit root area. This example illustrates how important it is
to get a correct comprehension of the units used to express the
results before trying to explain them.
730 P. Cruiziat et al.
Figure 5. Examples of leaf specific conductivity maps. From left to right: paper birch, Betula papyfera, in microliters per hour, per gram fresh
weight of leaves supplied under conditions of gravity gradient, 10.3 kPa m
–1
(from [153]); balsam fir, Abies balsamea, same units except per
gram of dry weight (from [40]); eastern hemlock, 19-year-old trees, Tsuga canadensis, same units as for balsam fir (from [41]).
According to its definition, the leaf specific conductivity
(K
l
) depends firstly on the factors controlling the value of K
h
and secondly on the factors that make the leaf surface vari
-
able. Therefore it is not surprising that, in figure 5B, the vari
-
ability of K
l
is greater than that of K
h
. As mentioned above,
the principal value of K
l
is to allow dP/dx, (an estimate of the
water potential gradient ∆Ψ/∆x, or more precisely, the pres
-
sure gradient component of the water potential, see Appen
-
dix) along a branch bearing a given foliar area to be
calculated. Figure 4D summarizes ranges of values of K
l
.Hy
-
draulic parameters are now available for many tropical and
temperate species [12, 90, 138]. K
l
values ranged over more
than two orders of magnitude, from a low of 1.1 (in Clusia)to
171 (in Bauhinia)kgs
–1
m
–1
MPa
–1
. The conifers had low K
l
(values in the range of 1–2) because they have very narrow
conduits and diffuse porous trees had about double these val
-
ues. Not surprisingly, the highest values were in lianas, which
“need” wide vessels to promote efficient transport to com
-
pensate for narrow stems. Nevertheless, as pointed out by
Patiño et al. [90], it is still difficult to be definitive in general
-
izing interspecific patterns in terms of hydraulic parameters
with a data base of only some tens taxa.
Pipe model and hydraulic architecture. The “pipe model
theory of plant form” [102, 103] views the plant as an assem-
blage of “unit pipes”, each of which supports a unit of leaves.
It said that “the amount of leaves existing in and above a cer-
tain horizontal stratum in the plant community is directly pro-
portional to the amount of the stems and branches existing in
that horizon” [102]. According to the authors, this statement
applies at different scales from a simple branch, to an isolated
tree and a plant community. Many experimental results sup-
port this hypothesis and show that the cross-sectional sap-
wood area at height h and the foliage biomass above h, are
related through constant ratio. However results also indicate
that the ratio may be different for stem and branches and that
the transport roots obey a similar relationship [43, 72]. Sev
-
eral models of tree growth use the pipe model [71, 72, 84, 91,
141, 142].
In fact the pipe model of Shinozaki can be viewed as a new
formulation of one of the Pressler law which said, more than
one century ago, that “the area increment of any part of the
stem is proportional to the foliage capacity in the upper part
of the tree, and therefore, is nearly equal in all parts of the
stem, which are free from branches” [10]. From what as been
saying above, the pipe model assumption is also very close to
the Huber value. As pointed out by Deleuze [36], pipe model,
Huber value and allometric relations between leaf surface
and stem area are closely related. Nevertheless allometric re
-
lations are static and descriptive in nature, like the Huber
value, whereas the pipe model theory supposes a conserva
-
tive relation between structure and functioning.
The pipe model has been useful in predicting canopy leaf
mass or leaf area from stem cross section, and is of some
value in modeling tree growth, resource allocation and
biomechanics [127]. However this model is of little value in
understanding tree as hydraulic systems. First it is submitted
to the same criticism as the Huber value. As K
l
shows, the
stem cross section allocated per unit leaf area and the vessel
diameter in the stems vary widely within the crown of many
trees. Second, it does not consider the varying lengths of
transport pathways to different leaves on a tree. This is well
explained with the example given by Tyree and Ewers [127]:
“Imagine a unit pipe of mass, u, supporting leaf area, s. If the
transport distance, h, were doubled with the same leaf area
supplied, four unit pipes would be required to maintain the
same hydraulic conductance k. If the leaf area were doubled
as the transport distance doubled, eight unit pipes would be
necessary to equally supply the leaves with water”. Under
-
lying explanation is as follows: if neither the pipe units char
-
acteristics nor the difference of water potential between soil
and leaves change, doubling the distance will then divide the
gradient of water potential by two, from ∆P/∆xto∆P/2∆x. To
keep the same flux through the system, it is necessary to dou
-
ble the cross area of flux, i.e. to associate two pipe units, dou
-
bling then the resistance of the pathway:
Flux = K
h
∆P/∆x=K
h
∆P/2∆x+K
h
∆P/2∆x.
As pointed out by the same authors, trees minimize this
massive build up of unit pipes, as they age, in two ways. First
those that lack secondary growth (e.g. palms) initially are
oversupplied with xylem and should attain considerable
height before water transport limits. Those with secondary
growth, normally produce wider and longer vessels or tra-
cheids at their lower part as they age, which more or less com-
pensate for the increasing distance of transport. As stressed
by Jarvis [58] this is also a way trees use to keep the range of
water potential of their leaves approximately constant as they
grow in height.
Keeping in mind the previous remarks, attempts to build a
general and realistic model for the hydrodynamics of plant
seem far from being successful. For example, the one pub
-
lished by [147], although based on valuable concepts
(allometry laws, theory of resource distribution through a
branching network, etc.), contains also several oversimpli
-
fied assumptions (branching network is supposed to be vol
-
ume filling, leaf and petiole size are invariant, network of
identical tubes of equal length within a segment, constancy of
the leaf area distal to a branch, no water capacitance effects,
no variable hydraulic conductance, , and no indications
concerning the boundary conditions in soil and air, etc.),
which, in our opinion, ruin the benefit of the use of these con
-
cepts. As outlined by Comstock and Sperry [29]: “to model
the hydraulic behavior of plants accurately it is necessary to
know the conduit length distribution in the water flux path
-
way associated with species-specific xylem anatomy”. Be
-
sides, such models have a more problematic defect: they are
almost impossible to validate. We think that without a close
cooperation between theoreticians and experimenters such
general approaches will not have the impact they otherwise
could have.
Hydraulic architecture of trees 731
2.4. Examples of synthetic data on hydraulic
architecture: hydraulic maps
The first step in building the h.a. of a tree is to measure the
hydraulic quantities of different axes and to draw a map,
called hydraulic map [137], of their values for different axes.
Introduction of the “high pressure flow meter” [132] enabled
direct and rapid estimates of the hydraulic resistance of the
different elements of the tree structure. Nevertheless few
such maps have been published. Figure 5 gives three exam
-
ples of leaf specific conductivity maps [40, 41, 153]. Several
conclusions can be drawn from these data: (i) an important
variability of K
l
exists between different branches of the same
tree and differences within the same individual can be greater
than between species: for Betula from 911 to 87; for Abies
from 3 to 610; for Tsuga, from 10 to 297; (ii) K
l
varies along a
branch but irregularly. Reasons for that are unclear. It is ex
-
pected that K
l
diminishes with branch diameter but its de
-
pendence to the leaf area distribution along the branch can
obliterate this trend; (iii) K
l
decreases with the order of axe: it
is greater in the trunk than in the other branches, and lower at
the junctions. In Tsuga, the smallest diameter stems have K
l
s
30 to 300 times smaller than the largest boles. This means that
the pressure gradients, dP/dx, needed to maintain water flux
to transpiring leaves distal to the smallest stem segments, will
be 30–300 times steeper than the corresponding gradients at
the base of the boles [127], being larger in the main branch
than in a secondary branch. Zimmermann [154], spoke about
a “bottleneck”. This is a general result: hydraulic constric
-
tions at branch junctions are frequently found especially at
unequal junctions, i.e. where a small branch arises from a
large branch. The basal proximal segment (in the main
branch) is more conductive than the junction itself, usually by
a factor of 1.1–1.5 [130].
Another example of synthetic data on hydraulic architec
-
ture is the negative xylem pressure profile, i.e., the variations
of the pressure component of xylem water potential, with
height. One speaks also in terms of tension or pressure pro
-
files (see Appendix for the meaning of these different and
732 P. Cruiziat et al.
Figure 6. Examples of xylem negative
pressure profiles or (gradient) in trees.
A: Theoretical profile, showing that
most of the gradient of tension is in the
leaves; the dotted horizontal line stress
the fact that the same tension (here
0.075 MPa) can be fund at different ele
-
vations. GPG line is the tension profile
of a stable water column, or gravita
-
tional potential gradient. B: Example of
such gradient of tension in beech, Fagus
sylvatica (from Cochard, unpublished
results). C: Other examples of tension
gradients for three different species. E =
evaporative flux density kg
–1
s
–1
m
–2
(from [128]).
related expressions). These profiles give the value of the xy
-
lem sap negative pressure (sap tension) at a given height. Fig
-
ure 6A represents a theoretical example of such xylem
pressure profiles supposing that the xylem pressure in the
trunk, at the soil level, is zero. It can be seen that the higher
the order of an axis, the steeper is the xylem pressure gradi
-
ent. For the tree species studied so far, another general fact,
emphasized in the drawing, is that the main hydraulic resis
-
tance of the trunk-leaf pathway is within the leaf or at least in
the petiole-leaf unit [4, 131, 132]. Further research is needed
to determine whether or not this fact is a consequence of the
resistance of the extra-vascular sap pathway in the leaf. From
the functional point of view, if this characteristic hold for all
the leaves of a crown, it means that leaves located at the top of
the crown will not be disfavored by the longer pathway sap
follows to reach them.
Having in mind these theoretical trends of the negative xy
-
lem pressure profiles in trees, it is now profitable to look at
some measured profiles as presented in figure 6B and C. The
case of Fagus sylvatica, illustrates the general fact men
-
tioned above: whereas the water potential values for different
orders of branches are between –0.08 and –0.37 MPa, those
of leaves are between –0.60 and –0.9 MPa. In Thuja
occidentalis and Acer saccharum, the difference in xylem
pressure disappears for the trunk, but not for the branches. It
can also be seen that the negative pressure gradients in
Schefflera morototoni barely exceed that required to lift wa-
ter against the gravitational potential gradient (GPG) or hy-
drostatic slope to be more simple, (figure 6A). Schefflera
morototoni is an interesting extreme with K
l
s about ten times
greater than those of Acer saccharum stems of similar diame-
ter.
Leaf hydraulic resistances have now been measured for a
number of tree species but for very few herbaceous species
[76]. As said above, most of the resistance in the above
ground part of a tree is located within the leaf blade. For ex
-
ample the leaf resistance expressed as a percentage of the to
-
tal resistance between trunk and leaves is 80 to 90% for
Quercus [132] around 80% for Juglans regia [131] less than
50% for Acer saccharum [150]. Measurements of leaf resis
-
tance in young apical and old basal branches of a Fraxinus
tree have yielded contrasting results [22]. Most of the resis
-
tance was indeed located in the leaf blade in the apical shoots,
but for older shoots, the resistance was mainly in the axis.
This was attributed tothe higher node density in older shoots.
Two consequences can be drawn from distribution of
resistances in shoots. Firstly, many trees can be compared
from the h.a. point of view, to “brooms”: many minor shoots
with their leaves, forming a set of very high resistances in a
parallel arrangement, plugged into a trunk of low resistance.
Thuja is a good example of such a “broom” hydraulic archi
-
tecture: the gradient of xylem pressure is much smaller in the
trunk (roughly 0.02 MPa m
–1
) than in the branches, at least
ten times larger. Secondly the main factor of variation of the
xylem pressure is neither the height, as still often said, nor the
length of the pathway from the roots to the leaf. This can be
seen in the figure 6A (horizontal dotted line): the same value
of xylem pressure is found at several different elevations.
What determines the gradient of xylem pressure, dP/dx is the
hydraulic resistance (inverse of K
h
) of the water pathway be
-
tween the trunk and the leaves. Figure 7, from [124], clearly
shows this main feature from a model of the h.a. of Thuja:
there is no good correlation between the water potential of
minor shoots (< 0.8 mm diameter) and the total path length
from soil to shoots (above left diagram) or the vertical height
of the shoot (above, right diagram). In contrast, the lower dia
-
grams show close correlation between this water potential
and the sum of the leaf specific resistance defined as ΣR
i
A
ti
where R is the segment resistance and A
t
is the total leaf area
fed by the segment and the summation is over all segments
along the pathway. If all leaves have the same transpiration T
and steady state conditions apply, then the drop in Ψ along
the hydraulic path should equal T ΣR
i
A
ti
. The lower left
diagram shows the correlation for all segments < 0.5 cm di
-
ameter. The improved correlation (lower right diagram) dem
-
onstrates that most of the hydraulic resistance is encountered
in the minor branches. The curvature in the correlation is a
consequence of capacitance effects.
An interesting modeling approach has been developed
[39] which combines locally measured root hydraulic con-
ductances (from literature), with data on the root architecture
(topological and geometrical aspects). For a given distribu-
tion of soil water potentials and either a given flux or water
potential at the collar, water fluxes along the roots, as well as
Hydraulic architecture of trees 733
Figure 7. Plots of water potential of minor shoots (< 0.8 mm in diam
-
eter) of Tsuga canadensis versus the total path length from soil to
shoot (upper left), versus height (upper right), versus sum of the leaf
resistance (lower left) of all branches having a diameter < 0.5 cm, and
versus the sum of leaf specific resistance of all the branches (lower
right). Σ LSR are kg
–1
m
2
s MPa. (from [123]).
the xylem water potentials, can be calculated everywhere in
the root system. As expected, water potential distribution
along the root system is very dependent of the type of branch
-
ing (adventitious or taproot for example) and the distribution
of the elementary root conductances.
3. VULNERABILITY AND SEASONAL EMBOLISM
As stated by the cohesion-tension theory [118, 135] water
ascends plants in a metastable state of tension, i.e., at nega
-
tive pressures. The most crucial consequence of this state of
tension in the xylem sap is the occurrence of cavitation [19,
81, 106, 139]. Cavitation is the abrupt change from liquid
water under tension to water vapor. As water is withdrawn
from the cavitated conduit, vapor expands to fill the entire
lumen. Within hours or less, air diffuses in and the pressure
rises to atmospheric [66, 125]. The conduit then becomes
“embolized” (air-blocked). The replacement of water vapor
by air is the key point that makes embolism serious since air
cannot be dissolved spontaneously in water as can water va
-
por.
It is now clear that drought can induce cavitation and xy-
lem embolism. This is not the only cause (see Section 3.5) but
during summer, this is, by far, the main factor. Therefore, re-
sistance to cavitation isperhaps the most important parameter
determining the drought resistance of a tree. A vulnerability
curve (VC) is a measure of that “resistance” in particular
stem, branch or petiole. It is a relation between the tension of
the sap in the xylem conduits and the corresponding degree of
embolism as estimated by acoustic detection [79, 96, 100,
126] or, much morefrequently, by a hydraulic method [107].
3.1. The vulnerability curves (VC)
Figure 8A gives an example of one recent method to deter
-
mine a vulnerability curve in field (Xyl’em Instrutec Li
-
censed INRA). The principle is simple. A segment of branch
collected from the tree under study is first rehydrated to reach
complete hydration (full turgidity). Then it is submitted, by
means of a collar pressure chamber, to successive increasing
steps of air (or nitrogen) pressures. These pressures are posi
-
tive pressures, above the value of xylem pressure correspond
-
ing to full turgidity, which is zero by definition (see
Appendix). As a result, mesophyll cells begin to squeeze,
thus pushing water from these cells to the xylem vessels and
to the protruding end of the branch, where it is collected. The
plant sample is now slightly dehydrated. Repeating such
small increase of pressure with time will lead to a regular de
-
hydration of the sample and to more and more negative val
-
ues of its water potential (an intuitive image of this process is
the progressive squeezing of a sponge full of water). At each
chosen step, the level of embolism is estimated by the mea
-
sured conductivity K
h
expressed as a percentage of the
maximum K
h
obtained after removal of embolism [17, 107].
In other words a VC, specific to a given axis, is a relation be
-
tween water potential and the corresponding loss of hydraulic
conductivity (figure 8B). It therefore requires a technique
similar to that necessary for the measurement of the hydraulic
conductivity.
3.2. Examples of vulnerability curves
Figure 9A and B presents some examples of VCs obtained
for different trees belonging to Angiosperms and Gymno
-
sperms [127]. As can be seen there are very large differences
of vulnerability between species. Among the least vulnerable
taxa are Juniperus virginiana, a widely distributed conifer
capable of growing on both mesic and xeric sites and
Rhizophora mangle, a mangrove growing in saline coastal
marshes but whose roots exclude salts from the xylem sap.
For these species the water potential for just 20% loss of con
-
ductivity occurs at –5 to –6 MPa which are very low values.
Presently the less vulnerable species have been found in very
dry areas. Ceanothus megacarpus, growing in the California
chaparral, can resists negative pressures lower than –10 MPa.
734 P. Cruiziat et al.
Figure 8. A: Diagram of the apparatus (injection method, one of the
possible methods) used to build a vulnerability curve. B: Example of a
vulnerability curve, for a branch of walnut tree, Juglans regia (from
Ameglio, unpublished result).
According to Pockman and Sperry [95], Juniperus
monosperma did not begin to cavitate until pressures below
–10 MPa and Larrea tridentata was completely embolized at
a pressure of –14 MPa or even less. For Ambrosia dumosa
growing at Organ Pipe Cactus National Monument (Ari
-
zona), this treshold is around –12 MPa [78]. At the other ex
-
treme of vulnerability are Populus deltoïdes Bartr. ex Marsh
and Schefflera morototoni which lose 50% of their hydraulic
conductivity at –1.5 MPa. Populus deltoïdes is a temperate
mesic species which grows preferentially where water tables
are high, and Schefflera morototoni is an evergreen species
which grows in rain forests and is an early colonizer of gaps
[137].
Some vulnerability curves for roots have been published
[5, 67, 111], which show that the root xylem in woody plants
is generally more vulnerable to cavitation than shoots of the
same individuals (see references in [95]). Because of their
great susceptibility to cavitation, small roots have been called
the “Achilles’ heel” for water transport within the plant [51].
In this way, embolism may be confined to replaceable roots
rather than the stem [95].
An implicit consequence of these VCs is that no strong
correlation exists between the diameter of the xylem ele
-
ments and their vulnerability to summer embolism, as was
assumed around the eighties. This has been clearly shown
by numerous experimental results, summarized in figure 9E
Hydraulic architecture of trees 735
Figure 9. Examples of vulnerability
curves. A: Intergeneric examples. An
-
giosperms. R: Rhizophora mangle;A:
Acer saccharum;C:Cassipourea
elliptica;Q:Quercus rubra;P:Populus
deltoides;S:Schefflera morototoni
(from [127]). B: Intergeneric examples.
Gymnosperms. J: Juniperus virginiana;
Th: Thuja occidentalis; Ts: Tsuga
canadensis;A:Abies balsamea;P:
Picea rubens (from [127]). C:
Intrageneric example. Quercus (from
[134]). D: Vulnerability curve of differ-
ent axes of the same walnut tree,
Juglans regia, showing a rare example
of vulnerability segmentation (from
[131]). E: Log-log plot of xylem tension
causing 50% loss hydraulic conductiv
-
ity (Ψ50PLC) and mean diameter of the
vessels that account for 95% of the hy
-
draulic conductance (D
95
). Each symbol
is a different species. The solid line is
the linear regression of the log-trans
-
formed data. The dotted lines are the
99% confidence interval for the regres
-
sion (from [133]).
[133]: the log-log plot of xylem tension causing 50% loss of
hydraulic conductivity (Y axis) and mean diameter the ves
-
sels that account for 95% of the hydraulic conductance (X
axis) as a weak correlation (regression accounts for only 21%
of the variation). This statistically significant relation is in
-
sufficient to be of predictive value of vulnerability. Figure
9C illustrates the VCs of different species among the genus
Quercus. The differences of vulnerability are about as large
as between the diverse species of Angiosperms represented
figure 9A. There is a striking correlation between vulnerabil
-
ity curves and general perception of drought tolerance from
the silvicultural literature: the arid-zone species (Q. ilex and
Q. suber) are less vulnerable than mesic-zones species
(Q. robur and Q. petraea). It is worth noting that even
100 percent loss of conductivity of branches may be
nonlethal for Quercus species. While most branches died at a
soil water potential of –5 MPa, resprouting can occur from
roots and some axial buds [134]. Eventually, figure 9D gives
the only known example, so far, of what is called “vulnerabil
-
ity segmentation”. The idea comes from Zimmermann [154]
who spoke of “hydraulic segmentation” as we have seen be
-
fore. Zimmermann argued that hydraulic segmentation is vi
-
tal in arborescent monocotyledons, such as palm trees. A
palm tree, once formed, can never add new vascular tissue, as
dicotyledonous and coniferous trees do. In palms there ap-
pears to be substantial hydraulic constriction at the level of
the leaf junction [104]. Zimmermann said that this is an es-
sential feature of palm hydraulic architecture to confine em-
bolism to leaves during drought. Leaves are renewable parts,
but if the stem is embolized, then the tree may never recover.
Tyree and Ewers [127] extended Zimmermann’s hypothesis
to include “vulnerability segmentation”. This exists when the
vulnerability of leaves, petioles or minor branches is greater
than that of larger branches and the bole. Figure 9D shows
such a case for walnut: the VC of stems and petioles gave an
order of vulnerabilities of the components of the tree: petioles
> current-year shoots > one year-old shoots [131]. When peti
-
oles reached 90% loss of hydraulic conductivity, the leaf wa
-
ter potential Ψ was approximately –1.9 MPa; at the same Ψ,
the stems had lost only about 15% of their maximum hydrau
-
lic conductivity. This is in contrast to several Quercus,
Fraxinus or Populus species where there is no difference in
the VC of stems and petioles [18, 20, 22]. This study on wal
-
nut is the first case showing that drought-induced leaf shed
-
ding is preceded by cavitation in petioles before cavitation in
stems, due to vulnerability segmentation. However, it is not
definitively known that cavitation causes leaf abscission or
what the underlying processes are. In the same way more
work has to be done to confirm whether or not a causal link
exists between the vulnerability to cavitation and branch die-
back [98]. The great susceptibility of the small roots to embo
-
lism can also be considered as another expression of the vul
-
nerability segmentation.
There is now ample evidence from the literature that VCs
vary considerably between species or between organs in a
same species. More recent studies have furthermore sug
-
gested that VCs can also vary for a same organ according to
environmental growth conditions. For instance, shade-grown
branches of Fagus sylvatica are more vulnerable than sun-ex
-
posed branches [24]. Vulnerability to cavitation is probably
an important parameter to consider in order to understand tree
phenotypic plasticity.
3.3. Summer embolism
During summer, trees undergo drought if the soil dries.
Such conditions lead to a decrease of the soil water potential
and to a large increase of the hydraulic resistance at the soil-
root interface (see Section 4.2). The water potential of leaves
will decrease and the xylem sap negative pressure will also
decrease. Therefore cavitation and its consequence, embo
-
lism will develop and the hydraulic conductivity of the distal
parts of tree will decrease. Figure 10A shows, for 30-year-old
trees of four oak species [18], the seasonal change in percent
-
age loss of hydraulic conductivity due to embolism in peti
-
oles (above) and twigs (below). The open symbols relate to
control (irrigated) trees and closed symbols to water stressed
trees. It can be seen that there is always, throughout the year,
some degree of embolism, even in the well-watered trees.
This residual embolism probably comes from vessels with
not very well-formed walls or which have been wounded dur-
ing bad weather or disease.
Another conclusion from these data is that embolism de-
velops during the drought period; but several months of
drought are necessary to induce a significant degree of embo-
lism. In fact, efficient mechanisms of defense develop (see
below). These results also clearly showed that there is no re
-
covery of embolism after drought has ended. Yang and Tyree
[149] presented a model of hydraulic conductivity recovery
well confirmed by experimental data. Embolism may dis
-
solved in plant if Ψ
x
becomes positive or close to positive for
adequate time periods. Embolisms disappear by dissolution
of air into the sap surrounding the air bubbles. For air to dis
-
solve from a bubble into liquid sap, the gas in the bubble has
to be at a pressure in excess of atmospheric pressure [137]. P
g
being the pressure of gas in the bubble and P
l
the pressure in
the liquid surrounding the bubble (P
l
= Ψ
x
) if the difference
P
g
–P
l
is less than the capillary pressure (originating from the
surface tension τ), then the gas will dissolve. If this quantity
is greater no dissolution will appear. For instance, let us con
-
sider an air bubble trapped in a of 60 µm vessel diameter. The
capillary pressure causes by the surface tension is then equals
to ca. +5 kPa (see Jurin’s equation on this page). Therefore,
the xylem pressure must be higher (less negative) than –5 kPa
for the bubble to dissolve. Practically, this signifies that, in a
non transpiring and well-watered tree, passive embolism can
only occur in the root system and up to 50 cm in the trunk. To
dissolve embolism higher in the tree, an active mechanism is
required, i.e. a positive root pressure.
736 P. Cruiziat et al.
However, one must be careful in generalizing, at least for
the results and explanations dealing with recovery of embo
-
lism. For a long time it was clear that no recovery of embo
-
lism can occur during drought. Some theoretical explanations
[93] and, especially, recent results [55, 155] suggest that re
-
filling may be more common than previously thought, and
that it might occur under negative pressure. More work is
needed to get a clear view on this question.
Last but not least, as soon as negative air temperatures
occur at the beginning of November, embolism reaches a
maximum (hundred percent of loss of hydraulic conductiv
-
ity). This important result, which has been confirmed by
laboratory experiments [15] indicates that another type of
embolism, induced by negative air temperatures, can occur
in trees. It also shows that the vascular tissue of Quercus is
extremely affected by this freezing-induced embolism (see
Section 3.5).
3.4. How to explain the drought-induced embolism?
The air-seeding explanation
While there are many potential causes of xylem cavitation
[92, 133], the experimental evidence strongly favors the “air-
seeding” explanation [31, 106, 113, 154]. This states that cav
-
itation occurs when air outside a water-filled conduit is aspi
-
rated into this xylem element through pores of the pits in the
walls (figure 11A). These pores will retain an air-sap menis
-
cus until the difference of pressure between outside and in
-
side (i.e., xylem pressure, P
x
) across the meniscus, exceeds
the capillary forces holding it in place. Outside means either
atmosphere, P
a
, or an adjacent air-filled conduit, where the
pressure is near atmospheric pressure. As Jurin’s law (or
the capillary equation) states these forces are a function of the
pore diameter d, the surface tension of water, τ, and the con
-
tact angle between water and the pore wall material (α). The
critical pressure difference ∆P
crit
required to force air through
a circular wetted pore can be predicted by this law:
Hydraulic architecture of trees 737
Figure 10. A: Seasonal evolution of xy
-
lem embolism in petioles (upper) and
one-year old twigs (lower) for both con
-
trol (open symbols) and water stressed
(solide symbols) trees expresseed in %
from completely hydrated twig or peti
-
ole specimens. ᭢ Quercus robur; ᭡
Quercus rubra; ᭹ Quercus petraea; ᭜
Quercus pubescens (from [18]). B: Vul-
nerability curves for frozen (solid sym-
bols) and control (open symbols) stems
versus xylem pressure for a coniferous
(left) and a diffuse-porous deciduous
tree (see Section 3.5). Results indicate
increasing vulnerability to cavitation by
freezing with increasing conduit diame-
ter: freezing causes no additional loss of
conductivity relative to water stress
controls in Abies contrary to what hap
-
pens in Betula (from [35]).
738 P. Cruiziat et al.
Figure 11. Cavitation in tracheids and vessels. A Left: part of a vessel of oak, large-porous wood (diameter ca. 200–400 µm, lenght until some
meters) showing vessel elements and pits grouped in small dispersed areas. Right: illustration of the air-seeding explanation. Two adjacent xy
-
lem vessels are shown, one being embolized (air filled) the second functional (with sap). Far Right: enlarged view of the intervessel pit structure.
The air-seeding explanation states that xylem cavitation in a “dehydrated stem” is initiated by air pulled trough the pit membrane pores. This oc
-
curs when the air pressure (P
a
usually near zero) minus the xylem pressure (P
x
, usually negative) across the air-water meniscus at the pore creates
a pressure difference (᭝P
crit
) sufficient to displace the meniscus. In the example shown, the ᭝P
crit
of 5 MPa is reached when P
x
= –5 MPa. A
corollary of this explanation is that by injection of air in a “hydrated stem”, where xylem pressure is atmospheric (0 MPa), ᭝P
crit
can be achieved
by raising the air pressure (to + 5 MPa in this example) (from [113]). B Left: spindle-shaped tracheids (diameter of some µm or tens of µm,
lenght of some mm) showing small bordered pits. Centre: enlarged views of a bordered pit of a coniferous tracheid; left of centre: pit in section,
arrows indicating the path of water from one tracheid to the next; centre: surface view of the same pit; right of centre: section showing the valve-
like action of the torus. T = torus; M = pit membrane; B = pit border. Far Right: tangential section of coniferous wood. The tracheid in the center
(marked x) is embolised. Water flows around it. The negative pressure in the xylem has pulled the pit membranes away from the embolised dead
cell to seal it off (from [133]).
∆P
crit
=(4τ cosα)/d
with ∆PinPa,τ in N m
–1
, d in m; for water in glass capillar
-
ies as well as in the xylem elements of plants cosα =1;
∆P
crit
=P
a
–P
x
.
From this equation it is clear that the bigger the pore, the
smaller ∆P
crit
becomes. Taking P
a
as a constant, the largest
pore between two adjacent conduits will then determine the
less negative xylem pressure, P
x
which provokes cavitation.
An approximation of Jurin’s law rewritten in a simplified
manner and thus madedirectly useful for biologists is [154]:
Pore diameter (in µm) × pressure difference (in atm or
bars) ≈ 3.
For example, if the biggest pore is 0.2 or 0.1 mm in diame
-
ter, then the minimum stable P
x
will be, approximately, –15
or –30 atm, respectively.
Figure 11A illustrates this for a typical inter-vessel pit
membrane. The diagram shows two adjacent vessels, one
filled with air, the other with sap. As water stress increases, P
x
becomes more negative and ∆P increases and eventually
reaches the critical value where air is pulled into the conduct
-
ing element through the pit membrane pore and “seeds” cavi-
tation. As supposed by the air-seeding explanation, only the
magnitude of ∆P is the triggering factor. Therefore the same
result can be achieved either by water stress, as in natural
conditions, or by injecting air within a hydrated stem, as in
experimental conditions [17].
The air-seeding explanation has been supported by many
different experiments [113] and can now be considered as the
correct explanation of drought-induced embolism. Its most
important consequence is the fact that the vulnerability to em-
bolism is directly determined by the diameter of the pit pores
and not by the diameter of the conduits. This could be a useful
indication for estimating a priori the degree of safety of a con
-
ducting system in regard to vulnerability. However, difficul
-
ties still remain as to which is the correct pore diameter to
take into account. Most of the time, pit pore diameters are
measured using electron microscopy techniques, under re
-
laxed conditions. However under natural conditions, as the
pit membrane is subjected to large pressure differences prior
to air seeding, it is strongly suspected to be stretched (Sperry,
personal communication). Therefore, the exact diameter of
the pores can be very different in the relaxed state vs the
stretched state, depending on the mechanical properties of the
pit membrane.
In conifers where a torus is present in the pit of tracheids
(figure 11B, T), the situation is different. When a tracheid
embolizes, the pit membrane is deflected against the pit
chamber wall and the torus covers the pit aperture (figure
11B, right). However, this sealing action of the torus is not
perfect and air is apparently still able to pass through this to
-
rus-blocked pit wall. The problem is to find which way air
uses. In the species studied by Sperry and Tyree [109], Abies
Balsamea (L.) Mill., Picea rubens Sarg. and Juniperus
virginiana (L.), when air enters, it probably does not happen
through the torus which appears to be without pores and
forms a tight seal over the aperture. Air should then pass
through the deflected pit membrane. Besides, the porosity of
the pit membrane that supports the torus (the margo, M) is too
large to prevent air entering at P greater than 0.1 MPa in most
cases. It therefore could not account for the observed embo
-
lism-inducing pressures, which are much less negative. The
conclusion of the authors is that the air-seeding pressure is
not directly a function of pore size but of membrane flexibil
-
ity, because the seeding may occur when the torus is dis
-
placed from its normal sealing position over the pit aperture.
In other words, it can be supposed that the displacement of
the pit membrane reduces the size of its pores.
3.5. Winter embolism
During winter, freeze-thaw events can induce embolism
and reduce the hydraulic conductivity of temperate woody
plants [15, 110]. The seasonal development of embolism in
the xylem conduits of Quercus petraea showed a sharp and
total loss of conductivity following the first fall frost (figure
10A). Similar observations have been made on Fraxinus ex-
celsior [22], another ring porous species. Temperate ring po-
rous species thus seem highly vulnerable to frost-induced
embolism. The situation is different for diffuse porous and
conifer species. For diffuse porous trees, such as Acer [108]
or Fagus [50], the increase in embolism is more gradual and
reaches high degrees only after repeated periods of frost. Co-
nifers exhibit another extreme situation because they do not
seem to suffer at all from winter embolism. It has been argued
that freezing-induced embolism can limit the growth, sur-
vival, and geographic distribution of plant species [64, 94,
110, 134]. These studies suggest a link between xylem anat
-
omy and the vulnerability to frost: the larger the conduit, the
higher the vulnerability [42]. This link has clearly been estab
-
lished in a systematic study of the degree of late winter
embolism in the xylem of many hard and softwood species
[133, 146]. A positive relationship was found between the
specific hydraulic conductivity (which is primarily a function
of conduit size) and the degree of embolism (figure 12). This
is in opposition with what has been shown in figure 9E.
Davis et al. [35], carried out a technique which enabled
them to consolidate more precisely this result. They showed
that plants with mean conduit diameter above 30/40 µm are
extremely sensitive to cavitation by freezing, even for a mod
-
est xylem pressure (say –0.5 MPa). Therefore, besides their
specific vulnerability to summer embolism, species having
large conduits will have an additional sensitivity to winter
cavitation: under the same water stress conditions (as deter
-
mined by xylem water potential) they will have more chance
to be embolised during period of below zero temperature than
during period of mild temperatures. This is well illustrated
(figure 10B): Betula occidentalis having mean diameter con
-
duits much larger than Abies lasiocarpa is therefore much
more susceptible to freezing-induced cavitation.
Hydraulic architecture of trees 739
3.6. The “frost-thaw” explanation
Why should larger conduits be more prone to winter em-
bolism? Our current explanation is based on a frost-thaw
mechanism. When sap temperature drops a few degrees be-
low 0
o
C, ice forms which creates air bubbles (air is almost
not soluble in ice). It is assumed that during the thawing,
when xylem tensions exceed a critical value, air bubbles are
progressively released to the liquid phase and air-water
menisci are created (figure 13).
As it can be deduced from the above discussion (fig
-
ure 13), for a bubble of air to be stable, neither increasing or
decreasing in size, the pressure difference, P
g
–P
l
, between
the gas and the liquid phases must be equal to 4τ/d (see capil
-
lary equation above). Or we can say if P
l
<(P
g
–4τ/d) the bub
-
ble will expand to fill the whole conduit. The larger the initial
size of the bubble, i.e., the larger the diameter of the conduit,
then the closer can be P
l
to P
g
, i.e. the smaller the tension in
the liquid to produce indefinite expansion and therefore gas
filling of the conduit. Larger conduits are more vulnerable
probably because bubbles are initially larger. The initial size
of the bubbles can explain differences between species but
cannot explain alone all the observations. In Fagus sylvatica
for instance it has been recently observed [65] that young ter
-
minal shoots were more vulnerable than larger xylem seg
-
ments which contradicts the conduit size-vulnerability
relationship. Under controlled conditions, it was established
that the terminal shoots were freezing and thawing before the
remainder of the branch. This suggests that on freezing, water
was expulsed from the apex (due to ice expansion). On thaw-
ing, this water deficit will induce high hydrostatic tensions.
In beech, the development of hydrostatic tensions might de-
termine the formation of embolism more than the sizes of air
bubbles alone.
Recently Cochard et al. [26] have argued that vessel em
-
bolism occurs during the freezing phase in cryo-scanning
electron microscopy observations. However the volume of
air present in the vessels appears to be much greater than can
be accounted for by the volume of air dissolved in the sap.
This result suggests that we are far from having a clear under
-
standing of the underlying physics governing the processes
that occurs during frost-thaw cycles.
If trees experience high loss of hydraulic conductivity dur
-
ing winter, how can they cope with this situation when sap
flow is reactivated in spring? Several authors [3, 50, 105,
108, 112] have suggestedthat positive pressures in the xylem,
during spring in particular, can have important implication
for dissolution of freezing-induced embolism in temperate
woody plants. Zhu et al. [151] found that in Betula
alleghaniensis Britt., freezing damage to roots resulted in
lower spring root pressures, less recovery from winter embo
-
lism, and higher shoot dieback.
Although most authors have considered positive pressures
in the xylem to be important for dissolving embolism [3, 50,
55, 105, 129, 139], mechanisms of winter pressure formation
740 P. Cruiziat et al.
Figure 12. Interspecific vulnerability to frost-induced embolism. The
degree of xylem embolism was measured at the end of the winter for a
large number of conifers (open squares) diffuse-porous (open circles)
and ring-porous species (closed circles). This degree of embolism is
expressed as a function of the xylem specific hydraulic conductivity
which primarily correlates with conduit sizes: the larger the conduits,
the higher the conductivity, the higher the embolism at late winter
time. See also figure 10 (from [146]).
Figure 13. Mechanism of frost-induced embolism. The breakdown of
water columns in xylem conduits following a frost-thaw event is
probably due to the expansion of air bubbles formed during sap freez
-
ing. Tensions developed in the xylem at thawing are large enough to
prevent the collapse of the largest bubbles caused by their surface ten
-
sion. When temperatures decrease below 0
o
C, the liquide column of
sap freezes and ice forms (2). Gas being much less soluble in ice than
in the liquid sap, bubbles of different sizes appear (2). When tempera
-
tures increase above 0
o
C, ice sap thaws (3). Depending on their initial
size and on the xylem tension at thawing, bubbles will either colapse
(the smaller ones) or, in the contrary expand (the larger ones) (4). Pg =
gas pressure of the bubbles; Pl = xylem sap pressure; t = surface ten-
sion of the sap; d = conduit diameter; T = temperature.
remain poorly understood. The most studied plants in this re
-
gard are species of Acer, for which there are several hundred
papers dealing with the flow of maple sap [60, 74, 80, 88,
122]. It is clear that in Acer, winter xylem pressures are
derived from the stem and not the root. The sap exudation
from the stumps of felled trees at that time of year is negligi
-
ble whereas copious exudation occurs from excised shoots
[73, 119]. Proposed mechanisms in Acer can be categorized
into either “physical models” or “vitalistic models”. Ac
-
cording to physical models, the winter pressures are due
strictly to freeze-thaw events [87, 122]. In contrast, according
to vitalistic models, activities of living cells in the xylem are
required for pressure buildup [59, 73, 74, 148]. It is known
that at low, non-freezing temperatures, starch in stem paren
-
chyma cells is broken down into sugars, especially sucrose
[75]. Although sucrose appears to play a role in the pressure
build-up in Acer stems, the buildup of sucrose is apoplastic
and the osmotic role of sucrose in the formation of stem pres
-
sures has been questioned [30, 60]. It has also been suggested
that the living parenchyma cells are crucial for gas produc
-
tion, leading to temperature dependent changes in gas pres
-
sure in the air spaces within the wood fibres [101].
As in Acer, walnut trees (Juglans regia L.) have been ob-
served to display positive pressures in the xylem sap during
the winter, autumn and spring. Autumn and spring xylem
pressures appeared to be of root origin and were positively
correlated with soil temperature [44]. Winter stem pressure
was associated with low temperatures and with high sugar
concentrations in the xylem sap [2, 7]. A simple osmotic
model could account for the modest positive winter pressures
at low, non-freezing temperatures, but not for the synergistic
effects of freeze/thaw cycles.
Many other species lack such high pressurization periods
(Quercus, Fraxinus, Castanea, Conifers, etc.). Therefore,
conduits embolised during winter time remain permanently
non-functional and may eventually become plugged by
tyloses [15]. New functional vessels are then produced before
leaf expansion and will insure most of the sap supply to the
leaves during the growing season [49]. Species not suffering
from winter damages or capable of reactivating their xylem
conduits can, on contrary, rely on their sapwood to supply the
new leaves with water. For theses species the new ring
growth is delayed and occurs only after full leaf expansion.
Tree phenology in spring may thus correlate with their xylem
history. However, has mentioned above, recent results show
that active (?) refilling can also take place in the presence of
high xylem tension; however the mechanism underlying this
process has not yet been identified [55, 139, 156].
A detailed example of study concerning the mechanisms
of xylem recovery from winter embolism can be found [27].
In mature beech trees, hydraulic conductivity in the terminal
branches decreased progressively during winter. Two periods
of recovery have been identified. The first occurred early in
the spring before bud break and during the period of positive
xylem pressure measured at the base of the tree trunk. Active
refilling of the embolized vessels caused the recovery. The
second recovery of hydraulic conductivity occurred after bud
break when the cambial activity resumes, producing new
functional conduits. Therefore two mechanisms whose ef
-
fects can vary according to climatic conditions and species,
can explain shoot hydraulic recovery of broadleaf trees in the
spring. Figure 14 presents a schematic representation of the
progression and recovery of embolism for a current beech
year shoot (formed in year n). In (1) a cross section of the cur
-
rent-year shoot is shown in late summer of year n, when
cambial activity has ceased and when all xylem vessels are
still filled with water: no embolism, hydraulic conductivity
equal to its maximum value, e.g. when the shoot is fully hy
-
drated, K
w
=K
wn
, and PCL (% loss of conductivity) is equal to
zero. For the year n, this maximum value is then K
wn
. Follow
-
ing freeze-thaw events, some vessels become filled with air
and PCL increases up to a more or less important value, α in
late winter (2). Then two possibilities can take place. The first
is that vessels do not refill before the onset of ring develop
-
ment. The reduction of PCL value α, will only be possible by
the formation of new vessels and will be a function of the in
-
crease of the xylem surface A
n+1
and K
(wn+1)
(K
w
of the new
ring). In this case K
w
increases in comparison with its previ-
ous value, because the growth produces more new functional
xylem than the remaining embolized vessels (5). The second
possibility is when positive pressures can take place during
early spring and refill some embolized vessels. The residual
PLC, β, will therefore becomes less than α (3). Later on, the
cambial reactivation will further decreases of PCL to a value
< β (4). Therefore the paths (ܩ → ܪ → ܫ and ܩ → ܬ) can
be differentiated by comparing concurrent changes in PLC
and K
w
. The first with its refilling step (walnut, maple) should
lead to a residualembolism lower than the second (oak, ash).
4. THE COUPLING BETWEEN HYDRAULIC
AND STOMATAL CONDUCTANCES
Although the behavior of stomata in the presence of vari
-
ous stress (water, light, CO
2
) is well established, the underly
-
ing mechanisms remain largely unknown. In the presence of
soil water deficits for instance, stomata gradually close which
reduces leaf water loss. The production of specific hormones
(ABA) by roots has been proposed as a coupling factor be
-
tween the stomatal aperture and the soil water deficit [120].
In this part we will describe an alternative coupling between
stomatal behavior and hydraulic properties.
4.1. Theoretical and experimental relationships
between transpiration and leaf water potential
during a progressive soil drought
According to the Ohm’s law analogy, there is a simple re
-
lationship, for steady state conditions, between leaf transpira
-
tion and the average leaf water potential:
Hydraulic architecture of trees 741
Ψ
leaf
= Ψ
soil
–F× R
plant
where Ψ
leaf
and Ψ
soil
are the leaf and soil water potentials
(MPa), F the whole plant transpiration rate (mmol s
–1
) and
R
plant
(mmol s
–1
MPa
–1
) a coefficient that we call the “whole
plant hydraulic resistance” by analogy to an electrical circuit.
R
plant
includes all the hydraulic resistances along the sap path
-
way from the soil to the leaves. Experimental relationships
between F and Ψ
leaf
have been established for many species.
The relationships are usually linear, but may also be
curvilinear. The latter situation might be caused by non-
steady state conditions or variable R
plant
resistances. [69] fol
-
lowed the Ψ
leaf
vs. F (sap flux density) relationships in a natu
-
ral stand of Picea abies during a progressive soil drought
(figure 15A). In control the relationships are close to linear,
suggesting that R
plant
was independent of the transpiration
rate. However, R
plant
varied considerably during the develop
-
ment of drought as indicated by the increase of slope. This re
-
sult is important because it demonstrates that considerable
changes in the plant hydraulic system can occur during a wa
-
ter shortage. The leaf water potential is therefore a poor esti
-
mate of the plant capacity to extract water from the soil.
When derived from the F vs. Ψ
leaf
relationships, R
plant
inte
-
grates soil, vascular and non vascular plant resistances. The
question is then to know which resistance increases the most
during a drought period?
4.2. The increase in soil-root resistance
Further observations during the previous study suggested
that the increase in R
plant
is most likely located at the soil-root
interface or in the bulk soil itself. For instance, Lu [68] fol
-
lowed the changes in branch resistance R
branch
. Contrary to
R
plant
,R
branch
was nearly constant all through the drought pe
-
riod (figure 15C). The increase in R
plant
could not be ascribed
to cavitation events in the branch systems. Furthermore, the
decrease in R
plant
was reversed after soil rehydration. Because
loss of conductivity due to cavitation is irreversible in coni
-
fers, it was therefore unlikely that the change in R
plant
was lo
-
cated in the xylem system. In Picea, most of the drought-
induced variation in R
plant
was therefore due to a reversible
extra-vascular phenomenon. However, if the impact of xylem
cavitation was only minimal in this study, this was probably
the result of an active stomatal regulation. This is illustrated
742 P. Cruiziat et al.
Figure 14. Schematic representation of progression and
recovery of embolism for a current-year shoot (formed
in year n) of beech. Two main phenomena contribute to
this recovery: refilling of already build vessels and pro-
duction of new vessels. More explanations in the text
(from [27]).
in figure 15B, where the midday leaf stomatal conductance
(g
s
) is expressed as a function of the whole plant hydraulic
conductance (g
L
= 1/R
plant
). A decrease in g
s
during the drought
development was coupled with a decrease in g
L
. The result of
this stomatal regulation is visible in figure 15: the maximum
transpiration rate was reduced with increasing soil drought,
and, consequently, the drop in Ψ
leaf
was minimized. Various
physiological reasons could explain why the plant tended to
minimize the drop of Ψ
leaf
during a water shortage (to prevent
loss of cell turgor for instance). Another possible reason
might involve a protection against xylem cavitation.
4.3. The consequence of xylem vulnerability
When the xylem water potential (Ψ
xylem
) drops below a
threshold value (Ψ
cav
) then cavitation occurs. It has been
Hydraulic architecture of trees 743
Figure 15. A: Tree transpiration (x axis) versus leaf water potential (y axis) in Picea abies for well-watered plant (control) and increasing soil
drought (dry, numbers refer to days of the year). The relationships were rather linear, but were clearly modified by water stress: the whole plant
hydraulic resistance, which is represented by the slope of the relationships, was increased during drought (from [69]). B: Changes in whole plant
hydraulic resistance during drought. Total hydraulic resistances derived from the slopes in A, are expressed as a function of predawn (soil) leaf
water potentials. Total resistance is calculated from the following expression ∆Ψ(soil–leaf) = F/R
total
where F is the transpiration per sap wood
surface; R
total
was divided into two components: soil to branch and branch to leaf. The increase in total R with drought was located in the soil-
branch pathway and very likely in the soil-root compartment (from [69]). C: Coupling between total hydraulic conductance g
L
and stomatal con
-
ductance g
s
. Midday stomatal conductances were linearly related to whole plant hydraulic conductances in the Picea experiment (from [68]).
The decrease in hydraulic conductance during drought caused a stomatal closure and hence a reduction of transpiration.
previously demonstrated that Ψ
cav
is determined only by ul
-
tra-anatomical properties of wall pits (figure 11). The onset
of cavitation is then given by the simple physical law shown
in Section 3.4. For any conduit, if Ψ
xylem
becomes lower
(more negative) than its specific Ψ
cav
value then cavitation
must occur. Therefore, Ψ
cav
puts a functional limitation to the
xylem physiology. The question now is: how close is Ψ
cav
to
the Ψ
xylem
values experienced during a drought period?
Figure 16A compares the time-course of midday Ψ
leaf
val
-
ues with the vulnerability curve established on the xylem of
the same species, Picea abies. It is first important to note that
because of large extra-vascular leaf resistances [133, 137],
Ψ
leaf
is significantly lower than Ψ
xylem
. However when
stomatal, soil and soil-root resistances are increasing during
drought periods, Ψ
leaf
and Ψ
xylem
agree more closely [22].
Therefore, when the soil drought was maximal, Ψ
xylem
was
very close to Ψ
cav
(within a few bars). In Picea, the control of
leaf water loss by an active stomatal closure prevented Ψ
xylem
from reaching damaging values, and thus contributed to the
maintenance of xylem integrity. The consequence of xylem
vulnerability is thus to put an effective functional limitation
to the maximum transpiration rate of a plant.
4.4. Factors controlling the daily maximum water loss
From the previous results it is now possible to see what are
the main controlling factors of the daily maximum water loss
(F
max
). The maximum transpiration rate depends in the first
instance on ambient climatic conditions (mainly light, vpd
and [CO
2
]). For each day there is a climatic maximum water
loss F
clim
and F
max
can never exceed F
clim
. According to what
has been discussed in the previous paragraph, we can also de-
fine a maximum water loss (F
cav
) based on the hypothesis that
Ψ
xylem
> Ψ
cav
to maintain the xylem integrity. Combining with
equation of Section 4.1, we have:
Ψ
xylem
> Ψ
cav
= Ψ
soil
–F
cav
× R
soil-xylem
or
F
max
<F
cav
=(Ψ
soil
– Ψ
cav
)/R
soil-xylem
where R
soil-xylem
is the hydraulic resistance to the sap pathway
from the soil to any xylem segment.
To illustrate the relationships between F
clim
and F
cav
, a dia
-
gram (figure 16B), summarizes a data set very similar to the
previous Picea experiment (figure 16A) but for a Quercus
species [20]. When R
plant
(and R
soil-xylem
) is low (high soil hu
-
midity) then F
clim
is lower than the theoretical F
cav
.F
max
is then
limited only by external climatic conditions, F
clim
. However,
when R
plant
increases because of soil drought, F
cav
becomes
lower than F
clim
and an internal hydraulic limitation appears.
The factors controlling F
max
are thus both internal and exter
-
nal to the plant. The fact that Quercus and Picea (and proba
-
bly most species) are operating close to the point of xylem
dysfunction and that R
plant
is soon and drastically increased by
drought implies that these trees are rapidly facing an internal
744 P. Cruiziat et al.
Figure 16. A: Consequences of xylem vulnerability on tree water re
-
lations. The vulnerability curve of Picea abies (Ψ
leaf
vs. percent loss
of conductivity) shows a steep increase of embolism for water poten
-
tials lower than Ψ
cav
= –2.2 MPa (horizontal line). For well watered
trees Ψ
leaf
was close to –2 MPa but always remained above Ψ
cav
dur
-
ing water stress because of a coupling between maximum transpira
-
tion rates (F, lower x axis) and whole plant hydraulic conductance
(from [69], modified). B: Factor controlling maximum water loss.
Flux/Potential relationships help in understanding daily maximum
transpiration rates in Quercus. For well watered trees (line 1), F
max
is
probably limited by climatic conditions such as light level, air vapor
pressure deficit or CO
2
concentration. However, for water-stressed
trees (lines 2), whole hydraulic resistances increased (steeper slopes)
causing Ψ
xylem
to reach values close to Ψ
cav
. The xylem vulnerability
set an hydraulic limitation to oak water relations (from [20], modi
-
fied).
B)
hydraulic limitation which induces a stomatal closure pre
-
venting a “runaway embolism” [125].
4.5. Stomatal closure can prevent “runaway
embolism”
When the blockage of xylem conduits through embolism
leads to reduced hydraulic conductance an increase of tension
is required in the remaining vessels to maintain the same
water flow to leaves; then more embolism and tension will be
generated in a vicious circle called “runaway” or “cata
-
strophic embolism”. The cycle stops only when the xylem is
fully embolised unless stomatal closure reduces the transpi
-
ration and hence the drop in Ψ
xylem
. Figure 17A illustrates
the process. High climatic demand (large air vapor deficit,
vpd, ܨ) causes high transpiration rates F (F = g
s
× vpd, where
g
s
is the stomatal conductance, ܩ) which may induce xylem
water potential (∆Ψ =R× F, where R is the plant hydraulic
resistance, ܪ) lower than the cavitation threshold. Cavitation
of the conducting elements ܫ is followed by embolism caus
-
ing loss of hydraulic conductivity ܬ, lowering furthermore
the water potential ܪ then causing more cavitation ܫ. This is
the “runaway embolism circle”. It is supposed that for most
plant species, this circle is stopped by an active stomatal clo
-
sure ܭ that reduces transpiration and keeps xylem potential
above the cavitation threshold. Figure 17B shows the case for
Quercus petraea [20]: stomata are completely closed (open
symbols) before xylem embolismdevelops (closed symbols).
Stomatal closure appears then as a key mechanism in the
protection against lethal xylem dysfunction’s. Experimental
evidence for this concept is difficult to obtain because
stomata close efficiently, which stops the cycle. Runaway
embolism is therefore a kind of “limiting concept” deduced
from models of the dynamics of water flow and xylem block
-
age [61, 124]. Sperry et al. [114] extended this concept by in
-
cluding the entire soil-leaf continuum and the combined
effects of hydraulic failure (for a critical value of Ψ) which
can happen at the soil-root contact (rhizosphere) or within the
vascular system. In particular, they showed two important
features. When the root-to-leaf area ratio is low, the soil has a
coarse texture, and the involved plant species is resistant to
cavitation, then the weak point is at the soil-root contact. In
contrast, when the root to leaf ratio is higher, the soil has a
fine texture and the species is vulnerable to cavitation, then
the weak point is the vascular pathway. It is worth noting,
however, that in this model, the radial resistance of roots is
not taken into account. Hacke et al. [52] argued that because
this model gives “a reasonable fit to the seasonal pattern of
transpiration and water potential data, , by implication [it]
suggests that changes in hydraulic conductance caused by
processes not modeled, such as changes in radial conduc
-
tance of roots, , were less important to the overall contin
-
uum conductance than changes modeled in soil and xylem”.
However, compensation effects of processes not taken into
account in this model could lead to the same conclusion. In
other words, this model as useful as it may be, does not neces
-
sarily prove that the radial resistance could not play an impor
-
tant role in particular situations. For example, it has been
shown in desert plants that the radial resistance increases
considerably during soil drying, as soon as the soil water po
-
tential starts to be lower than the root water potential [86].
This increase of the radial resistance (probably involving
aquaporins, [77]) prevents root dehydration. Furthermore, it
is important to remember that the few results reporting com
-
parison between radial and total root resistance (see review
article [117]), all concluded that the radial is larger than the
longitudinal resistance. As a consequence, embolism in the
root xylem should be quite important before affecting the
global root resistance. In the present state of our knowledge,
general conclusions regarding the respective importance of
Hydraulic architecture of trees 745
Figure 17. A: The embolism cycle: the higher the transpiration, the
lower the Ψ
xylem
, the higher the risk of cavitation; for most plant spe
-
cies, this “vicious” or run-away embolism circle is stopped by an ac
-
tive stomatal closure stomatal. B: This is the case for Quercus
petraea: stomata (open symbols) are completely closed before xylem
embolism develops (closed symbols). More explanations in the text
(from [20]).
radial and longitudinal root resistance are premature. Large
differences probably exist according to types and age of
roots, species and environmental conditions.
Cochard et al. [21], studied the water relations of a
Populus hybrid (trichocarpa × koreana) known to lack effi
-
cient stomatal closure in the presence of soil water stress. It
was actually found that only stomata in mature leaves were
unresponsive to water stress. Stomata from young expanding
leaves were still responsive but lost their aperture control
when aging. Soon after water withdrawal, high degrees of
embolism appeared in mature leaf petioles and shoot
internodes, but embolism steadily declined toward shoot api
-
ces. In other words, the better the control of stomatal aper
-
ture, the lower the degree of embolism. Where stomata were
not capable of reducing leaf water loss, embolism occurred
and leaves eventually fell. The “safety margin” for stomata
seems very narrow because maximum loss of conductivity
were noticed for leaves deviating of about 30% from the opti
-
mal complete closure. A similar result has been found on
Betula occidentalis [111].
This point has been studied within different species by
Sperry [115], who gives an estimate of the safety margin by
comparing the xylem water potential Ψ
CT
, at 100% loss of
conductivity with the actual minimum xylem water potential
Ψ
min
experienced by 73 species. There is a significant correla-
tion between Ψ
CT
andΨ
min
. Plants that are more drought resis-
tant are also more resistant to cavitation. The safety margin,
based on the difference Ψ
min
– Ψ
CT
ranges from 1 to 0.5 MPa.
As pointed out by Sperry: “These and other observations sug-
gest that much of the stomatal closure observed during
drought is a result of the amplifying effects of declining of the
liquid hydraulic conductance from soil to leaf rather than a
strictly proportional response to drying soil”. Results [28]
with walnut trees submitted to water stress suggest that
stomata were not responding to changes in Ψ
soil
, root or shoot
resistance per se, but rather to their impact on the rachis or
leaf water potential. It can be concluded from all the pub
-
lished results that if a kind of coupling does exist between hy
-
draulic and stomatal conductances to preserve the possibility
of water flow from the soil to the leaves, the exact mechanism
by which this coupling is regulated is still a matter of discus
-
sion. As pointed out by Comstock [29bis], “major questions
remain unanswered on how water stress signals perceived at
root and leaf locations are integrated at the guard cell to con
-
trol stomatal behavior”.
5. CONCLUSIONS
The hydraulic architecture approach is certainly the major
new trend in tree water relations, which has emerged in the
last decade. It brings together three different and so far very
often completely separated ways of studying plant water rela
-
tions. The first is the very classical and well-established Van
den Honert approach (the use of the electrical analogy to deal
with water transfer through the soil-plant-atmosphere contin
-
uum). The second is the application of the recently revisited
and very much improved cohesion-tension theory. The last is
quantitative anatomy of vessels and tree branching consider
-
ations [130, 133]. Although this approach is still very young
it has already renewed many aspects of the way we look at
tree water relations. It has already given new and valuable an
-
swers to old questions concerning the significance of ring and
diffuse porousness [57]. It can be predicted without risk that
in the near future this approach will continue to develop.
However, much more work should be done on species-
specific xylem anatomy and especially on the changes with
time in the more or less integrated network of connections be
-
tween the roots and branches of the same tree. Recent works
of André [8, 9] and Fujii and Hanato [46] have revealed many
important new anatomical features of the xylem anatomy and
showed how much our knowledge in this domain can be im
-
proved by appropriate techniques.
Likewise, Hacke et al. [53], have given evidence for an in
-
teresting quantitative anatomical feature. They showed a cor
-
relation between wood density and cavitation resistance: the
more drought-tolerant the plant, the more negative the xylem
pressure can become without cavitation, and the greater the
wood density. It seems therefore that wood density is not only
related to support of the plant against gravity, wind, snow,
etc., but also to support the xylem pipeline against the col-
lapsing by large negative pressure.
Concerning cavitation and drought-induced embolism, we
have now well founded explanations. Nevertheless many
questions need additional work. For example, does the pres-
ence of other substances within the sap (ions, inorganic acids,
hormones, etc.), the variations of pH or other physical-chem
-
ical characteristics have an effect on cavitation? If, without
doubt, cavitation in most of the cases, is closely linked to pit
pore’s size (“air seeding” explanation) is it the only way cavi
-
tation can occur? Which quantitative anatomical features will
be necessary to model a vulnerability curve? The determining
factors of the propagation of cavitation within a branch are
also still very poorly known, just like those that determine
and control of pit pore size and pit pore distribution. If
genetics play, more or less directly, a part in the determina
-
tion of this size it is also probable that either internal (physio
-
logical status at the time when vessels form, mechanical
properties of the pit membrane) and external (climatic, etc.)
conditions may be also important.
From the point of view of ecophysiological consider
-
ations, h.a. concepts are used in two different domains:
drought resistance and freezing-induced xylem dysfunction.
For drought resistance, there are increasing evidence that
plant ability to lose water from leaves is also associated with
its ability to supply leaves with water. Under these condi
-
tions, the specific relationships between the plant hydraulic
conductivity and the tension resulting from cavitation leads,
ipso facto, to the limits on the range of tension over which gas
746 P. Cruiziat et al.
exchange can occur and makes clear the fact that large differ
-
ences in drought tolerance between species correlate with
these hydraulic limits. Besides, taking into account the varia
-
tion of conductance in the two “bottlenecks” of the soil-plant
continuum (soil-root zone and vascular pathway) has led to
new suggestions for explanations concerning the possible
linked evolution between root-shoot ratios and cavitation re
-
sistance in response to soil type and water availability:
“Plants should be hydraulically compatible with their soil”
[114]. This statement also expands the discussion on stomatal
regulation. The process (chemical or/and hydraulic signal, ,
or something else) which allows the coupling between
stomatal conductance and hydraulic conductance can be
compared to a safety bell: although always present, it is the
determining factor of stomatal regulation only when events in
soil and climate threaten the functioning of the conducting
system. Beside, as we know, many other factors influence the
stomatal conductance. The problem is nevertheless to under
-
stand how these different kind of regulations work together.
From this drought adaptation point of view, the already col
-
lected results (Cochard, unpublished) concerning the
stomatal and hydraulic conductances relationships, suggest a
first schematic classification of the tree species into three ma-
jor groups (figure 18). Species from the first, and apparently
most important group, at least among the experienced spe-
cies, control loss of their hydraulic conductivity by stomatal
closure: the value of Ψ
xylem
which provokes 10% loss of hy-
draulic conductivity also lead to a 90% of stomatal closure.
Beside two other “strategies” seem to occur. One is formed
by species (PP: Prunus persica) which maximizes stomatal
conductance: for the Ψ
xylem
which lead to 10% loss of conduc-
tivity their stomatal closure is much less than 90%. The other
(CA: Cupressus arizonica) has the opposite behavior: it mini-
mizes the loss hydraulic conductivity by closing its stomata
at a Ψ
xylem
much higher than the one required to provoke 10%
loss of hydraulic conductivity.
The second closed direction in which h.a. concepts are
used and very useful is freezing-induced xylem dysfunction.
In this regard, it is a reasonable temptation to say that there is
a functional connection between the dominance of conifers
within the very cold areas and the fact that, bearing very
narrow tracheids, they are enable to resist to freeze-induced
embolism, in opposition with broadleaf trees. Therefore as
for drought resistance it seems that another anatomical fea
-
ture is a key point to understand the resistance of trees to
frost.
Progress in h.a. are also possible in a quite different direc
-
tion: the partition of water fluxes between the different parts
of a tree under given conditions of transpiration. Until now
h.a. has given a mapping of the different hydraulic capabili
-
ties of the conductingsystem. It is like having the quantitative
description of the hydraulic resistances of the tubing from an
irrigation system: this does not give you the distribution of
actual flows within the different parts of the system, which
depends on the water headings (equivalent to the water poten
-
tial differences) across the system. In order to have a better
understanding of the water functioning of a tree we now need
to get a spatial mapping of the real fluxes which flow within
the various parts of a tree under given boundary conditions.
As said in Section 2.2, this field has been opened, among oth
-
ers, by Roach [97]. To our knowledge, since that date, few at
-
tempts have been made to determine the patterns of water
movement in trees, by using dyes as Roach did [145, 152] or
methods allowing the quantification of flow along a branch or
a root, or a sector of a trunk [48, 83, 140]. In other words we
have still a very elementary knowledge of the distribution of
absorption among the roots, how the water flux from any one
root spreads out within the growth rings, thus reaching not
only a single branch but a large part of the crown [154], how
the distribution of fluxes along a tree is affected by pruning
practices or by the decay of a major root, how the patterns of
water movement within a tree change with soil drying and
Hydraulic architecture of trees 747
Figure 18. Hydraulic architecture of tree and drought. Three main
groups can be distinguished. In the first, most important, trees control
extension of embolism by stomatal closure. In the second, trees fa-
vour a large stomatal conductance g
s
; in the last they seem to close
their stomata before a significant degree of embolism can occur.
(from Cochard, unpublished collected results): PT = Populus
trichocarpa, [21]; JR = Juglans regia, (Cochard and Améglio, un-
published); VM = Vaccinum corymbosum, [6]; FS = Fagus sylvatica,
[24]; PP = Prunus persica, [4]; PH = Pinus halepensis, (Froux and
Huc, unpublished); QR = Quercus robur;QP=Quercus petraea,
[20]; PA = Picea abies, [69]; CL = Cedrus libani, (Ladjal and Huc,
unpublished); CA = Cedrus atlantica, (Froux and Huc, unpublished);
CS = Cupressus sempervirens, (Froux and Huc, unpublished); CB =
Cedrus brevifolia, (Ladjal and Huc, unpublished); CA = Cupressus
arizonica, (Froux and Huc, unpublished).