Báo cáo khoa học: "Osmotic adjustment in Pinus pinaster cuttings in response to a soil drying cycle" pptx
Bạn đang xem bản rút gọn của tài liệu. Xem và tải ngay bản đầy đủ của tài liệu tại đây (201.46 KB, 5 trang )
A. Nguyen-Queyrens et al.Osmotic adjustment in maritime pine cuttings
Note
Osmotic adjustment in Pinus pinaster cuttings in response
to a soil drying cycle
Anne Nguyen-Queyrens
a*
, Paulo Costa
†b
, Denis Loustau
a
and Christophe Plomion
b
a
Laboratoire Écophysiologie et Nutrition, Institut National de la Recherche Agronomique,
Unité de Recherches Forestières de Bordeaux-Cestas, Domaine de l’Hermitage, Pierroton, Gazinet, 33611, France
b
Laboratoire Génétique et Amélioration des Arbres Forestiers, Institut National de la Recherche Agronomique,
Unité de Recherches Forestières de Bordeaux-Cestas, Domaine de l’Hermitage, Pierroton, Gazinet, 33611, France
(Received 3 December 2001; accepted 19 February 2002)
Abstract – Two-year-old cuttings of five genotypes of maritime pine (Pinus pinaster Ait.) were subjected to a four-month treatment of slowly
decreasing water availability in pots. Final predawn needle water potential varied from –0.82 to –1.48 MPa, and was negatively correlated with
plant size. Osmotic adjustment was estimated as the slope of the regression line fitted between relative water content (RWC) and osmotic poten-
tial (Ψπ) assessed during the drying cycle, and as the value of the relative water content for a given level of Ψπ (i.e. Ψπ = –1.7 MPa). Under the
experimental conditions, the genotypes showed a high capacity for osmotic adjustment in needles, and one genotype distinguished itself with a
smaller capacity. The results are discussed in terms of protocol and interpretation when ranking genotypes for osmotic adjustment.
osmotic adjustment / drought / Pinus pinaster
Résumé – Ajustement osmotique de boutures de Pinus pinaster en réponse à un dessèchement du sol. Des boutures issues de 5 génotypes
de pin maritime (Pinus pinaster Ait.) et âgées de 2 ans ont été soumises en pot à un arrosage décroissant lentement au cours du temps pendant
4 mois. Les valeurs finales de potentiel hydrique foliaire de base variaient entre –0,82 et –1,48 MPa, et étaient négativement corrélées à la taille
du plant. L’ajustement osmotique a été estimé par la pente de la régression entre le contenu relatif en eau (RWC) et le potentiel osmotique (Ψπ),
les données étant prises durant le cycle desécheresse, et par la valeur du contenu relatif en eau pour un niveau choisi de Ψπ (i.e. Ψπ = –1,7 MPa).
Dans les conditions de l’expérience, les génotypes ont montré une capacité significative d’ajustement osmotique dans les aiguilles et un géno
-
type différait des quatre autres par une plus faible capacité. Les résultats sont discutés en termes de protocole et interprétation dans le but de clas
-
ser des génotypes pour la capacité d’ajustement osmotique.
ajustement osmotique / sécheresse / Pinus pinaster
1. INTRODUCTION
Maritime pine (Pinus pinaster Ait.) is widely established
in monospecific stands and is found over more than 4 million
ha in southwestern Europe and northern Africa. In France,
this species is bred according to a recurrent selection scheme,
for growth capacity and stem straightness, and the breeding
population is presently in its third generation [2]. In the con
-
text of global change, breeders are particularly interested in
selecting genotypes which maintain growth performance
under drought conditions. Because of its high stomatal sensi
-
tivity to soil water deficit, maritime pine is considered to be a
drought-avoiding species [13, 27]. Earlier studies have re
-
vealed variability in ecophysiological response to drought
among geographical races [11, 12, 14, 15, 24, 25, 27] and
among full-sib families within a French population [14]. The
need for standard screening tests is hampered, however, by
the difficulty in characterizing water stress tolerance.
Ann. For. Sci. 59 (2002) 795–799 795
© INRA, EDP Sciences, 2002
DOI: 10.1051/forest:2002067
* Correspondence and reprints
Tel.: +33 5 57 97 90 67; fax: +33 5 56 68 05 46; e-mail:
Promising perspectives have arisen with the measurement of
water use efficiency via the isotopic approach (i.e.
13
C [14,
27]). Other studies have aimed at identifying drought-respon
-
sive proteins [9, 10], or quantitative trait loci (QTL) of di
-
verse physiological traits believed to be related to drought
resistance [8]. There is however insufficient knowledge
about the adaptative processes involved for evaluating the
water stress tolerance of a genotype. Osmotic adjustment
(OA), defined as the lowering of osmotic potential due to net
solute accumulation, is recognized as a major component of
drought resistance for annual and woody plants [7, 22, 26, 32,
33]. Reduced osmotic potential allows the plant to maintain
turgor, and therefore turgor-dependent processes such as cell
expansion and stomatal aperture, even at low water potential.
From a previous experiment, we have evidence of
osmoregulation in roots tips of a drought-resistant Pinus
pinaster population from Morocco [24]. Fernandez et al. [11]
found a significant decrease in osmotic potential at full turgor
in P. pinaster shoots subjected to water stress treatment. In
contrast to these results, Picon-Cochard and Guehl [28] did
not observe soluble carbohydrate accumulation in P. pinaster
seedling needles subjected to a soil drying cycle. But insuffi
-
cient duration and severity (–0.25 MPa day
–1
) of the applied
water stress in this last study probably suppressed the expres-
sion of OA [1, 6, 16, 31].
In the present study, two-year-old cuttings of several
P. pinaster genotypes were submitted to gradual soil water
depletion. The objectives were to assess the occurrence of
OA in needles and to quantify the degree of OA for adequate
genotype comparison. The most commonly used methods to
quantify the OA capacity of plants are via: (i) regression of
leaf relative water content (RWC) against leaf osmotic poten
-
tial (Ψπ) [21], (ii) extrapolation of the osmotic potential for
stressed plants to the rehydrated state [20], (iii) osmotic po
-
tential of stressed plants that have been rehydrated [4]. The
first method requires measurement of RWC and Ψπ at inter
-
vals during a drying cycle. The two other methods are more
suitable for screening large numbers of genotypes, but as the
OA magnitude depends on the degree of water stress, the
measurements must be performed all at the same tissue water
status. When diverse genetic materials are compared, this last
condition requires normalization for plant tissue water defi
-
cit, which is critical when the genotypes also differ in size,
root traits or any other plant factors that determine the rate of
plant dehydration in a pot. These differences are often en
-
hanced in woody material compared to herbaceous plants.
Recently, Babu et al. [1] compared these three methods on the
same plant material (12 rice cultivars) and found a wider
range of OA values estimated with the first method than with
the two other methods. Method (i) has been applied widely to
crop plants [18, 19, 21, 36] but apparently never to woody
species. In the present work, we evaluate the possibility of us
-
ing this method to differentiate genotypes for OA in
P. pinaster.
2. MATERIALS AND METHODS
2.1. Plant material and water stress application
Cuttings, propagated from five maritime pine seedlings (Pinus
pinaster Ait.) were provided by the Forest Genetics and Breeding
Laboratory (INRA, Bordeaux-Cestas). These five genotypes (A241,
A250, A395, B96, C55) were obtained by self-pollination of hybrids
resulting from crosses between an atlantic and a mediterranean pop
-
ulation (Landes × Corse), selecting for growth capacity and stem
straightness. Three cuttings per genotype were obtained for this
study. These cuttings were first grown in a greenhouse for six
months, and then transplanted into 4 L containers filled with 1/1/1 of
sand/peat/bark (v/v/v) and nutrients (10 g of Osmocote Plus, Scotts
France; 15% N, 10% P, 12% K, 2% Mg). The cuttings ranged from
34 to 71 cm (Hi = initial height) when two years old. They were ran
-
domly distributed on a table in a glasshouse and grown at day/night
temperatures of 25 ± 5 °C/17.5 ± 2.5 °C and 70 ± 10% relative hu
-
midity for 124 days of water stress treatment (May 3rd = day 0).
During the first two weeks of water stress, 60% of the water required
to attain field capacity was supplied to each pot every other day. The
water supply was then reduced sequentially to 40%, 30% and 20%
of that required for field capacity during respectively 1, 1 and
2 months (the water required for field capacity was calculated by
weighing each well-watered pot before the water stress treatment).
The container surface was covered with a synthetic sponge to mini-
mize evaporation. The height increment (∆H) during the treatment
period was assessed as the fraction of initial height.
2.2. Plant water relations
Predawn water potential (Ψ
wp
, MPa) was measured four times
(after 0, 32, 74 and 124 days) with a Scholander pressure chamber
[29, 30] on one-year-old needles of each plant. Immediately after
each Ψ
wp
measurement, another needle was harvested and weighed
for relative water content (RWC) and osmotic potential at full turgor
(Ψ
Π100
) measurements. The proximal end was submerged, severed,
and kept in water at 5 °C in darkness (24 h) for full rehydration. The
needle was then rapidly dried with a paper towel, weighed and
frozen at –20 °C in an Eppendorf tube. For the Ψ
Π100
measurement,
the needle was cut into small pieces (2–3 mm long) and placed in a
2 mL syringe: needle sap was squeezed out after freezing (in liquid
nitrogen) and thawing. Sap osmolality was measured in 10 µL sam
-
ples using a vapor pressure osmometer (Vapro R Model 5520,
Wescor, Logan, USA). Needle dry weight (70 °C, 48 h) was then
determined. From these measurements, relative water content
(RWC) and osmotic potential (Ψ
Π
) were calculated as follows:
RWC = (FW – DW) / (FW
100
– DW);
Ψ
Π
=(Ψ
Π100
× 100) / RWC;
where: FW = needle fresh weight at predawn water potential; DW =
needle dry weight; FW
100
= needle fresh weight at full hydration.
Osmotic adjustment (OA), was considered to occur when the tis
-
sue behavior differed from that of a passive osmometer. In the case
of a passive osmometer, ln RWC = –A ln (–Ψ
Π
)+B,andA=1[21].
When the increase in solute concentration was more than that result
-
ing from a decrease in water content (the passive component), then
osmoregulation was active and A was less than 1. The degree of os
-
motic adjustment for each genotype was therefore studied through
the relationship between ln RWC and –ln (–Ψ
Π
) [21, 23] as the
plants were submitted to gradual water stress. Some authors [5, 23,
34] have also expressed osmotic adjustment capacity as the relative
water content, derived from the function fitted to the data, evaluated
796 A. Nguyen-Queyrens et al.
at a given Ψ
Π
. We chose to calculate RWC at –1.7 MPa (RWC
–1.7
), a
value observed for all studied genotypes.
3. RESULTS AND DISCUSSION
Table I displays the mean values of predawn needle water
potential (Ψ
wp
). After 74 days of treatment, the genotype
A241 exhibited significantly lower values than the other
genotypes. Cuttings of this genotype were also the tallest (ta
-
ble II). Although whole plant leaf area was not estimated, it
can be suggested that taller cuttings likely had larger transpir
-
ing leaf area and so consumed more water. When subjected to
water limitation in a restricted rooting volume, these cuttings
were expected to show rapidly decreasing values of water po
-
tential. Among all studied cuttings, a significant negative re
-
lationship was found between Ψ
wp
(day 124) and Hi:
Ψ
wp
(day 124) = –0.0014 Hi – 0.288; R
2
= 0.42; Pr>F=0.013.
Plant size was thus a source of water status variability, an ef
-
fect that was accentuated when the seedlings were grown and
submitted to water deficit in pots. The strictly genotypical in
-
fluence on height, architecture and biomass traits, though not
easy to evaluate, constitute drought resistance components
through plant water requirements. For this reason, experi-
ments at early ages are far from sufficient. Whatever the ori-
gin of plant size differences (genotypical or environmental),
the effect of plant size is often not taken into account or even
confounded with the effect of plant function [3].
Height growth during the water stress treatment (∆H, table
II) showed some variation among genotypes, but was mainly
a response to better hydrated tissue: the effect of the final pre
-
dawn water potential (Ψ
wp
, day 124) was highly significant
for ∆H (F value = 3.22, Pr>F=0.0073).
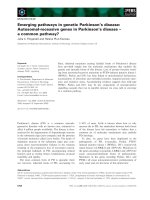
Both osmotic potential (Ψ
Π
) and relative water content
(RWC) declined with increasing stress and a positive rela
-
tionship was found between them (figure 1). The regression
coefficients were rather small (R
2
= 0.36 to 0.59) compared to
values calculated for sunflower cultivars (R
2
= 0.70 to 0.97,
n = 9 to 11, [5]), but similar to some data for maize hybrids
(R
2
= 0.61, n = 10, [17]). This may be due to reduced precision
in RWC and Ψ
Π
due to the structural rigidity and the presence
of wax in conifer needles, which prevent adequate water ex
-
change during tissue handling. Thus, increasing the number
of samples per tested genotype is recommended for further
studies.
All genotypes showed some degree of osmotic adjustment
(i.e. the relationship differed from a line of slope 1) and a
genotypical difference was demonstrated in table III by the
significant interaction between the genotype and the logarith
-
mic value of Ψ
Π
. This difference was, however, mainly due to
the contrasted behavior of the genotype A241, which exhib-
ited a high value of the regression slope. The slopes were
much lower than those previously reported for rice lines (0.58
to 1.16, [19]) or sunflower cultivars (0.5 to 1.6, [5]), except
for genotype A241 (0.277), which was similar to some maize
hybrids (0.16 to 0.92, [17]). These values indicate that the
studied P. pinaster genotypes presented a great ability for
OA. However, the very gradual drought applied in the present
study (–0.28 to –0.75 MPa of Ψ
wp
variation in about
4 months) may have influenced the measured level of OA [6,
31]. While gradual application of stress is needed to allow
plants to respond, if the stress develops too slowly, genotype
differences may be difficult to detect when physiological re
-
sponses are maximized. The small slopes found in the present
study could reflect high solute accumulation provoked by
Osmotic adjustment in maritime pine cuttings 797
Table I. Mean value ± standard deviation (N = 3 cuttings) of the pre-
dawn needle water potential (Ψwp). Within a column, means with the
same letter are not significantly different at P = 0.05.
Ψwp (MPa)
Days of stress
treatment
0 32 74 124
Genotype
A250 –0.58±0.08 a –0.66±0.06 a –0.72±0.10 ab –0.86±0.30 ab
C55 –0.54±0.13 a –0.58±0.05 a –0.66±0.04 ab –0.82±0.20 ab
B96 –0.53±0.04 a –0.64±0.09 a –0.64±0.15 ab –1.08±0.25 ab
A395 –0.64±0.21 a –0.76±0.12 a –0.88±0.14 ab –1.02±0.04 ab
A241 –0.73±0.04 a –0.89±0.22 a –0.94±0.18 bb –1.48±0.04 bb
Table II. Mean value ± standard deviation (N = 3 cuttings) of initial
height (Hi) and height increment during the treatment period (∆H).
Genotype means with the same letter are not significantly different at
P = 0.05.
Genotype Hi (mm) ∆H (%)
A250 347 ± 80 c 14.9 ± 0.9 ab
C55 473 ± 87 b 17.5 ± 7.3 ab
B96 647 ± 51 a 8.6 ± 2.8 bc
A395 577 ± 59 a 9.7 ± 2.8 bc
A241 680 ± 36 a 5.1 ± 1.8 cb
Table III. Variance analysis of the dependent variable ln (RWC). (A)
effects of the genotype and of the relation with the logarithmic value,
–ln (–Ψ
Π
); (B) for each genotype, relation with the logarithmic value,
–ln (–Ψ
Π
); (general linear model procedure, type III SS, SAS Institute
Inc., release 6.03).
Variance analysis of the dependent variable ln(RWC)
(A) Source F value Pr > F
Genotype
–ln (–Ψ
Π
)
interaction
2.25
30.09
3.64
0.0872
0.0001
0.0155
(B) Source Genotype Slope Standard error T Pr > T
–ln (–Ψ
Π
) A250
C55
B96
A395
A241
0.026 b
0.029 b
0.073 b
0.075 b
0.277 a
0.013
0.014
0.036
0.029
0.093
1.98
2.12
2.01
2.60
2.98
0.105
0.079
0.084
0.041
0.025
some drought hardening processes. Further studies are
needed to investigate the optimum stress development rate to
express actual OA capacity in drought-prone conditions.
The values of RWC
–1.7
were found to vary between 87.6
and 91.1% (figure 1) and decreased as the slope of the
corresponding fitted line increased, confirming genotype
ranking according to slope. The relative water content at a
given Ψ
Π
, and the Ψ
Π
value varie with both investigator and
species, summarize the effects of the variations in the
ln RWC/(–ln (–Ψ
Π
)) relationship, and are calculated by
many authors as an indicator of OA. The above reservations
notwithstanding, our five studied genotypes would seem to
show a greater capacity for OA than maize (RWC
–1.64
= 54.5%
to 77.7%, [17]) or sunflower cultivars (RWC
–1.7
= 41.1% to
91.1%, [5]). Such a comparison between herbaceous species
and wood species is limited in its physiological interpreta
-
tion, since water loss occurs in maritime pine at a relative wa
-
ter content of around 80% (unpublished results), while it is
mainly observed at 60–70% RWC [5, 35] for herbaceous
plants.
Our results demonstrate the occurrence of OA by
P. pinaster needles in response to a very gradually applied
soil water deficit. Evaluating the degree of OA through the
ln RWC / (–ln (–Ψ
Π
)) relationship is possible in this forest
species, but the final protocol for a standard genotype testing
system remains to be determined with the precautions em
-
phasized in the present study. In addition, the values reported
here should be interesting in comparison with similar experi
-
ments on other woody species. Estimating the value of OA as
a selection criterion requires knowledge of the relationship
between OA capacity and genetic differences in water-
stressed growth performance.
Acknowledgements: The authors are grateful to J.L. Grange and
E. Bertocchi for technical handling in the greenhouse, assistance in
cutting preparation and harvesting, and E. Dreyer for advice in
writing the earlier version of the manuscript. The investigations
were financially supported by the European Union FAIR1
CT95–0781 project: “Genetic, molecular and physiological deter-
minants of water-use efficiency and drought resistance in major for-
est trees” (DELTA), and two national programs ACC-SV3 (the
Research and Education Ministry) and CTPS (the Agricultural
Ministry).
REFERENCES
[1] Babu R.C., Pathan M.S., Blum A., Nguyen H.T., Comparison of mea
-
surement methods of osmotic adjustment in rice cultivars, Crop Sci. 39 (1999)
150–155.
[2] Baradat P., Pastuszka P., Le pin maritime, in: Gallais A., Bannerot H.
(Eds.), Amélioration des Espèces Végétales Cultivées, INRA, Paris, 1992,
pp. 695–709.
[3] Blum A., Towards standard assays of drought resistance in crop plants,
in: Molecular approaches for the genetic improvement of cereals for stable
production in water-limited environments, Proc. Symp. Cimmyt headquarters,
Mexico, June 21–25, 1999, 11 p.
[4] Blum A., Sullivan C.Y., The comparative drought resistance of landra
-
ces of sorghum and millet from dry and humid regions, Ann. Bot. 57 (1986)
835–846.
[5] Chimenti C.A., Hall A.J., Genetic variation and changes with ontogeny
of osmotic adjustment in sunflower (Helianthus annuus L.), Euphytica 71
(1993) 201–210.
[6] Collet C., Guehl J.M., Osmotic adjustment in sessile oak seedlings in
response to drought, Ann. Sci. For. 54 (1997) 389–394.
[7] Colombo S.J., Changes in osmotic potential, cell elasticity, and turgor
relationships of 2nd-year black spruce container seedlings, Can. J. For. Res. 17
(1987) 365–369.
[8] Costa P., Réponse moléculaire, physiologique et génétique du pin ma
-
ritime à une contrainte hydrique, Thesis, Université Nancy I, France, 1999.
[9] Costa P., Bahrman N., Frigerio J.M., Kremer A., Water-deficit-respon
-
sive proteins in maritime pine, Plant Mol. Biol. 38 (1998) 587–596.
[10] Costa P., Plomion C., Genetic analysis of needle proteins in maritime
pine: 2. Variation of protein accumulation, Silvae Genet.48 (1999) 146–150.
798 A. Nguyen-Queyrens et al.
-0.20
-0.15
-0.10
-0.05
-0.8 -0.6 -0.4 -0.2 0
-ln(-Yp)
ln(RWC)
A250
C55
B96
A395
A241
A241
A250
C55
A395
B96
genotypes
y=0.026x-0.079 R
2
=0.44 RWC
-1.7
=91.1%
y=0.029x-0.088 R
2
=0.45 RWC
-1.7
=90.2%
y=0.073x-0.091 R
2
=0.36 RWC
-1.7
=87.8%
y=0.075x-0.091 R
2
=0.52 RWC
-1.7
=87.7%
y=0.277x+0.015 R
2
=0.59 RWC
-1.7
=87.6%
slope=1
Figure 1. Logarithmic plots of relative
water content against osmotic potential
of one year-old needles: ln RWC = f(–ln
(–Ψ
Π
)). The response of each genotype
is described by the slope of the fitted
line (N = 7 to 8), and by the calculated
RWC
–1.7
value (RWC value for Ψ
Π
=
–1.7 MPa).
[11] Fernandez M., Gil L., Pardos J.A., Response of Pinus pinaster Ait.
provenances at early age to water supply. I. Water relation parameters, Ann.
For. Sci. 56 (1999) 179–187.
[12] Fernandez M., Gil L., Pardos J.A., Effects of water supply on gas ex
-
change in Pinus pinaster Ait. provenances during their first growing season,
Ann. For. Sci. 57 (2000) 9–16.
[13] Granier A., Loustau D., Measuring and modelling the transpiration of
a maritime pine canopy from sap-flow data, Agric. For. Meteorol. 71 (1994)
61–81.
[14] Guehl J.M., Nguyen-Queyrens A., Loustau D., Ferhi A., Genetic and
environmental determinants of water-use efficiency and carbon isotope discri
-
mination in forest trees, in: INRA (Ed.), EUROSILVA, Contribution to Forest
Tree Physiology, Colloq. INRA No.76, Dourdan, France, November 7–10,
1994, pp. 297–321.
[15] Guyon J.P., Kremer A., Stabilité phénotypique de la croissance en
hauteur et cinétique journalière de pression de sève et de la transpiration chez
le pin maritime (Pinus pinaster Ait.), Can. J. For. Res. 12 (1982) 936–946.
[16] Jones M.M., Rawson H.M., Influence of rate of development of leaf
water deficits upon photosynthesis, leaf conductance, water use efficiency,
and osmotic potential in Sorghum, Physiol. Plant 45 (1979) 103–111.
[17] Lemcoff J.H., Chimenti C.A., Davezac T.A.E., Osmotic adjustment
in maize (Zea mays L.): changes with ontogeny and its relationship with phe
-
notypic stability, J. Agron. Crop Sci. 180 (1998) 241–247.
[18] Lilley J.M., Ludlow M.M., Expression of osmotic adjustment and de
-
hydration tolerance in diverse rice lines, Field CropsRes. 48 (1996) 185–197.
[19] Lilley J.M., Ludlow M.M., McCouch S.R., O’Toole J.C., Locating
QTL for osmotic adjustment and dehydration tolerance in rice, J. Exp. Bot. 47
(1996) 1427–1436.
[20] Ludlow M.M., Chu A.C.P., Clements R.J., Kerslake R.G., Adaptation
of species of Centromesa to water stress, Aust. J. Plant Physiol. 10 (1983)
119–130.
[21] Morgan J.M., Osmotic adjustment in the spikelets and leaves of
wheat, J. Exp. Bot. 31 (1980) 655–665.
[22] Morgan J.M., Osmoregulation and water stress in higher plants,
Annu. Rev. Plant Physiol. 35 (1984) 299–319.
[23] Morgan J.M., Growth and yield of wheat lines with differing osmore-
gulative capacity at high soil water deficit in seasons of varying evaporative
demand, Field Crops Res. 40 (1995) 143–152.
[24] Nguyen A., Lamant A., Variation in growth and osmotic regulation of
roots of water-stressed maritime pine (Pinus pinaster Ait.) provenances, Tree
Physiol. 5 (1989) 123–133.
[25] Nguyen-Queyrens A., Ferhi A., Loustau D., Guehl J.M., Within δ
13
C
spatial variability and interannual variations in wood cellulose of two contras
-
ting provenances of Pinus pinaster, Can. J. For. Res. 28 (1998) 766–773.
[26] Osonubi O., Davies W.J., Solute accumulation in leaves and roots of
woody plants subjected to water stress, Oecologia 32 (1978) 323–332.
[27] Picon C., Guehl J.M., Ferhi A., Leaf gas-exchange and carbon isotope
composition responses to drought in a drought-avoiding (Pinus pinaster) and a
drought tolerant (Quercus petraea) species under present and elevated atmos
-
pheric CO
2
concentrations, Plant Cell Environ. 19 (1996) 182–190.
[28] Picon-Cochard C., Guehl J.M., Leaf gas exchange and carbohydrate
concentrations in Pinus pinaster plants subjected to elevated CO
2
and a soil
drying cycle, Ann. For. Sci. 56 (1999) 71–76.
[29] Ritchie G.A., Hinckley T.M., The pressure chamber as an instrument
for ecological research, Adv. Ecol. Res. 9 (1975) 165–254.
[30] Scholander P.F., Hammel H.T., Bradstreet E.D., Hemmingsen E.A.,
Sap pressure in vascular plants, Science 148 (1965) 339–346.
[31] Shangguan Z., Shao M., Dyckmans J., Interaction of osmotic adjust
-
ment and photosynthesis in winter wheat under soil drought, J. Plant Physiol.
154 (1999) 753–758.
[32] Turner N.C., Jones M.M., Turgor maintenance by osmotic adjust
-
ment, a review and evaluation, in: Turner N.C., Kramer P.J. (Eds.), Adaptation
of plants to water and high temperature stress, Wiley-Interscience, New York,
1980, pp. 87–103.
[33] Vivin P., Guehl J.M., Clément A., Aussenac G., The effects of eleva-
ted CO
2
and water stress on whole plant CO
2
exchange, carbon allocation, and
osmoregulation in oak seedlings, Ann. Sci. For. 53 (1996) 447–459.
[34] Wright G.C., Smith R.C.G., Morgan J.M., Differences between two
grain sorghum cultivars in adaptation to drought stress. III. Physiological res-
ponses, Aust. J. Agric. Res. 34 (1983) 637–665.
[35] Wright P.R., Morgan J.M., Jessop R.S., Turgor maintenance by os-
moregulation in Brassica napus and B. juncea under field conditions, Ann.
Bot. 80 (1997) 313–319.
[36] Zhang J., Nguyen H.T., Blum A., Genetic analysis of osmotic adjust-
ment in crop plants, J. Exp. Bot. 50 (1999) 291–302.
To access this journal online:
www.edpsciences.org
Osmotic adjustment in maritime pine cuttings 799