Báo cáo khoa học: "The effects of climatic variability on radial growth of two varieties of sand pine (Pinus clausa) in Florida, USA" docx
Bạn đang xem bản rút gọn của tài liệu. Xem và tải ngay bản đầy đủ của tài liệu tại đây (2.25 MB, 18 trang )
Original article
The effects of climatic variability on radial growth
of two varieties of sand pine (Pinus clausa)
in Florida, USA
Albert J. Parker
a,*
, Kathleen C. Parker
a
, Timothy D. Faust
b,†
and Mark M. Fuller
b
a
Department of Geography, University of Georgia, Athens, GA 30602-2502, USA
b
School of Forest Resources, University of Georgia, Athens, GA 30602-2152, USA
(Received 5 September 2000; accepted 4 December 2000)
Abstract – Total ring, earlywood, and latewood master chronologies were derived for six stands (three of each of the two varieties) of
sand pine (Pinus clausa) spanningthe geographic breadth of the species extant range in Florida, USA. Climate/growth correlations, ana-
lysis of extreme growth years, and multiple regression models were developed to relate growing season (current and lagged) monthly
temperature and precipitation withinterannual variability in sand pine growth increments. Four research hypotheses were evaluated: (1)
Sand pine growth is more sensitive to variation in precipitation than variation in temperature. (2) Sand pine growth variation is linked to
El Niño-Southern Oscillationwarm- vs. cold-phaseevents. (3) Climate/growth relationsare stronger forthe peninsular (Ocala; P. c. var.
clausa) variety of sand pine than the panhandle (Choctawhatchee; P. c. var. immuginata) variety. (4) Climatic signals are stronger for
coastal populations (vs.inland) for bothvarieties. Precipitation (especially inthe winter/spring seasonof current-year growth) was more
strongly linked to sand pine growth than temperature, earlywood growth was significantly greater in warm-phase El Niño-Southern
Oscillation years in four of the six stands, and climate/growth relationships were stronger in coastal populations. We found no consistent
inter-varietal contrasts in the strength of climatic signals, although climate/growth relationships were distinctive in the two inland pan-
handle stands, wherecanopy/understory interactions may partiallyobscure expression of climatic influence. We found greater sensitivi-
ty to temperature in inland panhandle stands (especially in latewood series), but consistently strong growth response to precipitation in
the other four stands (especially in earlywood and total ring series). Our findings extend the evidence for ENSO influence on terrestrial
biophysical phenomena in Florida.
sand pine / dendroclimatology / El Niño-Southern Oscillation / Florida
Résumé – Effets de la variabilité climatique sur la croissance radiale de deux variétés de pin (Pinus clausa) en Floride, USA. La
chronologie des années caractéristiques a été dérivée de la mesure des cernes, du bois initial et du bois final dans 6 peuplements (3 pour
chacune des variétés) de Pinus clausa représentant toute la gamme géographique de l’espèce en Floride, USA. La corrélation cli-
mat/croissance, l’analyse des années de croissance extrême etdes modèles derégression multiple ontété développées pourétablir les re-
lations entre la température et les précipitations mensuelles au cours de la saison de végétation, et la variabilité inter-annuelle des
accroissements de Pinus clausa. Quatre hypothèses de recherches ont été évaluées : (1) La croissance de Pinus clausa est plus sensible
aux variations des précipitations qu’à celles de la température. (2) La variation de croissance de Pinus clausa est liée aux oscillations
(évènements chaudsversus froids deEl Niñodans le sud). (3) Lesrelations climat/croissance sont plus fortespour la variété péninsulaire
(Ocala
.; P.c. var.clausa) quepour lavariété Choctawhatchee (P. c. var. immuginata). (4)Les signauxclimatiques sontplus fortspour les
Ann. For. Sci. 58 (2001) 333–350
333
© INRA, EDP Sciences, 2001
* Correspondence and reprints
Tel. (706) 542 2368; Fax. (706) 542 2388; e-mail:
† Deceased.
populations côtières (versus intérieures) pour les deux variétés. Les précipitations (particulièrement celles de la saison hiver-printemps
de l’année courante de croissance) sont plus fortement liées à la croissance de Pinusclausa que la température. La croissance initiale est
significativement plusgrande pendant lesannées de phases chaudes desoscillations de El Niño pour4 des 6peuplements, etles relations
climat/croissance sont plus fortes pour les populations côtières. Il n’a pas été trouvé de différences consistantes inter-variétales dans la
force du signal climatique, bien que les relations climat/croissance soient différentes pour les deux peuplements intérieurs de la variété
Choctawhatchee, où les interactions canopées/sous étage ont pu atténuer l’expression des signaux climatiques. Il a été mis en évidence
une plus grandesensibilité à la températuredans les peuplements intérieurs de Choctawhatchee (en particulier pour le bois final), mais il
y aune forteréponse, constante,de lacroissance pourles précipitationsdans les4 autrespeuplements (enparticulier pourle boisinitial et
l’ensemble des cernes). Ces travaux confirment l’évidence de l’influence de ENSO sur les phénomènes biophysiques terrestres.
Pinus clausa / dendroclimatologie / oscillation de El Niño / Floride
1. INTRODUCTION
Variation in climate/growth relationships exhibited
by a single tree species across environmental and geo-
graphic gradientsprovidesvaluable insights intotheinte-
grated response of plants to physical site factors [8, 17,
26] as well as into thereconstructionofpast climates [10,
16, 28, 33]. Overlying these physical gradients may be
more subtle intraspecificvariation imposed by regionally
distinctive patterns of stand history and plant demogra-
phy. Although less commonly examined in tree-ring
studies (which generally limit their sample to those trees
in a population mostlikelyto experience physical stress),
such biotically and historically mediated variability in
climate/growth relations may be prominent for some
taxa.
The purpose of this study is to document climate/
growth relations throughout the range of sand pine
(Pinus clausa), a species virtually endemic to Florida,
USA. By developing a regional network of master chro-
nologies based on total ring, earlywood, and latewood
widths, this study offers a comprehensive examination of
dendroclimatic variation within this geographically re-
stricted species. Moreover, all trees in mapped stands are
sampled, so that there is no systematic bias in tree selec-
tion to favor expression of a climatic signal. Sand pine is
particularly well suited for examining the effects of both
physical gradients and biotic influences on climate/
growth relations, because climatic gradients of precipita-
tion and temperature seasonality are well expressed
across Florida, and previous work has documented
meaningful contrasts in population structure and distur-
bance dynamics between the two varieties of sand pine
[21].
Florida experiences a moist subtropical, grading to
near-tropical, climate [4]. Annual precipitation totals are
relatively high (ca. 120–180 cm), although drier winters
become increasingly pronounced southward on the pen-
insula. In central Florida, about one-third of the total
annual precipitation falls in the six-month period from
November to April. Summers are uniformly warm and
humid throughout Florida, with a high frequency of con-
vective thundershowers, especially over the interior of
the peninsula. Winters exhibit a marked mean tempera-
ture gradient; freezes are uncommon (1.5 to 3.5 days per
year) in central Florida, but are more common (8 to
20 days per year, depending on coastal proximity) in the
Florida panhandle [25]. Growing season ranges from a
minimum of about 8 months in the panhandle interior to
about 11 monthsnear the southeastern rangelimit of sand
pine. Annual potential evapotranspiration estimates
range from about 105 to 120 cm.
In addition to geographic gradients in winter season
precipitation and temperature across Florida, climatolo-
gists have established strong links between El Niño-
Southern Oscillation (ENSO) phaseandwinter precipita-
tion departures across the southeastern United States [7,
14, 22]. Warm-phase, or El Niño events, are commonly
characterized by wetter than normal winters with re-
gional strengthening of the subtropical jet stream. By
contrast, cold-phase, or La Niña events, often yield drier
than normal winters over Florida, as upper-level support
for storm development is weakened.
Sand pine hasbeen taxonomically partitioned intotwo
varieties [18, 32]: Choctawhatchee sand pine (P. c. var
immuginata) is restricted to the Florida panhandle (ex-
cept for a population on an Alabama barrier island), and
Ocala sand pine (P. c. var clausa) is limited to the Florida
peninsula. In general, sand pine is shade-intolerant [5],
subsists on sandy, dry, nutrient-poor substrates [9], and
possesses a disturbance-dependent regeneration ecology
[19].
Our previous research [21] has established significant
ecological differences in demographic structure between
the two varieties of sand pine. Choctawhatchee sand pine
is not fire dependent (and, hence, is generally non-
serotinous). Individuals of this variety preferentially
regenerate in small canopy gaps triggered by frequent
334 A.J. Parker et al.
wind damage along the Gulf of Mexico coastal strand.
Thirty-five to 65% of trees in sample populations of this
variety displayed at least one growth release event linked
with wind damage [21]. Population structures are of the
reverse-J form [31], with occasional stem recruitment in
the understory of most stands. Ocala sand pine is histori-
cally dependent on crown fires, and, hence, exhibits a
high percentage of serotiny in most populations. Light-
ning fires are common, especially during drier summers
in the Florida peninsula [29]. Before effective fire exclu-
sion, a coarse-grained patch dynamic of stems recruited
following fires. Naturally seeded, mature populations of
this variety (those we sampled wereinitiatedinthe 1920s
and 1930s) exhibited relatively little evidence of growth
release (10–25% of stems) [21]. Population structures
were narrowly even-aged, with recruitment in burned
patches ceasing about a decade after crown fire.
Given our knowledge of climatic gradients across
Florida and ecological/ demographic contrasts between
sand pine varieties, we tested four research hypotheses:
1) Sand pine is more sensitive to interannual varia-
tion in precipitation than temperature. Restriction
of sand pine to xeric substrates imposes a significant
likelihood that growth may be curtailed in drought
years. Because winters are typically dry (especially
southward on the peninsula), sandpinemaybe partic-
ularly sensitive to interannual variability in winter
precipitation. By contrast, long growing seasons and
warm temperatures impose little direct effect on
growth patterns, although temperature may influence
climate/growth relations for interior sites in the pan-
handle, where freeze frequency anddurationis higher
than elsewhere across Florida.
2) Sand pine growth anomalies are linked to warm
and cold phases of the ENSO. To the extent that
sand pine growth is sensitive to interannual variation
in winter precipitation, warm-phase ENSO years
should yield greater sand pine growth than cold-
phase ENSO years.
3) Dendroclimatic signals are stronger in Ocala sand
pine (the peninsular variety) than Choctawhatchee
sand pine (the panhandle variety). Climatic effects
may be muted by varietal contrasts in regeneration
ecology. Synchronous recruitment and stand devel-
opment in fire-initiated patches yield more uniform
growth patterns among canopy trees in Ocala sand
pine, which should minimize the confounding influ-
ence of shading and other forms of competition on
growth. By contrast, the multiple-aged structure of
Choctawhatchee sand pine promotes growth suppres-
sion of understory stems by shading.
4) Coastal populations of both varieties exhibit
stronger dendroclimatic signals than their inland
counterparts. Sand pine populations located on or
near the coastal strand often exhibit some degree of
stunting, apparently associated with pruning by per-
sistent winds andpossibly limited depth of freshwater
lenses. Such environmentally imposed physiological
stress commonly sharpens the climatic signal embed-
ded in tree-ring records [23, 27].
We employ climate/growth correlations, analysis of ex-
treme growth years, and multiple regression to character-
ize spatial variability in thedendroclimaticsignalof sand
pine and to evaluate our research hypotheses. Our study
is conceptually distinct from most dendroclimatic recon-
structions to date, because we collected cores from all
trees in each stand. This permits us to compare the
strength of the climatic signal in stands of differing age-
structure and canopy/understory competitive effects. In
addition, if ENSO phase linkages with sand pine growth
emerge, our study will extend the evidence in the south-
eastern United States of terrestrial biophysical responses
to atmospheric teleconnections modulated by ENSO
phase, which have heretofore concentratedonfire behav-
ior [1, 24] and agricultural productivity [12, 13].
2. MATERIALS AND METHODS
2.1. Study sites
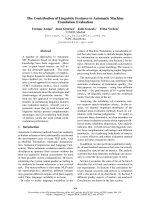
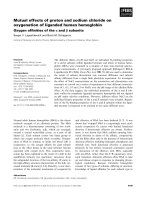
Three sand pine forest stands were mapped for each
variety (figure 1). For Choctawhatchee sand pine (pan-
handle), sites were sampled at Eglin Air Force
Base–Scrub Hill (EOS), Gulf Islands National Sea-
shore–Naval Live Oaks (GIN), and St. Joseph Peninsula
State Park (STJ). For Ocala sand pine (peninsula), sites
were sampled at Highlands Hammock State Park (HHO),
Jonathan Dickinson State Park (JDO), and Rock Springs
Run State Reserve (RSO). Location of mapped plots was
randomized within larger forest stands; plot sizes ranged
between 40 × 40and 60 × 60 m, dependingonsand pine
density. Each stand was strongly dominated by sand pine
(>80% of overstory basal area); in addition, substrates
and disturbance histories were uniform within each
stand.
Sand pine inhabits modern and paleo-dunes associ-
ated with marine beach sediments. STJ was located on
Climate/growth relations of sand pine 335
recently active sand dunes and possessed dune-and-
swale topography. JDO, the other coastal stand, also ex-
hibited remnant dunal topography, with a thick veneer of
sands (ca. 2–4 m) overlying Pleistocene marine sedi-
ments. The remaining four sites were flat to gently slop-
ing (<3°), with a thin veneer of sand (ca. 1–2 m)
overlying Pleistocene orolder sediments. Surface soils in
all stands were sandy (sand fraction = 92–98%, see ta-
ble I), with capillary water estimates in the upper 50 cm
of soil of 2.0–2.2 cm [9]. Elevations were low, ranging
from 3.5 m above sealevelat STJ to 40 m at EOS.Flatto-
pography, excessively drained sands, and low soil nutri-
ent contents (table I) provided comparable substrate con-
ditions among sites, although the dunes at STJ lacked
older, clay-rich sediments at depth.
All stands were on state or federal reserve lands char-
acterized by passive management (fire exclusion, no log-
ging or grazing) and light recreation. Fires have been
absent from stands since, at least, establishment of the
oldest stems; hurricanes and extratropical cyclones have
exposed all stands to sporadic blowdown events.
336 A.J. Parker et al.
Figure 1. Range map of sand pine with location
of study stands.
Table I. Summary of tree-ring data used to develop master chronologies in each stand.
Period
of record
No. cores No. trees
Mean ± SD of radial increment (mm)
Total ring Earlywood Latewood
Choctawhatchee sand pine:
EOS 1897–1994 126 91 1.81 ± 0.90 1.34 ± 0.76 0.48 ± 0.27
GIN 1930–1994 86 62 1.82 ± 0.83 1.38 ± 0.72 0.45 ± 0.25
STJ 1874–1994 63 54 1.08 ± 0.57 0.82 ± 0.47 0.27 ± 0.17
Ocala sand pine:
HHO 1940–1994 119 81 1.93 ± 1.10 1.40 ± 0.93 0.53 ± 0.30
JDO 1927–1993 91 74 1.62 ± 1.05 1.25 ± 0.91 0.36 ± 0.23
RSO 1939–1994 138 89 2.14 ± 0.99 1.60 ± 0.84 0.54 ± 0.26
2.2. Climatic data
Monthly temperature and precipitation data were
summarized by climatic division with data available
from the National Climatic Data Center [20]. Florida is
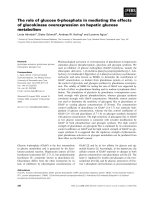
partitioned into seven climatic divisions. All three pan-
handle sites are located in Division 1. The peninsular
sites are in Division 3 (RSO) or Division 4 (HHO, JDO)
(figure 2; the climate diagram for Division3is not shown
– it differs little from Division 4). Climatic division
means were used instead of individual weather stations
near study sites because local stations often had missing
data and a relatively short period of record. Complete
monthly temperature and precipitation records extend
back to 1895 for each climatic division.
2.3. Tree core extraction and measurement
Two cores were extracted from all sound trees (i.e.,
lacking heart rot)>5cmdiameter at breast height (dbh =
1.4 m). Cores were taken at right angles from one an-
other, 30 cm above the ground. Cores were maintained as
distinct records, rather than averaged by tree, because of
substantial within-tree variation in growth patterns in
some stands. Core processingfollowedstandard protocol
[30]. Cores were mounted, sanded with progressively
finer-grit sand paper, and measured with a computer-
based optical image analysis system (OPTIMAS
TM
)atan
accuracy of 0.008 mm. Transitions between earlywood
and latewood in annual increments were determined by
darkening ofcolor.Most earlywood-latewood transitions
were distinct; where transitions were diffuse, gray-scale
values from the image analysis software were available
to aid in marking the transition.
2.4. Master chronology development
At least one core from 75 to 95% of trees ineachstand
was reliably crossdated, as confirmed by COFECHA
[15]. Crossdated cores were retainedfordeveloping mas-
ter chronologies. The highest percentage of trees that
were not crossdated (20 to 25%) came from the two
coastal populations (JDO and STJ). Among the
Choctawhatchee sand pine stands, the majority of trees
excluded from the master chronology were understory
individuals (20 of29 were <8 cm dbh);by contrast, Ocala
sand pine understorytreeswere rare–none were excluded
from the chronology.
Three master chronologies were developed for each
stand: total ring width, earlywood, and latewood. To ac-
centuate short-term variance in tree growth that is most
likely linked to interannual climatic variability, ring-
width series from each core were filtered by three proce-
dures [11]: (1) low frequency variance was removed
from the series with a cubic smoothing spline (50% cut-
off after 32 years), (2) persistence within the resulting
smoothed series was removed by autoregressive model-
ing–thereby muting temporal carryover in growth signal
from year-to-year, and (3) the resultant series was fitted
Climate/growth relations of sand pine 337
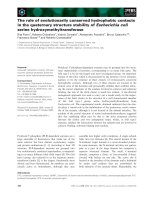
Figure 2. Climate diagrams for Florida Climatic Division 1
(panhandle) and Division 4 (central peninsula). Precipitation is
depicted with bars;temperature with aline. Based on the54-year
period of common record for this study (1940–1993).
to a negative exponential form to account for the decline
in radial growth rates as trees age. Master chronologies
for each stand and segment type were expressed as stan-
dard normaldeviates(z-scores) across all yearsof record.
Master chronologies developed for total ring width,
earlywood, and latewood in each stand were correlated
with one another to assess the commonality in their
growth response. For each annual increment segment
(i.e., total ring, earlywood, and latewood), master chro-
nologies were correlated for all stand pairs to assess geo-
graphic variability and varietal contrasts in patterns of
growth.
2.5. Climate/growth modeling
For each master chronology,bivariatecorrelations be-
tween annual growth increments and monthly mean tem-
perature, and between annual growth and monthly total
precipitation were calculated for the 21-monthperiodex-
tending from March of the previous growing season to
November ofthecurrent growing season,inkeeping with
unusually long growing seasons in these near-tropical
latitudes. To facilitate geographic comparison, these
analyses were limited to the 54-year period of record
common to all six sites (1940–1993).
As complementary evidence of climatic controls, ex-
treme growth years were analyzed for the same period.
For each master chronology, annual growth increments
for which ͉z͉ > 1.0 were segregated into rapid-growth and
slow-growth groups. Differences-of-means (Student’s t-
tests) between rapid- and slow-growth years were calcu-
lated for monthly mean temperature and total precipita-
tion data for the same 21-month interval used in bivariate
correlations.
For each masterchronology, multiple regression mod-
els relating annual growth increments to climatic vari-
ables were developed for the period of common record
(1940–1993). We used ordinary least-squares regression
instead of climatic response functions, because regres-
sion explicitly permits interaction among regressors,
thus providing a better integrative explanatory model
than the sets of bivariate correlations on which climate
response functions are based. Candidate climatic vari-
ables for regression included monthly mean temperature
and total precipitation, as well as composite means and
sums for multiple consecutive months. For example, the
importance of winter and spring precipitation might be
incorporated into a model by summing the total precipi-
tation received from JanuarythroughMay in each year of
record and entering this as a single variable. Inclusion of
multiple-month climatic variables promotes parsimony,
both statistically (by limiting the reduction of degrees of
freedom in the model) and physically (by emphasizing
the aggregate significance ofclimaticforcing during crit-
ical periods).
Following the recommendation of the Center for
Ocean-Atmospheric Prediction Studies at Florida State
University [2], we adopted the Japan Meteorological
Agency (JMA) ENSO index, which is based on observed
(1949–present) and reconstructed (1868–1948) mean
sea-surface temperature anomalies from the tropical Pa-
cific Ocean. ENSO years were assigned to warm phase,
neutral, or cold phase, based on the JMA index. We
tested for differences of means of sand pinegrowthindex
values between warm- and cold-phase ENSO years for
each of the 18 master chronologies.
3. RESULTS
3.1. Summary statistics and master chronologies
Mean radial growth rates were highest for inland
Ocala sand pine stands (HHO, RSO). By contrast, the
two coastal populations (JDO, STJ) were characterized
by the lowest mean growth rates (table I).
Serial correlations between the annual increment seg-
ment types in each stand revealed that total ring width
and earlywood widthseries were very strongly correlated
(0.865–0.981) (table II). Latewood width series were
uniformly lower in correlation with both total ring and
earlywood width series across all stands.
Inter-stand correlations of ring width series produced
consistent results: correlations between stands of the
338 A.J. Parker et al.
Table II. Correlation among width series within each stand.
* p < 0.05, ** p < 0.01, *** p < 0.001.
Site Earlywood-
Latewood
Earlywood-
Total Ring
Latewood-
Total Ring
EOS 0.497 *** 0.865 *** 0.583 ***
GIN 0.556 *** 0.937 *** 0.682 ***
STJ 0.563 *** 0.896 *** 0.571 ***
HHO 0.552 *** 0.975 *** 0.709 ***
JDO 0.563 *** 0.971 *** 0.677 ***
RSO 0.686 *** 0.981 *** 0.803 ***
same variety were positive and statistically significant,
whereas correlations between stands of different variet-
ies were not statistically significant (table III). There
were two exceptions to this outcome: JDO and RSO did
not exhibit a significant positive correlation for latewood
width (although both are from Ocala sand pine) and STJ
and RSO exhibited significant positive correlations for
all three series types (although they are of differing vari-
eties).
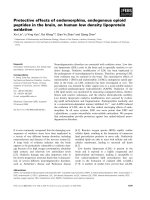
Stand-level master chronologies for all three series
types were similar; only total ring width chronologiesare
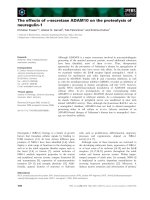
displayed (figure 3). Years of record characterized by
consistent growth anomalies(͉z͉ > 1.0) forhalf or more of
the stands include:
– rapid growth–1912*, 1929*, 1947, 1959, 1960, 1966,
1969, 1973, 1975, 1983, and 1991;
– slow growth–1927*, 1932*, 1940, 1951, 1954, 1963,
1967, 1981, and 1985.
Several early years are denoted with an asterisk because
they pre-date the period of common record for all six
sites and are, therefore, based on fewer chronologies.
(Recognition of extreme years based on departures of
half or more stands in a given year is arbitrary–too few
chronologies are available to employ a more statistically
rigorous cut-off.) The period from 1959 to 1975 is distin-
guished by a high concentration of rapid-growth years
(over the entire period of record, 6 of the 11 rapid-growth
years occur in this 17-year interval). Slow-growth years
were more historically dispersed, although the early-
1950s produced two slow-growth years in a 4-year pe-
riod. Years of anomalous growth were not uniformly ex-
pressed by both varieties. Growth anomalies in 1954 (–),
1963 (–), and 1969 (+) were recorded in Choctawhatchee
stands but not Ocala stands; conversely, growth anoma-
lies in 1951 (–), 1983 (+), and 1985 (–) were recorded in
Ocala stands but not Choctawhatchee sand pine stands.
3.2. Climate/growth correlations
Precipitation was generally positively associated with
growth in the current growing season, often significantly
so in the period between January and June (figures 4 and
5). Indeed, winter and spring precipitation leading into
the growing season emerged as the most consistent and
Climate/growth relations of sand pine 339
Table III.Inter-stand correlations of growth indicesfor earlywood,latewood, andtotal ringwidth. *p < 0.05, ** p< 0.01,*** p< 0.001.
Total Ring:
GIN STJ HHO JDO RSO
EOS 0.464 *** 0.539 *** 0.045 0.068 0.151
GIN ___ 0.387 ** –0.080 0.104 –0.055
STJ ___ ___ 0.246 0.214 0.312 *
HHO ___ ___ ___ 0.492 *** 0.499 ***
JDO ___ ___ ___ ___ 0.432 **
Earlywood:
GIN STJ HHO JDO RSO
EOS 0.405 ** 0.491 *** 0.054 0.129 0.179
GIN ___ 0.307 * –0.055 0.150 –0.085
STJ ___ ___ 0.262 0.258 0.297 *
HHO ___ ___ ___ 0.474 *** 0.484 ***
JDO ___ ___ ___ ___ 0.401 **
Latewood:
GIN STJ HHO JDO RSO
EOS 0.575 *** 0.524 *** 0.246 –0.080 0.267
GIN ___ 0.518 *** 0.176 0.002 0.181
STJ ___ ___ 0.202 0.059 0.322 *
HHO ___ ___ ___ 0.283 * 0.551 ***
JDO ___ ___ ___ ___ 0.159
prominent correlate of sand pine growth patterns across
the species’ range. Precipitation from the previous grow-
ing season exhibited weaker correlations of mixed sign,
very few of which were statistically significant.
Precipitation was more strongly correlated with sand
pine growth than was temperature in STJ (figure 4) and
all three of the Ocala sand pine stands (figure 5). For the
three Ocala stands, temperature correlations with growth
series were weak, although there is some evidence of
lagged temperature effects from the prior spring in the
inland Ocala stands (HHO, RSO) (figure 5). For the two
inland Choctawhatchee stands (EOS, GIN) temperature
and precipitation exhibited comparable levels of
340 A.J. Parker et al.
Figure 3. Total ring width master chronol-
ogies for each of the six study stands, with
the growth index expressed as standard
normal deviates.
Climate/growth relations of sand pine 341
Figure 4. Climate/growth correla-
tions for Choctawhatchee sand pine
stands. Pearson product-moment
correlation coefficients of monthly
mean temperature and total precipi-
tation with annual radial growth are
plotted with bars for 21 consecutive
months from March of the previous
growing season [MAR (–1)] to No-
vember of the current growing sea-
son. Corelation coefficients that are
statistically significant at p < 0.05
are depicted with shaded bars.
342 A.J. Parker et al.
Figure 5. Climate/growth correla-
tions for Ocala sand pine. See
legend of figure 4 for details.
correlation with sand pine growth increments. Tempera-
ture correlations in these two stands were generally posi-
tive for the early growing season periods (statistically
significant only inFebruary), switching to negativeinthe
later months of the growing season (statistically signifi-
cant only in August).
Among the series types, precipitation is more consis-
tently positively associated with total ring width and
earlywood width series. Latewood width series exhibited
somewhat greater responsiveness to temperature vari-
ables.
3.3. Analysis of extreme years
Examining differences of means between rapid- vs.
slow-growth years for the same suite of monthly climatic
variables employed in climate/growth correlations re-
vealed similar outcomes. Positive associations of
monthly precipitation variables with rapid-growth years
were evident for both sand pine varieties (table IV). For
Choctawhatchee sand pine, there were 21 positive
associations of precipitation with rapid growth, as op-
posed to five negative associations. All of the positive
Climate/growth relations of sand pine 343
Table IV.Summary of extremeanalyses formonthly precipitation variables during theperiod of common record (1940–1993).For each
time series (site by series type), years in which
z > 1.00 were segregated into rapid- vs. slow-growth groups. Significant difference-of-
means outcomes(Student’s t-test;p <0.05) are depicted with a + where more rapidgrowth isassociated withgreater precipitationand a–
where slower growth is associated with greater precipitation.
MAM J J ASOND J FMAM J J ASON
LAG (–1) NO LAG
Choctawhatchee sand pine:
EOS:
Total Ring + + +
Earlywood – +++
Latewood
GIN:
Total ring – +
Eearlywood
Latewood ––– ++
STJ:
Total ring + + + + + +
Earlywood + + + +
Latewood + +
Ocala sand pine:
HHO:
Total ring + + + +
Earlywood + + + + +
Latewood + + +
JDO:
Total ring + +
Earlywood + + +
Latewood
RSO:
Total ring + + + +
Earlywood + + + +
Latewood ++
associations were from the current growing season, with
18 of the 21 clustered in the winter/spring interval from
January to May. Each of the five negative associations
fell during the prior autumn (September to December).
For Ocala sandpine,the positive association ofprecipita-
tion with rapid-growth years is even stronger, with 27
positive associations and no negative associations.
Twenty- one of the 27 positive associations for Ocala
sand pine occurred in the January to May period of the
current growing season. For each variety, about 14% of
the t-tests were significant at p < 0.05, above the 5% of
significant outcomesthatwould be generatedby chance.
In keeping with the bivariate climate/growth correla-
tions, temperature was more weakly associated with
anomalous growth years than precipitation (table V). For
Choctawhatchee sand pine, 8% of the t-tests generated
significant values for monthly temperature variables,
moderately exceeding the 5% random standard. Ten
344 A.J. Parker et al.
Table V. Summary of extreme analyses for monthly temperature variables during the period of common record (1940–1993). For each
time series (site by series type), years in which ͉z
> 1.0 were segregated into rapid- vs. slow-growth groups. Significant difference-of-
means outcomes(Student’s t-test;p < 0.05) are depictedwith a+ wheremore rapid growth is associatedwith highertemperatures anda –
where slower growth is associated with higher temperatures.
MAM J J AS OND J FMAM J J ASON
LAG (–1) NO LAG
Choctawhatchee sand pine:
EOS:
Total ring –
Earlywood
Latewood –
GIN:
Total ring
Earlywood +
Latewood –
STJ:
Total ring + + + + –
Earlywood + + +
Latewood + + –
Ocala sand pine:
HHO:
Total ring
Earlywood + –
Latewood
JDO:
Total ring
Earlywood +
Latewood +
RSO:
Total ring –
Earlywood
Latewood +
positive associations of temperature with growth were
evident; seven of these ten occurred in the autumn (Sep-
tember to November) of the prior year. By contrast, there
were five negative associations of temperature with
growth, all clustered during the hottest period of the cur-
rent growing season (June to August). For Ocala sand
pine, only 3%oft-test outcomes for monthly temperature
variables were significant, below the 5% random stan-
dard.
3.4 Multiple regression analysis
With the exception of GIN, adjusted-R
2
values for
models based on total ring width ranged between 0.378
and 0.547, indicative of reasonable levels of explanatory
covariance between climatic drivers and sand pine
growth response (table VI). STJ, the coastal
Choctawhatchee site, displayed the highest explained
variance for all three series. Earlywood-based regression
models were consistently strong for Ocala sand pine
stands, with adjusted-R
2
values ranging between 0.407
and 0.487. Earlywood-based models for the two inland
Choctawhatchee stands (EOS, GIN) were substantially
weaker. Latewood-based regression models were
generally characterized by lower explanatory power than
total ring width and earlywood-based models.
Choctawhatchee sand pine stands exhibited higher
adjusted-R
2
values in latewood-based models (0.363–
0.446) than Ocala sand pine stands (0.263–0.342).
The rankings of standardized regression coefficients
within the various models reveal that a precipitation
Climate/growth relations of sand pine 345
Table VI(continued onnext page). Summary of regression analyses for each combination of site and series type,based onthe periodof
common record (1940–1993) among allsites. Significance levels of overall F-statistic and individual regression coefficientsis indicated
as: * p < 0.05, ** p < 0.01, *** p < 0.001.
Overall
F-statistic R
2
Adjusted
R
2
Climatic
variable
§
Standard regression
coefficient
Tolerance
Choctawhatchee sand pine:
EOS:
Total ring 13.97*** 0.456 0.423 ΣMARMAYP
AUGT
FEBT
0.437***
–0.376***
0.351**
0.999
0.997
0.998
Earlywood 13.02*** 0.338 0.312 ΣMARMAYP
AUGT
0.499***
–0.282*
1.000
1.000
Latewood 19.29*** 0.431 0.408 AUGT
FEBT
–0.493***
0.453***
0.998
0.998
GIN:
Total ring 6.38** 0.200 0.169 ΣMAYJULP
FEBT
0.360**
0.269*
1.000
1.000
Earlywood 4.50* 0.150 0.117 ΣMAYJULP
FEBT
0.279*
0.272*
1.000
1.000
Latewood 16.11*** 0.387 0.363 ΣJULSEPP
ΣAPRJUNP
0.516***
0.337**
1.000
1.000
STJ:
Total ring 22.35*** 0.573 0.547 ΣJANMAYP
MAYT
ΣJULSEPP
0.633***
0.208*
0.193*
0.961
0.951
0.949
Earlywood 28.88*** 0.531 0.513 ΣJANMAYP
MAYT
0.666***
0.212*
0.978
0.978
Latewood 22.37*** 0.467 0.446 ΣJANMAYP
ΣJULSEPP
0.516***
0.375***
0.976
0.976
variable was theprimaryvariable in 17 of18models. The
EOS latewood model was the exception; it lacked a pre-
cipitation variable. This reinforces findings from
bivariate correlationandextreme growth analyses,which
highlight the primacy of precipitation over temperature
in models of sand pine growth responses in most circum-
stances. All precipitation variables in all regression mod-
els were positively related to sand pine growth. The
seasonality of these precipitation regressors varied geo-
graphically. For Ocala sand pine, sums of precipitation
for the January–May or January–June period appeared in
all nine models, and were the primary variable in seven
of nine. For Choctawhatchee sand pine, the seasonal tim-
ing of primary precipitation variables drifts from Janu-
ary–May for the coastal STJ stand, to March–May for
EOS, to May–July for earlywood and total ring width se-
ries in GIN, to July–September in the GIN latewood
width series.
Although temperature variables playa secondary role,
they are included in 13 ofthe18regression models. Tem-
perature variables were primary only in EOS latewood.
The seasonality of temperature influences varied be-
tween varieties. For Choctawhatchee sand pine, monthly
temperatures from February and May of the current year
were positively related to growth, whereas August tem-
peratures were negatively related to growth. For Ocala
sand pine, five of the six models in the two inland stands
346 A.J. Parker et al.
Overall
F-statistic R
2
Adjusted
R
2
Climatic
variable
§
Standard regression
coefficient
Tolerance
Ocala sand pine:
HHO:
Total ring 17.07*** 0.401 0.378 ΣJANMAYP
JUN(–1)T
0.517***
0.273*
0.955
0.955
Earlywood 19.21*** 0.430 0.407 ΣJANMAYP
JUN(–1)T
0.504***
0.326**
0.955
0.955
Latewood 10.20*** 0.380 0.342 SEPP
ΣJANMAYP
ΣAPRJUN(–1)T
0.404**
0.258*
0.253*
0.933
0.953
0.974
JDO:
Total ring 49.82*** 0.489 0.480 ΣJANJUNP 0.700***
Earlywood 51.38*** 0.497 0.487 ΣJANJUNP 0.705***
Latewood 13.23*** 0.342 0.316 ΣJANJUNP
NOVT
0.409***
0.345**
0.961
0.961
RSO:
Total ring 16.08*** 0.491 0.460 ΣJANMAYP
ΣJULSEPP
ΣAPRJUN(–1)T
0.510***
0.337**
0.251*
0.990
0.950
0.943
Earlywood 15.33*** 0.479 0.448 ΣJANMAYP
ΣAPRJUN(–1)T
ΣJULSEPP
0.521***
0.279*
0.273*
0.990
0.943
0.950
Latewood 10.43*** 0.290 0.263 ΣJULSEPP
ΣJANMAYP
0.399**
0.369**
1.000
1.000
§
Variable-naming protocol: Months are designated by three-letter abbreviations (e.g., MAR = March; SEP = September). If the variable is lagged from the
previous year, a(–1) follows themonthly abbreviation (e.g.,NOV(–1)= November ofthe prior year).P or Tat the endof the variablename indicates precipi-
tation or temperature, respectively. Σ followed by two month designators indicates that the variable is the sum of these and all intervening months (e.g.,
ΣJANJUN = sum of January through June).
Table VI (continued).
(HHO, RSO) incorporated positive responses of growth
to lagged temperatures from the spring (April–June) of
the prior growing season. JDO, the coastal Ocala stand
(and also the southernmost locale in the study) exhibited
a positive growth response to November temperatures of
the current growing season in the latewood model.
Multiple regression outcomes from the period of com-
mon record underscored the strong linkage of earlywood
growth to early/mid-season precipitation variables,
which were primary variables in all earlywood models
from across the entire range of sand pine. Not surpris-
ingly, late-season temperature (August–November) and
precipitation (July–September) figured more promi-
nently in latewood regression models.
3.5. Relationship of sand pine growth to ENSO
phase
Earlywood width series showed significant differ-
ences in growth between warm-phase and cold-phase
ENSO years inall three Ocala sand pinestands, as well as
in STJ (table VII). As expected, warm-phase conditions,
which are associated with increased winter precipitation
over Florida, fostered more rapid sand pine growth. The
two inland Choctawhatcheesand pine stands (EOS, GIN)
exhibited no relationship of growth to ENSO phase, in
keeping with their muted response to precipitation vari-
ability in regression models. Unlike the earlywood width
series, latewood widths showed no significant growth re-
lationship to ENSO phase. (Predictably, the response of
the total ring width series was similar to earlywood, but
was somewhat muted by inclusion of the latewood incre-
ment.)
4. DISCUSSION AND CONCLUSIONS
Given the tolerance of sand pine for dry, low nutrient
substrates, its growth response to precipitation variabil-
ity is logical. Precipitation totals in the period just prior
to (JanuaryandFebruary) and intheearly/middle parts of
the growing season (March through June) consistently
emerged as strong influences on growth across the spe-
cies range. Temperature variability was a secondary in-
fluence on sand pine growth in some areas; it was most
prominently expressed in inland Choctawhatchee sand
pine stands (EOS, GIN). The Florida panhandle experi-
ences the highest frequency of freeze events of any re-
gion within the species’ range. These findings supported
our first research hypothesis: overall, precipitation is
more strongly linked to sand pine growth patterns than is
temperature. Nevertheless, ourresultsunderscore the im-
portance of spatial variability in climatic controls of tree
growth across a species range.
Radial growth patterns of other southern pine species
have been linked to precipitation variability elsewhere in
the American Southeast ([34] for slash pine (Pinus
elliottii), [3] for loblolly pine (Pinus taeda), [6] for long-
leaf pine (Pinus palustris)). However, thesestudiesidenti-
fied growth responses to summer or annual precipitation
measures and werebasedon samples from restricted geo-
graphic areas. Our range-wide sampling is unique among
tree-ring basedclimate/growthstudies of southernpines.
The strong association of sand pine growth with
interannual variability of winter/spring precipitation in
four stands (the three Ocala sand pine stands plus STJ)
conformed with the ENSO/growth findings. In the same
four stands, earlywood growth increments were signifi-
cantly greater in warm-phase ENSO years, years charac-
terized by increased winter precipitation over Florida.
Hence, our second research hypothesis was supported:
sand pine growth series are sensitive indicators of ENSO
phase. This finding extends previous evidence of ENSO
effects on biophysical phenomena in the southeastern
United States. Simard et al. [24] and Brenner [1] found
greater wildfire activity indrier,cold-phase ENSO years.
Hansen et al. [12, 13] found links between agricultural
productivity and ENSO phase; winter vegetable yields in
Florida declined in warm-phase ENSO years, which the
Climate/growth relations of sand pine 347
Table VII. Difference-of-means test results for earlywood
growth index values compared between warm-phase and cold-
phase ENSO years. Tests confirmed equality of variance be-
tween the two groups of years in each stand. * p < 0.05,
** p < 0.01, *** p < 0.001.
Mean ± st. dev. of growth index value
Site Cold phase Warm phase Student’s t
Choctawhatchee sand pine:
EOS –0.082 ± 0.931 –0.064 ± 0.997 0.058
GIN –0.451 ± 0.863 –0.025 ± 1.036 1.321
STJ –0.360 ± 0.952 –0.311 ± 0.830 2.527 *
Ocala sand pine:
HHO –0.623 ± 0.565 –0.499 ± 0.784 4.130 ***
JDO –0.255 ± 0.913 –0.503 ± 0.970 2.091 *
RSO –0.270 ± 0.625 –0.412 ± 0.857 2.341 *
authors attributed to increased rainfall, reduced daily
maximum temperatures, and reduced solar radiation in
these years. We suspect that dendroclimatic reconstruc-
tions for otherpines and upland hardwoodspeciesin pen-
insular Florida would reveal links to ENSO phase similar
to those we reported, although sand pine may be espe-
cially sensitive to precipitation, because it occupies un-
usually dry and nutrient-poor sites, relative to most other
tree species in Florida.
For the majority of stands, climate/growth relations
were most strongly expressed in total ring width series.
Climate/growth relationships were stronger in the early-
wood than latewood series of the three Ocala sand pine
stand and STJ. In contrast, latewood-based regressions
displayed stronger climatic links in the two interior
Choctawhatchee sand pine stands (EOS, GIN). As noted
above, these were the two stands in which temperature
was most often included as a primary variable in our re-
gression models. Our findings reinforce the importance
of examining all components of radial growth in
dendroclimatic reconstructions. Just as there can be
prominent spatial variability in climatic controls across a
species range, there also can be pronounced spatial vari-
ability in the climatic sensitivity of earlywood vs. late-
wood increments across a species range.
Each sand pine variety exhibited a distinctive histori-
cal pattern of growth, with low inter-varietal correlations
among ring series, for the most part. Analysis of extreme
growth years reinforced these varietal contrasts; some
extreme growth years were only recorded in one of the
two varieties. This suggests that, while broader circula-
tion patterns (such as those related to ENSO
teleconnections) affect the climate of Florida, sub-re-
gional spatial variability in the expression of drought or
excess rains can be expected in some years.
Climate/growth regressions from Ocala sand pine
stands were uniformly stronginexplanatory power. Each
of these stands is characterized by a narrowly even-aged
structure, so that all stems are generally responsive to the
same climatically mediated growth rhythms. Like Ocala
sand pine, the coastal Choctawhatchee sand pine stand
(STJ) showed strong climatic linkages to growth, pre-
sumably because of the greater physiological stress im-
posed in this stand situated on recently active dunes and
lacking a clay-rich layer at depth (which, if present,
would elevate subsurface water supply). By contrast, the
two inland Choctawhatcheesand pine stands (EOS, GIN)
produced the weakest climate/growth relations. Stand-
scale biotic effectsmayaccount for some reduction in the
strength of climate/growth signal in these stands. On-go-
ing sand pine recruitment maintained by wind-induced,
gap-phase regeneration in these stands appears to
weaken the climatic signal in radial growth records, pre-
sumably due to canopy effects on understory growth. In
combination with regional contrasts in winter tempera-
ture regime, these biotic effects cause distinctive
climate/growth relations to emerge for inland
Choctawhatchee sand pine stands. Because of the wide
variance in climate/growth explanatory power between
the inland and coastal Choctawhatchee sand pine stands,
we conclude that our third research hypothesis was not
supported: we found no consistent varietal differences in
the strength of climate/growth relationships.
In general, we found that climate/growth relations
were well expressed, even when cores were extracted
from all trees in a stand. We screened cores that did not
crossdate well with the remainderofcores within a stand,
but this eliminated less than 25% of trees, even in
Choctawhatchee sand pine stands characterized by
strong canopy/understory influences. In dendroclimatic
reconstructions, it may not be necessary to impose a sys-
tematic bias in tree selectiontoenhanceexpression of the
climatic signal in a master chronology, at least where site
factors ensure some degree of physiological stress. Sam-
pling all possible trees in a stand reduces the likelihood
that important climatic signals will be missed in chronol-
ogy development.
Coastal stands of both sand pine varieties were char-
acterized by reduced growth rates, as their stunted physi-
ognomy suggested. Climate/growth regressions in STJ
(coastal Choctawhatchee sand pine) generated the high-
est explanatory power, irrespective of series type, among
all six stands. JDO (coastal Ocala sand pine) was second
in climatic explanatory power for the total ring and early-
wood width series. In both stands, winter/spring precipi-
tation variables were strongly related to variation in
radial growth patterns. Collectively, these results sup-
ported our fourthresearchhypothesis: climate/growth re-
lationships are more strongly expressed in coastal
populations than inland populations of sand pine. In fu-
ture efforts to establish ENSO-based links with produc-
tivity of natural vegetation in Florida, coastal strand
environments should receive high priority, because their
substrates magnify the consequences of interannual vari-
ation in winter season precipitation.
Acknowledgements: The authors gratefully ac-
knowledge Matt Beaty, David Conway, Julie Evans and
Deanna McCay for field assistance in data collection; the
following land management personnel for siteaccessand
logistical support: Dana Bryan, Beth Morford, Dick
348 A.J. Parker et al.
Roberts, and Parks Small of the Florida State Park sys-
tem; Scott Hassell, Rick McWhite, Carl Petrick and
Steve Seiber of Jackson Guard, Eglin Air Force Base;
Riley Hoggard of the National Park Service. This re-
search was supported by National Science Foundation
grant SBR-9313704 to KCP and AJP.
REFERENCES
[1] Brenner J., Southern Oscillation anomalies and their re-
lation to Florida wildfires, Fire Manage. Notes 52 (1991)
28–32.
[2] Center for Ocean-Atmospheric Prediction Studies.ENSO
index according to JMA SSTA (1968-present), URL:
last upda-
ted 24 April 1998.
[3] ChangM., AnguilarJ.R., Effects of climate andsoil onthe
radial growth of loblolly pine (Pinus taeda L.) in a humid envi-
ronment of Southeastern USA, For. Ecol. Manage. 3 (1980)
141–150.
[4] Chen E., Gerber J.F., Climate, in: Myer R.L., Ewel J.J.
(Eds.), Ecosystems of Florida, University of Central Florida
Press, Orlando, 1990, pp. 11–34.
[5] Conway D.W., Parker A.J., Parker K.C., Understory light
regime, shrub layer and sand pine (Pinus clausa) regeneration in
four scrub stands, Am. Midl. Nat. 138 (1997) 84–96.
[6] Devall M.S., Grender J.M., Koretz J., Dendroecological
analysis of a longleaf pine(Pinus palustris) forestin Mississippi,
Vegetatio 93 (1991) 1–8.
[7] Douglas A.V., Englehart P.J., On a statistical relationship
between autumnrainfall inthe centralequatorial Pacific and sub-
sequent winter precipitation in Florida, Mon. Weather Rev. 109
(1981) 2377–2382.
[8] EttlG. J., Peterson D. L.,Growth responseof subalpine fir
(Abies lasiocarpa) to climate in the Olympic Mountains, Was-
hington, USA, Glob. Change Biol. 1 (1995) 213–230.
[9] Evans J.K., Parker A.J., Parker K.C., Leigh D.S., Edaphic
properties and foliar elemental concentrations from sand pine
(Pinus clausa) populations throughout Florida, Phys. Geogr. 17
(1996) 219–241.
[10] Graumlich L.J., A 1000-year record of temperature and
precipitation in the Sierra Nevada, Quat. Res. 39 (1993)
249–255.
[11] Grissino-Mayer H., Holmes R., Fritts H.C., The Interna-
tional Tree-ring Data Bank Program Library, Version 2.0 User’s
Manual, Laboratory of Tree-ring Research, University of Arizo-
na, Tucson, 1996.
[12] Hansen J.W., Hodges A.W., Jones J.W., ENSO influen-
ces on agriculture in the Southeastern United States, J. Clim. 11
(1998) 404–411.
[13] Hansen J.W., Jones J.W., Kiker C.F., Hodges A.W., El
Niño Southern Oscillation impacts on winter vegetable produc-
tion in Florida, J. Clim. 12 (1999) 92–102.
[14] Henderson K.G., Vega A.J., Regional precipitation va-
riability in the Southern United States, Phys. Geogr. 17 (1996)
93–112.
[15] Holmes R.L., Computer-assisted quality control in
tree-ring dating and measurement, Tree-ring Bull. 43 (1983)
69–75.
[16] Jacoby G.C., Cook E.R., Past temperature variations in-
ferred froma 400-yeartree-ring chronology from Yukon Territo-
ry, Canada, Arctic Alpine Res. 13 (1981) 409–418.
[17] LebourgeoisF., Climatic signalsin earlywood, latewood
and total ring width of Corsican pine from Western France, Ann.
For. Sci. 57 (2000) 155–164.
[18] Little E. L., Jr., Dorman K.W., Geographic differences
in cone-opening in sand pine, J. For. 50 (1952) 204–205.
[19] Myers R.L., Scrub and high pine, in: Myers R.L., Ewel
J.J. (Eds.), Ecosystems of Florida, University of Central Florida
Press, Orlando, 1990, pp. 150–193.
[20] National Climatic Data Center, Climatic resources,
URL: />last updated 24 July 2000.
[21] Parker A.J., Parker K.C., McCay D.M., Disturbance-
mediated variation in stand structure between varieties of Pi-
nus clausa (sand pine), Ann. Assoc. Am. Geogr. 91 (2001)
28–47.
[22] RopelewskiC.F., HalpertM.S., NorthAmerican precipi-
tation and temperature patterns associated with the El Niño/Sou-
thern Oscillation (ENSO), Mon. Weather Rev. 114 (1986)
2352–2362.
[23] Schulman E., Longevity under adversity in conifers,
Science 119 (1954) 396–399.
[24] Simard A.J., Haines D.A., Main W.A., Relation bet-
ween ElNiño/Southern Oscillation anomaliesand wildlandfire
activity in the United States, Agric. For. Meteorol. 36 (1985)
93–104.
[25] Southeast Regional Climate Center, Climate Interaction
Rapid RetrievalUsers System, URL: />/climate/sercc/cirrushome.html, last updated 3 August 2000.
[26] Splechtna B.E., Dobry J., Klinka K., Tree-ring characte-
ristics of subalpine fir (Abies lasiocarpa (Hook.) Nutt.) in rela-
tion to elevation and climatic fluctuations, Ann. For. Sci. 57
(2000) 89–100.
[27] Stahle D.W., Chaney P.L., A predictive model for the lo-
cation of ancient forests, Nat. Areas J. 14 (1994) 151–158.
[28] Stahle D.W., Cleaveland M.K., Tree-ring reconstructed
rainfall over the Southeastern USA during the Medieval Warm
Period and Little Ice Age, Clim. Change 26 (1994) 199–212.
[29] Standley L.J. Climate, lightning,and wildfire in the na-
tional forests of the American South: 1989–1998. M.S. Thesis,
Department of Geography, University of Georgia, Athens,
2000.
Climate/growth relations of sand pine 349
[30] Stokes M.A., Smiley T.L., An introduction to tree-ring
dating. University of Chicago Press, Chicago, Illinois, 1968.
[31] Veblen T.T., Regeneration dynamics, in: Glenn-Le-
win D.C., Peet R.K., Veblen T.T. (Eds.), Plant succession:
Theory and prediction, Chapman & Hall, London, 1992,
pp. 152–187.
[32] Ward D.B., Contributions to the flora of Florida–2, Pi-
nus (Pinaceae), Castanea 28 (1963) 1–10.
[33] Wiles G.C., D’Arrigo R.D., Jacoby G.C., Temperature
changes along the Gulf of Alaska and Pacific Northwest coast
modelled from coastal tree rings, Can. J. For. Res. 26 (1996)
474–481.
[34] Young Jr. C.E., Brendemuehl R.H., Response of slash
pine to drainage and rainfall, U.S.D.A., Forest Service, Sou-
theastern Forest Experiment Station, Research Note SE-186,
1973.
To access this journal online:
www.edpsciences.org
350 A.J. Parker et al.