Báo cáo khoa học: "mproving models of wood density by including genetic effects: A case study in Douglas-fir" potx
Bạn đang xem bản rút gọn của tài liệu. Xem và tải ngay bản đầy đủ của tài liệu tại đây (166.83 KB, 10 trang )
Original article
Improving models of wood density by including
genetic effects: A case study in Douglas-fir
Philippe Rozenberg
*
, Alain Franc, Catherine Bastien and Christine Cahalan
INRA Centre de Recherches d'Orléans, Avenue de la Pomme de Pin, BP 20169, Ardon, 45166 Olivet Cedex, France
(Received 6 March 2000; accepted 4 January 2001)
Abstract – Many models have been published for relating wood characteristics, such as wood density, to growth traits. At a tree popula-
tion level, ring density is known to be significantly correlated with cambial age and ring width. However, at the individual tree level, the
predictive value of models based on this relationship is usually poor, as there is an important, so-called “tree effect” in the residuals of
such models. We hypothesise that this effect arises from within population genetic variability, and have tested this hypothesis by adjus-
ting linear models for Douglas-fir populations with different levels of genetic variability, ranging from provenances to clones. The addi-
tion of a genetic effect significantly increased the predictive value of the model and decreased the residuals. At the clone level, for
example, inclusion of the genetic effect increased the explained variance (adjusted R
2
value) from 20% to 54%. It is suggested that most
of the observed variability in the wood density/growth relationship of Douglas-fir populations has a genetic origin.
genetics / model / wood density / ring width / cambial age / Douglas-fir
Résumé – Amélioration de modèles de densité du bois par l’introduction d’effets génétiques : une étude de cas chez le Douglas.
De nombreux modèles ont été publiés, mettant en relation chez de nombreuses espèces des propriétés du bois avec des caractères de
croissance. À l’échelle de la population d’arbres, on sait que la densité d’un cerne dépend significativement de sa largeur et de son âge
cambial. Toutefois, la valeur prédictive de ce type de relation est généralement faible, à cause de l’existence d’un fort effet « arbre » sur
les résidus du modèle. Nous proposons l’hypothèse que cet effet arbre est lié à l’existence d’une variabilité génétique intra-population.
Nous avons testé cette hypothèse en ajustant un modèle linéaire à plusieurs populations de douglas structurées génétiquement, selon des
niveaux génétiques différents variantdelaprovenanceau clone. L’ajout d’unparamètre génétique au modèle permet d’augmenter signi-
ficativement la qualité prédictive du modèle, et diminue les résidus. Au niveau clone, par exemple, la variance expliquée par le modèle
passe de 20 à 54 %. Nous en déduisons que la plus grande partie de la variabilité observée pour la relation densité-croissance chez le
Douglas est d’origine génétique.
génétique / modèle / densité du bois / largeur de cerne / age cambial / Douglas
Ann. For. Sci. 58 (2001) 385–394
385
© INRA, EDP Sciences, 2001
* Correspondence and reprints
Tel. (33) 02 38 41 78 00; Fax. (33) 02 38 41 48 09; e-mail:
1. INTRODUCTION
Foresters have been interested for several decades in
quantifying the growth properties of trees, and this has
resulted in the production of numerous growth models
[37]. More recently, foresters have also become inter-
ested in the properties of wood, as similar volumes of
wood can have very different values depending on their
suitability for particular end products [21, 45]. This qual-
itative variation is difficult to define, as it depends
mainly on the potential uses of the wood. Wood quality
therefore cannot be measured routinely in the field in the
way that wood quantity can be measured using estab-
lished protocols [20].
Of the wood properties which affect utilisation, wood
density is the most widely studied. It is generally consid-
ered to be “a good indicator of strength properties; it has
often been strongly related to the general quality of wood
and is frequently correlated with pulp yield” [8]. There
are therefore good reasons for using wood density as an
indicator of wood quality for various end uses [31, 45].
A negative relationship between radial growth and
wood density has been widely reported. The strength of
the relationship is very variable among softwood species;
it is very strong for spruces (Picea spp.) and especially
Norway spruce (Picea abies) (see [31, 46], and appar-
ently very weak for some pine (Pinus) species[46].Some
evidence of intraspecific genetic variation in the relation-
ship between growth and wood density has been pre-
sented by different authors. Lewark [22] proposed the
selection of Norway spruce clones in which “the regres-
sion of the two traits [density and growth] is as low as
possible“. Mothe [24], also working on Norway spruce,
found substantial differences (from –0.21 to –0.93) in the
correlation coefficient for the growth rate – wood density
relationship between genetic units. In the same species,
Chantre and Gouma [4] found a strong clonal effect onthe
residuals of the model linking growth rate and wood den-
sity. In black spruce, “ the relationship of wood density
with growth rate, to some extent, may vary with genotype
and environment, and silvicultural manipulations may
modify the relationships” [44]. Finally, according to
Rozenberg and van de Sype [30], the values of parame-
ters of models describing the growth rate – wood density
relationship can be used as secondary selection traits, af-
ter primary selection for wood density, to restrain the
negative impact of growth rate on wood density.
In Douglas-fir (Pseudotsuga menziesii), the density –
growth relationship is variable. Some authors have re-
ported that there is no relationship [1], while others have
found negative relationships ranging from moderate to
quite strong [2, 19, 23, 33, 38, 40]. These results suggest
that the relationship between wood density and growth
may be specific to individual populations, and that there
may be intra-specific genetic variation in this relation-
ship.
For some species, statistical models have been de-
signed to explain variation in wood density at the level of
the individual growth ring by using ring width, cambial
age and other variables (e.g. [10, 43]. In these studies, the
population used to construct the statistical models corre-
sponds biologically to a population of rings. Usually, the
underlying structure of the sample has not been taken
into account when validating and considering the explan-
atory power of the models. Hence, although most of these
models give a very significant F value, demonstrating
that the explanatory variables have an effect on density,
they have little predictive value at the ring level. In other
words, the model may give a very good fit at the ring pop-
ulation level, but a poor fit at the level of the individual
ring.
Some authors have tried to improve the predictive
power of models by including a variable called “tree
level” [6, 10, 11, 15]. Many wood properties show con-
siderable variability at the individual tree level, and there
are two (not mutually exclusive) possible reasons for
this: either wood properties are genetically inherited, or
their expression depends on environmental factors. We
do not pretend here to solve the classical problem of dis-
tinguishing between environmental response and
heritability for a phenotypic trait displaying high vari-
ability at the individual tree level. We are aware this
would require a better understanding of the loci involved
in the control of a trait and the interactions between them,
and that this understanding is not likely to be reached in
the near future. However, it should be noted that one
problem with using the variable “tree level” in models is
that it does not allow the effects of genetic control and
environmental response to be separated. A model fitted
on a given tree, with parameters fitted for every tree, has
a far higher predictive value.
The objective of the paper presented here is to take the
genetic structure of samples explicitly into account in or-
der to improve the predictive value of the model at the in-
dividual ring level. By genetic structure, we mean the
relatedness between trees within a sampling unit. We
used genetically structured material to investigate
whether a given level of genetic characterisation (prove-
nance, half-sib progeny, clone) can be used to increase
the precision of models explaining variation in wood
density.
386 P. Rozenberg et al.
2. MATERIAL
2.1. Plant material
Three types of genetic entries were used: prove-
nances, half-sib progenies and clones.
The level of genetic characterisation for provenance is
that all trees are grown from seed collected in the same
geographic region, but are not explicitly related to each
other. The material came from a provenance test on a site
in Limousin (West Massif Central, France), in one of the
best regions in France for growing Douglas-fir. The
provenance test was planted in 1965. The 25 provenances
in the test were commercial seedlots collected in the nat-
ural range of Douglas-fir, from Vancouver Island to
northern Oregon and from the Pacific coast to the west-
ern side of the Cascades range. Four provenances
(Skykomish, Santiam, Humptulips and Granite Falls)
were chosen to represent the patterns of height growth
seen in the test. Santiam was the slowest and Humptulips
the fastest growing provenance. Skykomish was interme-
diate, with a very stable ranking over time. Granite Falls
was fast growing until age 15–20, but was then overtaken
by other provenances, including Humptulips [29]. In
January 1995, when trees were 33 years old from seed,
100 trees (25 of each provenance) were felled, and a
10-cm-thick disk was taken at 2.5 m from each felled
stem, between the first and the second log cut for com-
mercial sale. Some trees or wood samples were excluded
for methodological reasons, and the final sample was:
Skykomish: 24 trees; Santiam: 23 trees; Humptulips:
24 trees; Granite Falls: 22 trees (a total of 93 trees).
The level of genetic characterisation for half-sib prog-
eny is that all trees have the same female parent, but un-
known male parents from the same provenance (in the
case of open-pollinated progeny the number of possible
male parents may be high). The material came from prog-
eny tests growing at three test sites: Epinal (North-East-
ern France, foothill of Vosges mountains), Faux-la-
Montagne (West-Central France, Limousin) and St
Girons (south of France, foothill of Pyrénées mountains).
The tests were planted in 1978. The 125 progenies in
tests came from 24 French provenances, but the origin in
the Douglas-fir natural range of the different prove-
nances is unfortunately not known. Thirty progenies
were selected for height and DBH growth, time of bud-
burst, branching angle and depth of pilodyn pin penetra-
tion (pilodyn is a non-destructive tool for indirect
assessment of wood density, see for example [30]. The
objective of the selection was to sample the complete
range of variation for all these traits. The 30 selected
families came from 13 different provenances. Ten living
trees were randomly sampled within each family and test
site (10 trees × 30 families × 3 sites). One increment core
was collected at breast height (1.3 m) from each tree dur-
ing 1994, when trees were 16 years old. Some trees or
samples were excluded at different stages of the sam-
pling, and the final number of samples was 777.
The level of genetic characterisation for clones is that
all tree are genetically identical. The material came from
a clonal test growing at a site in the forest district of
Kattenbuehl, Lower Saxony, Germany. The clones were
selected from seedlings grown at Escherode (Germany)
from a large seed collection made in Canada (British Co-
lumbia) and the USA (Washington and Oregon, west of
the Cascade range). The test was planted in 1978, using
rooted cuttings from the best seedlings of the best prove-
nances (selection based on survival and growth). After
selection of the best 20% clones in 1992, a thinning was
conducted of the 80% clones not selected as superior.
During the winter of 1997–1998, 50 clones were selected
in the clonal test with the objective of maximising the
variation in DBH and depth of pilodyn pin penetration
within the selection. Such a sampling procedure is likely
to over-estimate the genetic variation in wood properties
related to density. In March 1998, when trees were
24 years old, one radial increment core was collected at
breast height (1.3 m) from 179 trees (see table I).
2.2 Data collection
One radial X-ray density profile was obtained from
each sample (disks for the provenances, increment cores
for the half-sib progenies and clones), following the indi-
rect method described by Polge [26]. Each disk or incre-
ment core was sawn to 2.40 mm (±0.02 mm)-thick. The
indirect method measures the attenuation of a very thin
(250 × 24 microns in this case) light ray crossing the X-
ray picture of a wood sample.
Wood density models and genetic effects 387
Table I. Number of tree per clone.
Number of clones Number of tree per clone
28 3
15 4
75
3. METHOD OF DATA ANALYSIS
Density profiles were separated into rings, using func-
tions developed under Splus statistical software [36].
Then, for each ring, three parameters were computed:
– ring width (width);
– ring density (density);
– ring cambial age (age).
Each ring can be identified chronologically by two pa-
rameters: the ring number from pith to bark (cambial age
at time of ring formation); or the calendar year in which
the ring was formed (determined by counting from bark
to pith). There is not a perfect correspondence over all
trees between the two traits due to variation in the rate of
height growth. Models usually predict ring characteris-
tics using cambial age rather than calendar year [15].
In total, data were collected from 11 028 rings of
1 036 trees sampled from 84 genetic entries growing at
five test sites.
Data available
For all genetic structures (provenance, half-sib prog-
eny and clone), the following variables were available
and used for explaining ring density (D): ring width (W),
ring cambial age (CA) and genetic identity (provenance
P, family F, clone C). In one case (half-sib progeny), an
additional geographical variable was added, as samples
came from three test sites in three different regions of
France.
Data analysis
The general relationship used in all models of this
kind is D = f (W, CA).
In this study, we decided to restrain ourselves to linear
models, using covariance analysis. We compared nested
models of type (1) and (2), as shown in the appendix,
with one set of models for provenances, one set of models
for half-sib progenies and one set of models for clones.
We compared models using the F ratio, defined as
F
RSS RSS
df df
RSS
df
=
−
−
12
12
2
2
where RSS
1
and RSS
2
are respectively the residual sums
of squares of models 1 and 2, and df
1
and df
2
are respec-
tively the degrees of freedom of models 1 and 2. If the
probability value associated with F is less than or equal
to 0.05, then the models 1 and 2 are significantly differ-
ent. When models were significantly different, adjusted
R
2
values were computed and compared.
This method does not always provide a straightfor-
ward comparison between two models. A genetic effect
may affect the significance level of a model in at least
two ways: either as a main factor, as in analysis of vari-
ance (ANOVA), or within an interaction term when asso-
ciated with another cofactor, such as ring width or
cambial age. We tested the effect of each of these possi-
bilities with the same tool of F ratio.
Analyses of variance were conducted using the aov
(analysis of variance) procedure of Splus (Type I sum of
squares in the notation of SAS GLM). The ring width (W)
co-variable was transformed in order to linearise the ring
density – ring width relationship. The chosen transfor-
mation was W
0.5
. In all three cases, model 1 is the most
complete model not including the genetic factor, and
model 2 the most complete model including the genetic
factor. Factors were introduced step by step from
model 1 to model 2 in the following order:
1) ring width;
2) cambial age;
3) site when relevant (progeny test);
4) provenance, half-sib family or clone, that is, the rele-
vant genetic factor;
5) then the respective interactions, following the same
order.
Residuals plots and other plots were drawn to check the
validity of the linear model assumptions. Coefficients of
covariables and of interactions with genetic entries were
estimated using Splus functions [36].
4. RESULTS
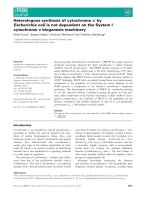
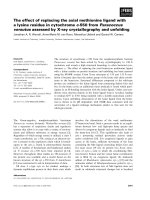
Figure 1 shows the range of the variation (mean val-
ues and confidence intervals) in density and ring width of
genetic entries at the three genetic levels (provenance,
half-sib progeny and clone). The between-genetic entry
variation is minimum at the provenance level, maximum
at the clone level and intermediate at the family level.
Tables II and III show that introduction of the genetic
entry always significantly improves the fit of the model.
This effect is greatest with the clonal material, where the
adjusted R
2
increases from 0.202 in model 1 to 0.539 in
model 2; in both cases the p value of the F ratio is less
than 10
–7
.
388 P. Rozenberg et al.
Wood density models and genetic effects 389
Figure 1. Mean values and corresponding confidence intervals at 95% for density (top) and ring width (bottom) of genetic entries at
three genetic levels. Genetic entries are arranged in order of mean value for the character of interest.
Table II. Model statistics (F ratio = F; degrees of freedom = df; probability value = p value; model adjusted R
2
) for each model and ge-
netic level.The increase ofadjusted–R
2
from model1 to model2 is moderatefor provenances andprogenies, and pronouncedfor clones.
Model 1 Model 1b Model 2
Variation explained by
linear model
Provenance Family Clone Provenance Family Clone Provenance Family Clone
F 763 1314 423.4 – 1748.8 – 999.3 3004.9 2088.6
p value <10
–7
<10
–7
<10
–7
– <10
–7
– <10
–7
<10
–7
<10
–7
Adjusted R
2
0.268 0.152 0.202 – 0.193 – 0.323 0.281 0.539
Table III.F-test for significance of differences between models. Improvement from model 1 to model 2 is always highly significant.
Significance between models 1 and 2 (p value)
Provenance <10
–6
Family <10
–6
Clone <10
–6
Tables IV to VI show the results of analysis of vari-
ance for model 2 at each genetic level. Most covariables,
factors and interactions were highly significant at all ge-
netic levels. The exceptions were the interaction between
ring width and provenance (table IV), and the interaction
between ring width and ring cambial age for provenances
(table IV) and clones (table VI).
5. DISCUSSION AND CONCLUSION
We have shown that in Douglas-fir the introduction of
information on the genetic relatedness between individ-
ual trees within samples significantly increases the accu-
racy of the prediction, at the ring level, of wood density
from cambial age and ring width. As relatedness in-
creases from provenance to clone, there is a parallel im-
provement in the fit of the models. This improvement is
especially marked from the half-sib progeny to the clone
level.
This is consistent with the evidence of genetic vari-
ability in wood density and ring width in Douglas-fir, as
reported by several authors [2, 7, 9, 14, 17, 38, 39, 41]. If
individual heritability is relatively high (0.5–0.7), the
amount of genetic variation is weak at the provenance
level (i.e. between provenances) [7], moderate within
provenances (between progenies) and even higher be-
tween individual trees (clones).
The increase in the fitting quality associated with the
most complete model is due not only to the main genetic
effect, but also to the interactions between the genetic
factor and both ring width and cambial age. The main ge-
netic effect is always stronger than all the interactions.
As reported elsewhere for Douglas-fir [2, 19, 23, 38], the
relationship between wood density and ring width is
moderately unfavourable. The significant interaction be-
tween the genetic factor and respectively ring width
(progenies and clones, tables V and VI) and cambial age
(provenances, progenies and clones, tables IV, V and VI)
suggests that there is genetic control of the general D =
f(W, CA) relationship.
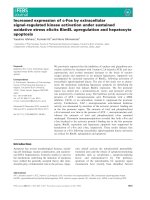
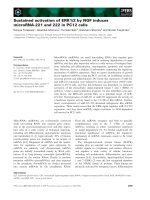
The distributions in figure 2 demonstrate that it is pos-
sible to find clones in which there is a positive relation-
ship between growth (ring width) and density; in these
clones, wood density increases as ring width increases.
For half-sib progenies, the narrower distribution does not
extend beyond zero. This is an illustration of the magni-
tude of improvement that can be reached at the half-sib
progeny and clone levels.
390 P. Rozenberg et al.
Table IV. Results of analysis of variance for the most complete
model (model 2) for provenances. DF is “degrees of freedom”,
F, is Fishers’s statistics and p-value is the probability associated
to F.
Source of variation Df F-test p value
Ring width W
0.5
1 792 <10
–7
Cambial age CA 1272× 10
–7
Provenance P 3 52 <10
–7
W
0.5
*CA 1 0.14 0.71
W
0.5
*P 3 1.9 0.12
CA*P 3 6.3 3 × 10
–4
Res 2 060
Table V. Results of analysis of variance for the most complete
model (model 2) for half-sib progenies. DF is “degrees of free-
dom”, F, is Fishers’s statistics and p-value is the probability as-
sociated to F.
Source of variation Df F-test p value
Ring width W
0.5
1 1461 <10
–7
Cambial age CA 1 51 <10
–7
Site S 2 118 <10
–7
Family F 29 20 <10
–7
W
0.5
*CA 1 45 <10
–7
W
0.5
*S 2 15 <10
–7
W
0.5
*F 29 3.3 <10
–7
CA*S 2 76 <10
–7
CA*F 29 2.1 7 × 10
–4
S*F 58 5.1 <10
–7
Res 7 143
Table VI. Results of analysis of variance for the most complete
model (model 2) for clones. DF is “degrees of freedom”, F,is
Fishers’s statistics and p-value is the probability associated
to F.
Source of variation Df F-test p value
Ring Width W
0.5
1 507 <10
–7
Cambial Age CA 1 226 <10
–7
Clone C 49 21 <10
–7
W
0.5
*CA 1 1.4 0.23
W
0.5
*C 49 2.8 <10
–7
CA*C 49 3.7 <10
–7
Res 1 506
Possible explanations for the genetic variability in the
D = f(W) relationship may be proposed. Strengthening
and testing this hypothesis will require further and more
detailed anatomical studies. Increased growth (ring
width) might result from an increase in the size (diame-
ter) of a constant number of cells of constant wall thick-
ness. In this case a negative correlation between ring
width and density is expected. It is well known that ana-
tomical characteristics such as tracheid diameter and lu-
men diameter are under strong genetic control [16, 25,
34, 46]. However, if cell wall thickness increases in par-
allel with cell diameter, there may be no relationship be-
tween growth and density. In Douglas-fir, there may be
variation in the genetic control of important anatomical
properties such as cell wall thickness. It should be possi-
ble to detect such variation by examining the relationship
between ring width and each anatomical property in dif-
ferent genetic entries.
Wood density models and genetic effects 391
Figure 2. Distributions of the density – ring
width and density – cambial age regression co-
efficients for half-sib progenies and clones.
The vertical line is the location of the mean. At
the progeny level, all interaction coefficients
are negative, whilethere are some positive val-
ues at clone level.
Similar studies should also be done for the relation-
ship D = f(CA), since the interaction between ring width
and cambial age is significant. It has been suggested [18]
that there may be differential expression in the juvenile
and mature phases of genes responsible for the produc-
tion of wood. Another possibility arises from the fact that
the micro-environments of a young and a mature
Douglas-fir are very different. If the expression of some
genes is under environmental control, then a change in
the environment may lead to the expression of different
genes and a shift in phenotype. It seems probable that the
genetic control of the relationship D = f(CA) is a conse-
quence of both processes.
Such changes over time in the control of wood forma-
tion may explain why many authors have found only low
or moderate age-age phenotypic correlations for wood
properties when the older trees are close to rotation age
[3, 13, 14, 39]. There are fewer reports of age-age genetic
correlations, but they seem to be higher than phenotypic
correlations [13, 42]. This observation supports the the-
ory that major differences between the environments of
young and adult trees are responsible for the low
phenotypic correlations.
A direct consequence of our results is that models pre-
dicting wood properties can be significantly improved if
the genetic structure of the population is known and can
be included in the model. Indeed, most of existing mod-
els are well fitted at the population level, and are suitable
for purposes such as regional resource assessment [6, 10,
11, 15, 21], whereas their predictive value for a given tree
is low. This problem is generally circumvented byadding
a so-called tree effect [6, 10, 11, 15], but without specify-
ing its biological meaning. We demonstrate that this tree
effect is a mixture of environmental response and hered-
ity. The increase in explanatory power of models result-
ing form the inclusion of genetic effects has been
quantified in our results. The magnitude of the improve-
ment depends on level of genetic chacterisation (mini-
mum for provenances, maximum for clones) and, almost
certainly, on the species. Improvement should be consid-
erable for species, such as pines, with a poor phenotypic
relationship at the individual tree level between growth
rate and wood density [5, 28, 35, 46]. It should be less
marked for species, such as Norway spruce, in which the
phenotypic relationship between growth rate and wood
density is strong at the individual tree level [31, 46]. Im-
provement should be intermediate for species, such as
Douglas-fir, with a variable relationship between growth
and density.
When the genetic structure of the sample is not
known, the variable “tree” does not allow the genetic
control and environmental response to be distinguished.
In the case of provenances and progenies, there is some
genetic variability between and within genetic entries. In
this case, the variable “tree” will include a fraction of the
within-entry genetic variability. In the case of clones, all
trees within a given clone are genetically identical, and
all the within-clone differences accounted for by the
“tree” variable are the result of micro-environmental
variation. The methods described in this article can be
used to estimate the amplitude of the tree effect, and to
compare it with other effects, especially that due to
clone. Such a study is in progress and the results will be
presented in another article.
Acknowledgements: We wish to thank: Pierre
Legroux (for sample collection of the provenances), Paul
Ngouahinga, Marc Faucher and Michel Vernier (for sam-
ple collection of the progenies), Gunnar Schüte (for sam-
ple collection of the clones), Frédéric Millier, Paul
Ngouahinga and Pierre-Henri Commère (for the X-ray
microdensitometry).
REFERENCES
[1] Abdel-Gadir A.Y., Krahmer R.L., Mckimmy M.D., Re-
lationships between intra-ring variables in mature Douglas-fir
trees from provenance plantations, Wood Fiber Sci. 25 (1993)
182–191.
[2] Bastien J.C., Roman-Amat B., Vonnet G., Natural varia-
bility of some wood quality traits of coastal Douglas-fir in a
Franch progeny test: implications on breeding strategy, in: Pro-
ceedings IUFRO Working party on breeding strategies for Dou-
glas-fir as an introduced species, Vienna, Austria, June 1985.
[3] Blouin D., Beaulieu J., Daoust G., Poliquin J., Wood
quality of Norway spruce grown in plantations in Québec, Wood
Fiber Sci. 26 (1994) 342–353.
[4] Chantre G., Gouma R.,Influence du génotype, de l’âgeet
de la station sur la relation entre l’infradensité du bois et la vi-
gueur chez l’épicéa commun (Picea abies Karst.), Ann. Rech.
Sylvic., 1993-1994, AFOCEL, France.
[5] Cholat R., Joyet P., Étude des caractéristiques mécani-
ques du pin sylvestre de la région Centre, CTBA, Bordeaux, rap-
port final, 1998, p. 38.
[6] Colin F., Houllier F., Leban J.M., Nepveu G., Modélisa-
tion de la croissance des arbres, des peuplements et de la qualité
des bois, Rev. For. Fr. 44 (1992) 248–254
[7] Cown D., Parker M.L., Densitometric analysis of wood
from five Douglas-fir provenances, Silvae Genetica 28 (1979)
48–53.
[8] Elliott G.K., Wood density in conifers, Technical Com-
munication No. 8, Commonwealth Forestry Bureau, Oxford,
England, 1970, p. 44.
392 P. Rozenberg et al.
[9] Gonzalez J.S., Richards J., Early selection for wood den-
sity in young coastal Douglas-fir trees, Can. J. For. Res. 18
(1988) 1182–1185.
[10] Guilley E., Hervé J.C., Huber F., Nepveu G., Modelling
variability of within-rings density components in Quercus pe-
traea Liebl. With mixed-effects models and simulating the
influence of contrasting silvicultures on wood density, Ann. Sci.
For. 56 (1999) 449–458.
[11] Guilley E., Loubère M., Nepveu G., Identification en
forêt de chênes sessiles (Quercus petraea Liebl.) présentant un
angle du fil du bois intrinsèquement faible, Can. J. For. Res. 29
(1999) 1958–1965.
[12] Hannrup B., Ekberg I., Age-age correlation for tracheid
length and wooddensity in Pinus sylvestris, Can. J. For. Res. 281
(1998) 1373–1379.
[13] Hannrup B., Ekberg I., Persson A., Genetic correlations
between wood, growth capacity and stem traits in Pinus sylves-
tris, Scand. J. For. Res. 15 (2000) 161–170.
[14] Heois B., Variabilité juvénile chez Pseudotsuga men-
ziesii (Mirb.) Franco. Contribution à la mise au point de tests préco-
ces. Thèse de l’INA Paris-Grignon, INRA Orléans, 1994, p. 259.
[15] Houllier F., Leban J M., Colin F., Linking growth mo-
delling to timber quality assessment for Norway spruce, For.
Ecol. Manage. 74 (1995) 91–102
[16] Khalil M.A.K., Genetics of wood characters of black
spruce (Picea mariana (Mill.) B.S.P.) in Newfoundland, Cana-
da, Silvae Genetica 34 (1985) 221–229.
[17] King J.N., Yeh F.C., Heaman J.Ch., DancikB.P., Selec-
tion of Wood Density and Diameter in Controlled Crosses of
Coastal Douglas-fir, Silvae Genetica 37 (1988) 152–157.
[18] Kremer A., Lascoux M., Nguyen A., Morphogenetic
subdivision of height growth and early selection in maritime
pine, in: Proceedings 21st Southern forest tree improvement
conference, June 17–20, Knoxville, Tennessee, 1991.
[19] Lausberg M., Wood density variation in Douglas-fir
provenances in New Zealand, FRI-bull. Rotorua: New Zealand
Forest Research Institute Limited 201 (1997) 64–71.
[20] Larson P.R., Wood formation and the concept of wood
quality, Yale University, School of Forestry, Bulletin n° 74
(1969) 53 p.
[21] Leban J.M., Estimations des propriétés des sciages
d'une ressource forestière application à l'épicea commun (Picea
abies Karst) Rev. For. Fr. 47 (1995) 131–140
[22] Lewark S. von, Étude des propriétés du bois de jeunes
épicéas provenant de clonage par bouturage, (French translation
by R. Judor, INRA Versailles, of the original article: Untersu-
chungen von holzmerkmalen junger fichten aus stecklingsklo-
nen. Forstarchiv 52 (1982) 14–21.)
[23] Loo-Dinkins J.A., Gonzalez J.S., Genetic control of
wood density profile in young Douglas-fir, Can. J. For. Res. 21
(1991) 935–939.
[24] Mothe F., Étude de la variabilité génétique inter et intra
population, de la qualité du bois et de la croissance chez l'épicéa
commun. Contribution à la détermination d'une stratégie d'amé-
lioration en vue de produire rapidement du bois aux propriétés
mécaniques élevées, Rapportde stage de DEA, INPL, Université
de Nancy I, INRA Nancy, 1983, p. 110.
[25] Nyakuengama J.G., Matheson C., Spencer D.J., Evans
R., VindenP., Time trends inthe genetic controlof wood micros-
tructure traits in Pinus radiata, Appita J. 50 (1997) 486–494.
[26] Polge H., Établissement des courbes de variation de la
densité du bois par exploration densitométriquede radiographies
d’échantillons prélevés à la tarière sur des arbres vivants. Appli-
cation dans les domaines technologiques et physiologiques.
Thèse de doctorat, Université de Nancy, France, 1966, 206 p.
[27] Plomion, C., Barhman N., Durel C.E., O'Malley D.M.,
Kremer A., Genetic dissection of phenotypic traits in maritime
pine using RAPD and protein markers, in: Somatic cell genetics
and molecular genetics of trees, Kluwer Acadaemic Publishers,
Dordrecht, Netherlands, 1996, 223–231.
[28] Roman-Amat B., Sélection d’individus réalisée par la
Station d’Amélioration des arbres forestiers de l’INRA dans la
race autochtone de pin sylvestre de la forêt indivise de Hagenau
(Bas-Rhin), document interne INRA Orléans, 1985, 8 p.
[29] Rozenberg P., Comparaison de la croissance en hauteur
entre 1 et 25 ans de 12 provenances de douglas (Pseudotsuga
menziesii (Mirb) Franco), Ann. Sci. For. 50 (1993) 363–381.
[30] Rozenberg P., van de Sype H., Genetic variation of the
pilodyn-girth relationship in Norway spruce (Picea abies L.
(Karst)), Ann. Sci. For. 53 (1996) 1153–1166.
[31] Rozenberg P., CahalanC., Spruce andwood quality: ge-
netic aspects (a review), Silvae Genetica 46 (1997) 270–279.
[32] Rozenberg P., Franc A., Mamdy C., Launay J., Scher-
mann N., Bastien J.C., Stiffness of standing Douglas-fir and ge-
netic effect: from the standing stem to the standardized wood
sample, relationships between modulus of elasticity and wood
density parameters. Part II, Ann. For. Sci. 56 (1999) 145–154.
[33] St-Clair J.B., Genetic variation in tree structure and its
relation to size in Douglas-fir. I. Biomass partitioning, foliage ef-
ficiency, stem form,and wood density, Ottawa,National Research
Council of Canada, Can. J. For. Res. 24 (1994) 1226–1235.
[34] Shelbourne T., Evans R., Kibblewhite P., Low C, Inhe-
ritance of tracheid transversedimensions and wood density in ra-
diata pine, Appi 50 (1997) pp. 47–50, 67.
[35] Ståhl E.G., Transfer effects and variations in basic den-
sity and tracheid length of Pinus sylvestris populations, Stud.
For. Suec. 180 (1988).
[36] Statistical Sciences, S-PLUS guide to statistical and
mathematical analysis,Version 3.2, Seattle:StatSci, a divisionof
MathSoft, Inc., 1993.
[37] Vanclay J.K., Modelling forest growth and yield:
Application to mixed tropical forests, CAB International, Wal-
lingford, 1994.
[38] Vargas-Hernandez J., Adams W.T., Genetic variation
of wood density components in young coastal Douglas-fir: im-
plications for tree breeding, Can. J. For. Res 21 (1991)
1801–1807.
[39] Vargas-Hernandez J., Adams W.T., Age-age correla-
tions and early selection for wood density in young coastal Dou-
glas-fir, For. Sci. 38 (1992) 467–478.
Wood density models and genetic effects 393
[40] Vargas-Hernandez J., Adams W.T., Krahmer R.L., Fa-
mily variation in age trends of wood density traits in young coas-
tal Douglas-fir, Wood Fiber Sci. 26 (1994) 229–236.
[41] Vonnet G., Perrin J.R., Ferrand J Ch., Reflexions sur la
densité du bois. 4
e
partie: densité et hétérogénéïté du bois de
Douglas, Holzforschung 39 (1985) 273–279.
[42] Williams C.G., Megraw R.A., Juvenile-mature rela-
tionships for wood density in Pinus taeda, Can. J. For. Res. 24
(1994) 714–722.
[43] Zhang S. Y., Owoundi, R.E., Nepveu G., Mothe F.,
Dhöte J.F., Modelling wood density in European Oak (Quercus
petraea and Quercus robur) and simulating the silviculture in-
fluence, Can. J. For. Res. 23 (1993) 2587–2593.
[44] Zhang S.Y., Simpson D., Morgenstern E.K., Variation
in the relationship of wood density with growth in 40 black
spruce (Picea mariana) families grown in New Brunswick,
Wood Fiber Sci. 28 (1996) 91–99.
[45] Zobel B.J, van Buijtenen J.P., Wood variation, its cau-
ses and control, Springer-Verlag, Berlin, 1989, 363 p.
[46] Zobel B.J., Jett J.B., Genetics of wood production,
Springer, Berlin, Heidelberg, New York, 1995.
394 P. Rozenberg et al.
APPENDIX
The chosen models are presented below for the three levels of genetic control. In each model W is ring width
(covariable), CA is cambial age (covariable), P is provenance (factor), S is site (factor), F is family (factor) and C is clone
(factor). a, b, c, are covariation coefficients (slopes) at the general level (a
0
, b
0
, c
0
), and at the levels of the genetic entries
(a
i
, b
i
, c
i
). Indices are consistent among expressions:
– k is tree index;
–iis genetic index (in P
i
for provenance, F
i
for families and C
i
for clones);
–jis site index (for the families only).
Covariation coefficients have the same index as the main corresponding effect. Index 0 is used for general relationships
at the population level. Index i is corresponding to the relationships at the level of the genetic entry.
Because, in all experiments, genetic entries were selectedandnotrandomlychosen,theyweretreated as fixed effects.
Provenance level
Model 1
D a W b CA c W CA
kkkkkk
=⋅ ⋅ ⋅⋅m+ + + +e
0
05
00
05
.
Model 2
D aWbCAPaWbCAcW
ik ik ik i i ik i j ik
=⋅ ⋅ ⋅ ⋅ ⋅m+ + + + + +
0
05
0
05
0
05.
.⋅CA
ik ik
+e
Half-sib family level
Model 1
D a W b CA c W CA
ijk ijk ijk ijk kij ijk
=⋅ ⋅ ⋅⋅m+ + + +e
0
05
00
05
.
Model 1b
This model is specific to this level as it includes a site factor S
j
and the corresponding interactions:
D SaW bCAcWCAa
ijk j ijk ijk ijk ijk j
=⋅⋅⋅⋅⋅m+ + + + +
0
05
00
05
WbCA
ijk j ijk ijk
05.
.++e⋅
Model 2
DSaWbCAcWCAF
ijk j ijk ijk ijk ijk i
=⋅⋅⋅⋅m+ + + + + +
0
05
00
05
aW bCA FS aW bCA
j ijk j ijk ij i ijk i ijk ijk
⋅⋅⋅⋅⋅
05 05
+++++e.
Clonal level
Model 1
D a W b CA c W CA
ik k k ik ik
=⋅ ⋅ ⋅⋅m+ + + +e
0
005
00
005
.
Model 2
D aWbCACaWbCAcW
ik k k k k k k k
=⋅ ⋅ ⋅ ⋅m+ + + + + +
0
005
0
005
0
00
.
5
⋅CA
ik ik
+e .