Báo cáo khoa học: "Tree canopy and herb layer transpiration in three Scots pine stands with different stand structures" potx
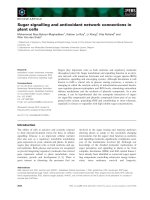
Bạn đang xem bản rút gọn của tài liệu. Xem và tải ngay bản đầy đủ của tài liệu tại đây (714.57 KB, 10 trang )
Original
article
Tree
canopy
and
herb
layer
transpiration
in
three
Scots
pine
stands
with
different
stand
structures
Dietmar
Lüttschwager
Steffen
Rust
b
Monika
Wulf
Jacqueline
Forkert
Reinhard
F.
Hüttl
a
Center
for
Agricultural
Landscape
and
Land
use
Research,
Eberswalder
Straße
84,
15374
Müncheberg,
Germany
b
Technical
University
of
Brandenburg,
03013
Cottbus,
Germany
(Received
30
March
1998;
accepted
25
January
1999)
Abstract -
To
evaluate
the
impact
of
herb
layer
structure
on
the
transpiration
of
Scots
pine
ecosystems
in
north-eastern
Germany,
we
measured
tree
canopy
and
herb
layer
transpiration
in
three
stands.
Parameters
of
tree
hydraulic
architecture
were
measured
and
their
drought
stress
monitored.
Despite
striking
differences
in
ecosystem
structure,
combined
tree
and
herb
layer
transpiration
was
equal
for
all
three
sites.
Transpiration
rate
per
needle
area
and
tree
canopy
transpiration
were
least
at
the
site
dominated
by
the
tall
grass
species
Calanzagrostis
epigeios.
Pine
pre-dawn
water
potential
in
the
Calamagrostin-Cultopinetum
sylvestris
was
never
lower
than
in
the
Myrtillo-Cultopinetum
sylvestris,
indicating
that
severity
of
competition
of
ground
vegetation
was
not
much
different.
Huber
val-
ues,
xylem
hydraulic
conductance
and
leaf-specific
conductance
of
pine
were
least
in
the
Calamagrostio-Cultopinetum
sylvestris.
Thus,
pine
transpiration
rate
might
have been
adjusted
to
lower
tree
hydraulic
conductance
and
the
herbaceous
species
used
the
water
left
by
the
trees.
(©
Inra/Elsevier,
Paris.)
canopy
/
herb
layer
/
transpiration
/
hydraulic
conductance
/
Scots
pine
Résumé -
Transpiration
des
arbres
et
de
la
strate
herbacée
dans
trois
peuplements
de
pins
sylvestres
de
différentes
struc-
tures.
Dans
le
but
d’évaluer
les
effets
de
la
strate
herbacée
sur
la
transpiration
d’écosystèmes
de
pins
sylvestres
en
Allemagne
du
nord-est,
la
transpiration
des
houppiers
et
de
la
strate
herbacée
a
été
mesurée
dans
trois
peuplements.
Les
paramètres
de
l’architecture
hydraulique
et
le
niveau
de
contrainte
hydrique
ont
été
mesurés.
Malgré
des
différences
importantes
dans
la
structure
de
chacun
de
ces
trois
peuplements,
leur
transpiration
totale
(arbres
plus
herbe)
était
identique.
Le
taux
de
transpiration
par
unité
de
surface
foliai-
re,
ainsi
que
la
transpiration
par
arbre
étaient
les
plus
faibles
dans
le
site
à
dominante
de
Calamagrostis
epigeios.
Le
potentiel
hydrique
de
base
dans
le
site
à
Calamagrostio-Cultopinetum
sylvestris
n’a
jamais
été
inférieur
à
celui
mesuré
dans
le
site
à
Myrtillo-
Cultopinetum
sylvestris,
ce
qui
permet
de
conclure
à
un
niveau
de
compétition
entre
les
arbres
et
l’étage
herbacé
peu
différent.
Les
valeurs
de
Huber,
la
conductance
hydraulique
du
xylème,
ainsi
que
la
conductance
hydraulique
spécifique
foliaire
des
pins
étaient
les
plus
faibles
dans
le
Calamagrostio-Cultopinetum
sylvestris.
Ainsi,
le
taux
de
transpiration
des
pins
semble
s’ajuster
pour
réduire
la
conductance
hydraulique,
la
ressource
hydrique
laissée
par
les
arbres
étant
consommée
par
la
strate
herbacée.
(©
Inra/Elsevier,
Paris.)
couvert
/
strate
herbacée
/
transpiration
/
conductance
hydraulique
/
pin
sylvestre
*
Correspondence
and
reprints
1.
Introduction
Scots
pine
is
the
dominant
tree
species
in
more
than
two
thirds
of
the
forests
in
north-eastern
Germany.
Site
factors,
especially
soil
pH,
nutrient
and
soil
water
avail-
ability
cause
important
differences
in
the
structure
and
species
composition
of
these
pine
forests
[6].
The
differ-
ent
types
of
stands
are
characterised
by
the
dominance
of
various
herb
species.
For
example,
mature
pine
stands
on
podsolic
soils
poor
in
nutrients
have
only
a
sparse
cover
of
grass
species
on
the
forest
floor,
whereas
stands
richer
in
nutrients
have
a
dense
cover
of
grasses,
e.g.
Brachypodium
sylvaticum
and
Calamagrostis
epigeios
[2,
11,
15].
The
various
forest
ecosystem
types
have
markedly
different
rates
of
biomass
production.
Calamagrostio-Cultopineti,
i.e.
stands
with
dominance
of
Calamagrostis
epigeios,
produce
4-5
t
biomass
ha-1
a
-1
in
the
herb
layer.
Stands
dominated
by
Deschampsia
flexuosa,
so-called
Avenello-Cultopineti,
reach
only
0.8
t
ha-1
a
-1
[11].
In
many
earlier
ecosystem
studies
total
stand
transpi-
ration
could
not
be
partitioned
into
the
contribution
of
the
tree
canopy
and
the
herb
layer.
However,
this
is
very
important
in
order
to
understand
the
impact
of
stand
structures
on
the
water
balance
of
pine
ecosystems.
Some
authors
(e.g.
[11])
assume
that
pine
stands
domi-
nated
by
Calamagrostis
epigeios
consumed
significantly
more
water
than
those
dominated
by
Deschampsia
flexu-
osa,
and
therefore
the
pine
trees
were
more
prone
to
drought
stress.
The
aim
of
this
paper
is
to
describe
the
different
transpiration
rates
of
the
tree
and
herb
layer
of
pine
ecosystems
with
various
structures.
In
particular,
we
want
to
estimate
the
contribution
of
the
herb
layer
to
the
stand
transpiration
rate.
Furthermore,
we
want
to
investigate
whether
a
pine
stand
with
a
denser
cover
of
grasses
used
more
water
and,
as
a
result
of
competition
between
trees
and
herbs,
whether
the
trees
were
more
likely
to
suffer
drought
stress.
2.
Materials
and
methods
2.1.
Site
description
Sites
were
selected
to
represent
major
pine
ecosystem
types
of
northern
Germany.
The
stands
are
45
(Taura)-
to
65
(Neuglobsow
and
Rösa)-year-old
Scots
pine
(Pinus
sylvestris)
forests,
located
in
the
former
GDR.
Edaphic
factors
and
climate
are
very
similar
(table
I
and
[30]).
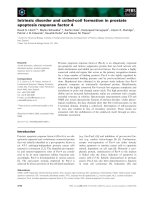
Data
of
precipitation
and
tensions
in
the
upper
soil
dur-
ing
the
period
of
measurements
are
shown
in figure
1.
The
site
Rösa
suffered
from
heavy
air
pollution
for
at
least
20
years
until
the
re-unification
of
Germany
in
1989.
In that
year,
needle
loss
was
estimated
at
45
%
[12].
Since
then,
trees
have
partially
recovered
[7].
In
Neuglobsow,
needle
loss
was
always
low
(8
%
in
1989
[12]).
According
to
the forest
administration
the
site
Rösa
received
approximately
1
000
kg
ha-1
of
nitrogen
as
urea
in
the
years
1970-1985
(unpublished).
2.2.
Tree
biomass
and
leaf
area
index
Five
trees
per
stand
were
sampled
as
a
stratified
ran-
dom
sample
for
needle
mass
in
September
1995.
All
branch
diameters
and
the
needle
mass
of
one
branch
per
whorl
were
measured.
Using
the
close
correlation
of
branch
diameter
and
needle
mass
[14,
17],
data
were
scaled
to
tree
level.
Specific
needle
area
(projected)
was
estimated
with
an
image
analysis
system
(CUE-3
Image
analyser,
Olympus)
samples
being
stratified
for
crown
location,
age
and
length.
A
regression
of
the
projected
needle
area
on
sapwood
area
was
used
to
scale
to
stand
level
[1, 31].
2.3.
Tree
hydraulic
conductivity
In
1995,
ten
small
(basal
diameter
0.5
cm)
and
two
larger
(basal
diameter
2.5
cm)
branches
per
tree
were
collected
from
the
top
of
the
crown
of
five
trees
per
stand
and
immediately
re-cut
under
water.
On
the
small
branches
hydraulic
conductivity
Kh
(kg
s
-1
m
MPa
-1
)
and
vulnerability
to
embolism
were
measured
in
2-year-
old
segments
5
mm
in
diameter
(including
bark)
and
40
mm
in
length
using
a
conductivity
apparatus
as
described
by
Sperry
et
al.
[23].
Branches
were
bench-top
dried.
Hydraulic
conductance
KT
(kg
s
-1
MPa
-1
)
and
Kh
of
the
larger
branches
were
measured
in
the
field
with
a
high-pressure
flowmeter
[27,
33].
We
used
de-ionised,
de-gased,
filtered
(0.2
μm)
0.01
N
HCl
and,
for
the
seg-
ments,
a
pressure
of
6
kPa.
2.4.
Tree
water
status
From
1993
to
1995,
the
water
status
of
the stands
was
assessed
by
periodical
measurements
of
pre-dawn
water
potential.
Two
twigs
per
tree
from
the
upper
crown
of
ten
trees
per
stand
were
collected
with
a
shotgun
and
the
balancing
pressure
of
two
fascicles
per
twig
was
imme-
diately
measured
with
a
pressure
chamber.
2.5.
Tree
canopy
transpiration
Tree
canopy
transpiration
was
estimated
by
sap
flow
measurements
in
15
representative
trees
per
stand
using
a
constant
heating
method
[8].
Two
gauges
were
installed
at
breast
height
in
each
tree
ranging
from
0
to
2.1
cm
and
2.2
to
4.4
cm
from
the
cambium,
respective-
ly.
Automatic
readings
were
taken
every
30
s
and
aver-
aged
over
30-min
periods.
Data
were
collected
between
August
1993
and
November
1995.
Conductive
sapwood
area
was
measured
in
all
45
sample
trees
by
computer-tomography
[5,
10,
19]
in
col-
laboration
with
the
Centre
for
Radiology
of
the
Phillips-
University
Marburg.
From
inventories
of
the
study
plots
and
the
data
on
sapwood
area
in
the
sample
trees,
stand
sapwood
area
was
calculated.
Stand
sap
flow
was
calcu-
lated
as
the
product
of
average
sap
flow
density
and
stand
sapwood
area.
2.6.
Ground
vegetation:
species,
biomass
and
LAI
At
each
site,
five
to
eight
plots
of
9
m2
were
estab-
lished
in
the
summer
of
1994.
The
plots
were
divided
into
four
quadrants
to
estimate
cover
degree
of
all
plant
species
to
the
nearest
percent.
Because
transpiration
was
not
measured
for
mosses,
their
cover
was
estimated
without
differentiating
for
species.
All
plots
were
pooled
to
calculate
monthly
averages
of
cover.
We
followed
the
nomenclature
of
Schmeil
and
Fitschen
[21].
In
three
plots
(0.25
m2)
per
site
all
living
herbaceous
plants
were
collected
in
height
strata
of
10
cm,
dried
at
80 °C
and
weighed.
For
each
relevant
species
means
of
the
biomass
were
scaled
to
a
hectare
basis.
Specific
leaf
area
for
these
species
was
estimated
with
an
image
analysis
system
(CUE-3
image
analyser,
Olympus).
Using
the
specific
leaf
area
and
the leaf
biomass
the
leaf
area
index
of
these
species
(LAIpart
)
was
calculated.
The
LAI
of
the
herbaceous
layer
is
the
sum
of
the
LAI
part
.
2.7.
Transpiration
of the
ground
vegetation
Transpiration
was
measured
monthly
for
species
with
at
least
10
%
cover
within
an
minimum
area
of
200
m2.
In
Rösa,
these
were
Brachypodium
sylvaticum,
Calamagrostis
epigelos
and
Rubus
idaeus,
in
Taura
Deschampsia
flexuosa
and
in
Neuglobsow
Deschampsia
flexuosa
and
Vaccinium
myrtillus.
In
the
growing
season
of
1995
diurnal
courses
were
measured
during
periods
of
bright
days
with
a
climatised
porometer
(compact
CO
2
/H
2O
porometer,
Walz,
Effeltrich).
Five-minute
averages
of
exposed
leaves
of
one
species
were
recorded
from
dawn
until
dusk.
The
daily
output
of
transpiration
of
a
species
was
scaled
up
to
the
stand
level
using
its
leaf
area
index
(LAIpart
).
Wedler
[29]
expected
only
low
differences
in
the
rela-
tionship
of
transpiration
rates
of
patch
types
in
the
field
layer
within
a
week.
According
to
this
fact
we
assumed
that
the
relation
of
the
transpiration
rates
of
different
herb
species
to
each
other
were
nearly
equal
within
2
to
3
consecutive
days.
The
measured
daily
transpiration
of
a
herb
species
was
related
to
the
canopy
transpiration
on
the
same
day.
Continuously
measured
canopy
transpira-
tion
was
used
as
reference
to
calculate
the
total
herb
layer
transpiration.
The
ratio
of
ground
vegetation
tran-
spiration
to
tree
transpiration
was
interpolated
through
periods
without
measurements
and
used
to
estimate
herb
layer
transpiration
from
tree
transpiration
during
these
times.
3.
Results
3.1.
Ground
vegetation
The
vegetation
of
Neuglobsow
was
dominated
by
Deschampsia
flexuosa
(about
15-23
%
from
April
to
July)
and
Vaccinium
myrtillus
(about
8-13
%
from
April
to
July)
indicating
a
site
without
major
deposition.
Rösa,
however,
was
dominated
by
Calamagrostis
epigeios
(about
12-29
%
from
April
to
July)
and
Brachypodium
sylvaticum
(ranged
from
about
4-18
%),
showing
the
influence
of
recent
N-fertilisation
and
Ca-deposition.
The
species
in
Taura
were
a
mix
of
N-indicators
such
as
Calamagrostis
epigeios
and
Rubus
idaeus
and
acid-toler-
ant
species
such
as
Deschampsia
flexuosa,
and
the
latter
reached
cover
degrees
of
about
44-57
%
from
April
to
July
[32].
Large
differences
between
sites
were
found
for
the
LAI
(table
II).
Rösa,
because
of
the
prevalence
of
wide-
leafed
species,
had
two
to
three
times
the
LAI
of
Neuglobsow.
3.2.
Needle
mass
and
leaf
area
index
of
the
trees
Needle
mass
was
highest
in
Rösa
(7.22
±
0.53
t
ha-1),
intermediate
in
Taura
(5.89
±
0.72
t
ha-1
)
and
lowest
in
Neuglobsow
(5.42
±
0.51
t
ha-1).
The
higher
specific
needle
area
and
needle
mass
of
Rösa
resulted
in
the
high-
est
LAI
(3.71
±
0.27
compared
to
Neuglobsow
2.38
±
0.15
and
Taura
2.65
± 0.32).
3.3.
Hydraulic
conductivity
In
2-year-old
segments
with
an
outer
diameter
of
ca
5
mm
and
water
potentials
close
to
0
MPa,
the
hydraulic
conductivity
Kh
was
significantly
higher
in
Neuglobsow
(P
<
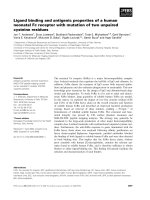
0.013).
Over
much
of
the
tested
range
of
xylem
water
potential,
Kh
of
segments
from
Neuglobsow
was
highest,
but
there
was
no
interaction
effect
of
xylem
water
potential
and
site
on
Kh
(figure
2).
The
leaf
specif-
ic
conductance
LSC,
i.e.
the
hydraulic
conductivity
divided
by
the
projected
needle
area
distal
to
the
mea-
sured
segment,
was
52
%
higher
in
Neuglobsow
than
in
the
other
stands
(significance
of
difference
P
<
0.005).
The
Huber
value
(sapwood
area/needle
area)
of
segments
from
Rösa
was
significantly
lower
than
in
Neuglobsow.
Since
the
conductivity
per
cross-sectional
area
(specific
conductivity)
was
not
significantly
different
(data
not
shown),
this
resulted
in
higher
LSC
in
Neuglobsow
over
the
range
2-15
mm
xylem
diameter.
For
stems,
the
leaf
area
to
sapwood
area
ratio
at
breast
height
(1.3
m)
for
the
three
stands
was
highest
in
Rösa
and
lowest
in
Neuglobsow
(table
III).
3.4.
Water
status
of the
trees
Pre-dawn
water
potentials
differed
substantially
between
1994
and
1995
(figure
3).
During
a
long
period
of
drought
in
1994
pre-dawn
water
potential
fell
from
above
-0.5
MPa
in
spring
to
below
-1.0
MPa
at
the
end
of
July.
In
Neuglobsow
trees
reached
the
lowest
needle
water
potentials
with
single
trees
as
low
as
-2.6
MPa,
on
average
-1.65
±
0.24
MPa
as
compared
to
Rösa
with
- 1.16
±
0.21
MPa.
In
1995,
pre-dawn
water
potentials
never
fell
below
-1.0
MPa.
3.5.
Tree
canopy
transpiration
The
ratio
of
sap
flow
densities
of
inner
and
outer
sap-
wood
differed
significantly
between
the
stands
(table
IV).
In
Rösa
the
mean
flow
density
in
the
outer
sapwood
was
higher
than
at
the
other
sites,
but
decreased
much
more
steeply
towards
the
heartwood
than
in
Taura
and
Neuglobsow.
Over
4
weeks
of
comparable
climatic
con-
ditions,
the
ratio
of
sap
flow
densities
of
inner
and
outer
sapwood
was
0.88
in
Neuglobsow,
but
0.40
in
Rösa.
In
Taura,
we
found
a
ratio
of
0.63
(all
differences
signifi-
cant
at
P
<
0.001).
For
the entire
growing
season
of
1994,
sapflow
densities
at
the
outer
sensors
in
Rösa
were
significantly
higher
than
in
Neuglobsow,
but
significant-
ly
lower
at
the
inner
sensors.
On
average,
sap
flow
per
tree
in
Rösa
was
90
%
of
that
in
Neuglobsow.
The
ratio
of
sap
flow
densities
of
inner
and
outer
sap-
wood,
however,
were
not
constant,
but
changed
from
year
to
year
and
rose
close
to
unity
in
periods
with
low
flow
rates,
e.g.
at
the
beginning
and
the
end
of
the
grow-
ing
season.
Daily
tree
canopy
transpiration
per
ground
area
for
1994
and 1995
is
shown
in figure
4.
On
fine
days,
tran-
spiration
reached
approximately
1
mm
d
-1
,
in
Neuglobsow
up
to
1.5
mm
d
-1
.
Because
of
declining
soil
water
availability,
transpiration
in
Neuglobsow
fell
to
less
than
one
third
from
mid
July
to
mid
August
1994,
in
spite
of
fairly
constant
climatic
conditions.
Tree
canopy
transpiration
during
the
growing
season
of
1994
(April
to
September)
was
106
mm
in
Rösa,
82
mm
in
Taura
and
113
mm
in
Neuglobsow.
In
1995,
the
values
were
Rösa
94,
Taura
90
and
Neuglobsow
122
mm.
Transpiration
per
needle
area
(stand
transpiration
per
hectare
divided
by
projected
needle
area
per
hectare)
was
lower
for
the
nitrogen-fertilised
and
polluted
stands
in
Rösa
and
Taura
in
all
3
years.
For
days
with
non-limiting
soil
water
availability,
i.e.
soil
water
potential
above
- 100
hPa,
there
was
a
highly
significant
difference
in
transpiration
per
needle
area
between
these
stands
(figure
5).
3.6.
Contribution
of
the
ground
vegetation
to
stand
transpiration
During
fine
summer
days,
ground
vegetation
transpi-
ration
exceeded
tree
transpiration.
In
Neuglobsow,
where
tree
transpiration
rates
were
highest,
ground
vegetation
transpiration
(excluding
mosses)
reached
half
the
tree
transpiration
(table
V).
Comparing
the
results
of
tables
II
and
V,
the
relative
contribution
of
a
species
to
stand
tran-
spiration
is
mainly
controlled
by
leaf
area
index
and
spe-
cific
transpiration
rates.
While
in
July
the
LAI
of
Rubus
idaeus
did
not
exceed
6
%
of
the
total
herb
layer
in
Rösa,
this
species
contributed
12
%
to
herb
transpiration.
Vaccinium
myrtillus,
however,
transpired
less
than
18
%
of
the
herb
layer,
although
its
partial
LAI
was
23
%.
Stand
transpiration
is
the
sum
of
field
layer
transpira-
tion
and
tree
canopy
transpiration.
Since
ground
vegeta-
tion
transpiration
data
were
only
available
for
some
days,
stand
transpiration
estimates
have
to
be
rather
rough.
For
the
growing
season
of
1995,
these
are
185
mm
in
Rösa,
173
mm
in
Taura
and
184
mm
in
Neuglobsow.
4.
Discussion
The
cumulated
LAI
of
the
herb
layer
in
Taura
is
simi-
lar
to
1.54
reported
by
Wedler
et
al.
[29]
for
a
30-year-
old
pine
stand
at
Hartheim
in
the
upper
Rhine
valley.
The
LAI
of
the
herb
layer
at
Rösa
was
higher
because
of
the
dominance
of
the
wide-leafed
species
Calamagrostis
epigeios
and
Brachypodium
sylvaticum.
The
absence
of
these
species
is
the
reason
for the
low
LAI
in
Neuglobsow,
although
the
leaf
area
of
moss
species
was
not
taken
into
account.
During
summer
the
transpiration
of
the
herb
layer
of
up
to
50
%
of
the
stand
transpiration
was
higher
than
expected.
Granier
et
al.
[9],
from
sap
flow
and
eddy
correlation
measurements
at
Hartheim,
estimated
a
herb
layer
contribution
to
total
vapour
flux
of
26
%.
A
contribution
of
the
herb
layer
to
stand
tran-
spiration
comparable
to
our
results
was
found
by
Tan
and
Black
[25],
Black
[3],
Roberts
et
al.
[18]
and
Spittlehouse
[24].
Due
to
the
low
number
of
days
mea-
sured
at
each
site
and
the variable
weather
conditions
during
field
works
our
data
can
only
be
rough
estimates.
However,
investigations
in
a
Scots
pine
ecosystem
in
the
upper
Rhine
valley
have
shown
that
the
relationships
among
transpiration
rates
of
different
patch
types
in
the
field
layer
do
not
change
significantly
within
a
week
[29].
Additionally,
the
counteracting
effects
of
measur-
ing
exposed,
leafy
plant
parts
and
excluding
plant
stems
in
the
procedure
of
up-scaling
are
not
known.
While
the
first
leads
to
an
overestimation
of
transpiration,
the
exclusion
of
plant
stems
may
cause
an
underestimation.
The
leaf
area
indices
of
the
tree
canopies
are
signifi-
cantly
different
because
of
the
differences
in
needle
bio-
mass
and
specific
leaf
area.
While
potential
evapotran-
spiration
at
the
three
sites
was
comparable,
soil
water
availability
was
highest
at
Rösa
with
150
mm
as
com-
pared
to
100
mm
extractable
soil
water
in
the
upper
50
cm
at
Neuglobsow
[30].
Nevertheless,
a
lower
tran-
spiration
rate
on
a
needle
area
basis
caused
stand
canopy
transpiration
in
Rösa
to
be
lower
than
in
Neuglobsow,
despite
the
higher
LAI
of
pine
in
Rösa.
The
largest
dif-
ferences
between
stands
occurred
during
periods
of
drought.
A
reason
might
be
the
lower
leaf
specific
con-
ductivity
of
the
xylem.
Our
estimates
of
hydraulic
con-
ductivity
of
whole
trees,
stems,
and
branches
indicate
a
lower
conductivity
of
the
pine
trees
in
Rösa
than
in
Neuglobsow.
The
leaf
area
to
sapwood
area
ratio
found
in
Rösa
(2
078
cm
2
cm-2
)
was
twice
that
of
Neuglobsow
and
highly
compared
to
other
studies.
Van
Hees
and
Bartelink
[28]
report
900-1
300
cm
2
cm-2
and
Mencuccini
and
Grace
[17]
found
800-1
700
cm
2
cm-2
for
Scots
pine.
Models
[13,
26]
and
field
experiments
[4,
16]
show
that
stomatal
regulation
can
play
an
important
role
in
controlling
the
development
of
xylem
embolism.
Because
of
their
lower
conductance,
trees
in
Rösa
would
have
to
develop
a
much
steeper
water
potential gradient,
with
the
risk
of
xylem
dysfunction
and
decreasing
con-
ductivity,
if
they
were
to
sustain
a
transpiration
rate
as
high
as
the
trees
in
Neuglobsow
[13,
23, 26,
34].
However,
xylem
water
potentials
of
the
stands
were
always
in
the
same
range,
with
Neuglobsow
at
the
lower
end.
Transpiration
rate
might
be
adjusted
to
tree
hydraulic
conductance
in
a
way
that
avoids
the
develop-
ment
of
water
potentials
that
cause
xylem
embolism.
The
drought
stress
developed
during
drought
in
Rösa
was
not
higher
than
in
Neuglobsow.
This,
together
with
the
assumption
that
tree
transpiration
rates
in
Rösa
were
more
limited
by
hydraulic
architecture
than
in
Neuglobsow,
leads
us
to
the
conclusion
that
there
was
no
severe
competition
of
ground
vegetation.
Rather,
the
herbaceous
species
used
the
water
left
by
the
trees.
Therefore,
stand
transpiration
for
all
three
stands
is
of
the
same
magnitude,
although
there
are
large
differences
in
species
composition
and
stand
structure.
Acknowledgements:
This
study
was
funded
by
the
German
ministry
of
education
and
science.
We
thank
Mel
Tyree
for
giving
Steffen
Rust
the
chance
to
study
their
methods
at
the
Proctor
Maple
Research
Station
and
André
Granier
for
critical
comments
on
this
paper.
We
thank
our
technicians
Bodo
Grossmann
and
Lothar
Löwe.
References
[1]
Albrektson
A.,
Sapwood
basal
area
and
needle
mass
of
Scots
pine
(Pinus
sylvestris
L.)
trees
in
Central
Sweden,
Forestry
57
(1984)
36-43.
[2]
Bergmann
J.H.,
Das
Sandrohr
(Calamagrostis
epigeios
(L.)
Roth).
Forschungsbericht,
Zeneca
Agro,
Frankfurt/M,
1993.
[3]
Black
T.A.,
Tan
C.S.,
Nnyamah
J.U.,
Transpiration
rate
of
Douglas
fir
trees
in
thinned
and
unthinned
stands,
Can.
J.
Soil. Sci. 60
(1980)
625-631.
[4]
Cochard
H.,
Breda
N.,
Granier
A.,
Whole
tree
hydraulic
conductance
and
water
loss
regulation
in
Quercus
during
drought:
evidence
of
stomatal
control
of
embolism?,
Ann.
Sci.
For.
53
(1996)
197-206.
[5]
Edwards
W.R.N.,
Jarvis
P.G.,
A
method
for
measuring
radial
differences
in
water
content
of
intact
tree
stems
by
atten-
uation of
gamma
radiation,
Plant
Cell
Environ.
6
(1983)
255-260.
[6]
Ellenberg
H.,
Vegetation
Mitteleuropas
mit
den
Alpen,
Ulmer,
Stuttgart,
1996.
[7]
Ende
H.P.,
Gluch
W.,
Hüttl
R.F.,
Ernährungskundliche
und
morphologische
Untersuchungen
im
Kronenraum
von
Pinus
sylvestris
L.,
Hüttl
R.F.,
Bellmann
K.,
Seiler
W.
(Eds.),
in:
Atmosphärensanierung
und
Waldökosysteme,
Blottner,
Taunusstein,
1995, pp.
112-128.
[8]
Granier
A.,
Une
nouvelle
méthode
pour
la
mesure
du
flux
de
sève
brute
dans
le
tronc
des
arbres,
Ann.
Sci.
For.
42
(1985) 193-200.
[9]
Granier
A.,
Biron
P.,
Köstner
B.,
Gay
L.W.,
Najjar
G.,
Comparison
of
xylem
sap
flow
and
water
vapour
flux
at
the
stand
level
and
derivation
of
canopy
conductance
of
Scots
pine,
Theor.
Appl.
Climat.
53
(1996)
115-122.
[10]
Habermehl
A.,
Ridder
H W.,
Schmidt
S.,
Mobiles
Computer-Tomographie
Gerät
zur
Untersuchung
ortsfester
Objekte,
Atomenergie,
Kerntechnik
48
(1986)
94-99.
[11]
Hofmann
G.,
Der
Wald.
Sonderheft
Waldökosystem-
Katalog,
Deutscher
Landwirtschaftsverlag,
Berlin,
1994.
[12]
Hüttl
R.F.,
Bellmann
K.,
Seiler
W.,
Einleitung
und
Hintergrund
zum
wissenschaftlichen
Begleitprogramm
SANA,
in:
Hüttl
R.F.,
Bellmann
K.,
Seiler
W.
(Eds.),
Atmoshärensanierung
und
Waldökosysteme,
Blottner,
Taunusstein,
1995, pp.
10-18.
[13]
Jones
H.G.,
Sutherland
R.A.,
Stomatal
control
of
xylem embolism,
Plant
Cell.
Environ.
14
(1991)
607-612.
[14]
Kaibyainen
L.K.,
Khari
P.,
Sazonova
T.,
Myakelya
A.,
Balance
of
water
transport
in
Pinus
sylvestris
L.,
III.
Conducting
xylem
area
and
needle
amount,
Lesowedenje 1
(1986) 31-37.
[15]
Kopp
D.,
Vegetationsveränderungen
auf
Waldstandorten
des
Tieflandes
durch
Immission
basischer
Flugaschen
und
Zementstäube,
Archiv
Naturschutz
und
Landschaftsforschung
(Berlin)
26
(1986)
105-115.
[16]
Lu
P.,
Biron
P.,
Granier
A.,
Cochard
H.,
Water
rela-
tions
of
adult
Norway
spruce
(Picea
abies
(L.)
Karst.)
under
soil
drought
in
the
Vosges
mountains:
whole
tree
hydraulic
conductance,
xylem
embolism
and
water
loss
regulation,
Ann.
Sci.
For.
53
(1996)
113-121.
[17]
Mencuccini
M.,
Grace
J.,
Climate
influences
the
leaf
area
/
sapwood
area
ratio
in
Scots
pine,
Tree
Physiol.
15
(1995)
1-10.
[18]
Roberts
J.,
Pymar
C.F.,
Wallace
J.S.,
Pitman
R.M.,
Seasonal
changes
in
leaf
area,
stomatal
and
canopy
conduc-
tance
and
transpiration
from
bracken
below
a
forest
canopy,
J.
Appl.
Ecol.
17
(1980)
409-422.
[19]
Rust
S.,
Lüttschwager
D.,
Hüttl
R.F.,
Transpiration
and
hydraulic
conductivity
in
three
Scots
pine
(Pinus
sylvestris
L.)
stands
with
different
air
pollution
histories,
Water
Air
Soil
Pol.
85
(1995)
1677-1682.
[20]
Schaaf
W.,
Weisdorfer
M.,
Hüttl
R.F.,
Soil
solution
chemistry
and
element
budgets
of three
Scots
pine
stand
along
a
deposition
gradient
in
northeastern
Germany,
Water
Air
Soil
Pol.
85 (1995) 1197-1202.
[21]
Schmeil
O.,
Fitschen
J.,
Flora
von
Deutschland
und
angrenzender
Länder.
89.
Aufl.,
Quelle
und
Meyer,
Heidelberg/Wiesbaden,
1993.
[22]
Schulz
H.,
Huhn
G.,
Härtling
S.,
Responses
of
sulphur-
and
nitrogen-containing
compounds
in
Scots
pine
needles
along
a
deposition
gradient
in
eastern
Germany,
in:
Hüttl
R.F.
et
al.
(Eds.),
Forest
Ecosystems
and
Atmospherical
Deposition
Changes,
Kluwer
Academic
Publishers,
1999
(in
press).
[23]
Sperry
J.S.,
Donnelly
J.R.,
Tyree
M.T.,
A
method
for
measuring
hydraulic
conductivity
and
embolism
in
xylem,
Plant
Cell
Environ.
11
(1988)
35-40.
[24]
Spittlehouse
D.L.,
Impact
of
competing
vegetation
on
site
water
balance,
in:
FRDA-Report,
Victoria,
BC,
Forestry
Canada,
May
1988
(026),
pp.
28-30.
[25]
Tan
C.S.,
Black
T.A.,
Factors
affecting
the
canopy
resistance
of
a
Douglas
fir
forest,
Boundary
Layer
Meteorol.
10
(1976) 475-488.
[26]
Tyree
M.T.,
Sperry
J.S.,
Do
woody
plants
operate
near
the
point
of
catastrophic
xylem
dysfunction
caused
by
dynamic
water
stress?
Answers
from
a
model,
Plant
Physiol.
88
(1988)
574-580.
[27]
Tyree
M.T.,
Patino
S.,
Bennink
J.,
Alexander
J.,
Dynamic
measurements
of
root
hydraulic
conductance
using
a
high-pressure
flowmeter
in
the
laboratory
and
field,
J.
Exp.
Bot.
46
(1995)
83-94.
[28]
Van
Hees
A.F.M.,
Bartelink
H.H.,
Needle
area
rela-
tionships
of
Scots
pine
in
the
Netherlands,
For.
Ecol.
Manage.
58 (1993) 19-31.
[29]
Wedler
M.,
Heindl
B.,
Hahn
S.,
Köstner
B.,
Bernhofer
C.,
Tenhunen
J.D.,
Model-based
estimates
of
water
loss
from
’patches’
of the
understorey
mosaic
of
the
Hartheim
Scots
pine
plantation,
Theor.
Appl.
Climat.
53
(1996)
135-144.
[30]
Weisdorfer
M.,
Schaaf
W.,
Blechschmidt
R.,
Schütze
J.,
Hüttl
R.F.,
Soil
chemical
response
to
drastical
reductions
in
deposition
and
its
effects
on
the
element
budgets
of
three
Scots
pine
ecosystems
with
different
pollution
history
in
northeastern
Germany,
in:
Hüttl
R.F.
et
al.
(Eds.),
Forest
Ecosystems
and
Atmospherical
Deposition
Changes,
Kluwer
Academic
Publishers,
1999
(in
press).
[31]
Whitehead
D.,
The
estimation
of foliage
area
from
sap-
wood
basal
area
in
Scots
pine,
Forestry
51
(1978)
137-149.
[32]
Wulf
M.,
Lüttschwager
D.,
Forkert
J.,
Hüttl
R.F.,
Untersuchungen
zum
Deckungs-
und
Transpirationsgrad
aus-
gewählter
Pflanzenarten
der
Krautschicht
in
Kiefernbeständen,
J.
Appl.
Bot.
70
(1996)
165-171.
[33]
Yang
S.,
Tyree
M.T.,
Hydraulic
resistance
in
Acer
sac-
charum
shoots
and
its
influence
on
leaf
water
potential
and
transpiration,
Tree
Physiol.
12
(1993)
31-42.
[34]
Zimmermann
M.H.,
Xylem
Structure
and
the
Ascent
of
Sap,
Springer,
Berlin,
1983.