Báo cáo khoa học: "Modelling resin production distributions for Pinus Pinaster Ait using two probability functions" docx
Bạn đang xem bản rút gọn của tài liệu. Xem và tải ngay bản đầy đủ của tài liệu tại đây (294.97 KB, 9 trang )
Original article
Modelling resin production distributions
for Pinus Pinaster Ait using two probability functions
Nikos Nanos
a,*
, Wubalem Tadesse
a
, Gregorio Montero
a
, Luis Gil
b
and Ricardo Alia
a
a
Centro de Investigacion Forestal, CIFOR-INIA, Apdo 8111, 28080 Madrid, Spain
b
Unit of Physiology and Genetics, ETSI Montes, 28040 Madrid, Spain
(Received 12 April 1999; accepted 10 February 2000)
Abstract – The Weibull and the Chaudhry-Ahmad probability density functions were used to model resin production distributions for
maritime pine stands. Maximum likelihood was used for parameter estimation. Data were collected during one season in two sets of
plots. Set 1 consisted of two 50-tree and one 100-tree plots. Bootstrap re-sampling showed that the Weibull parameters had smaller
estimation errors for small sample sizes. Set 2 consisted of thirty-seven 10-tree plots. No significant differences in the fit of the den-
sity functions were detected. Parameters of both models were found to be well correlated with the mean plot production as well as
with the within plot coefficient of variation. The results did not reveal any major differences between the Weibull and the Chaudhry-
Ahmad probability functions. The most appropriate model should be chosen at later stages when parameters of both functions are
regressed against easily measured stand attributes.
resin production distribution / Pinus pinaster / Weibull / Chaudhry and Ahmad / modelling
Résumé
– Modélisation de la distribution de production de résine pour Pinus pinaster Ait au moyen de deux lois de probabi-
lité.
La distribution de la production de résine de peuplements de pin maritime est modélisée par les fonctions de densité de probabi-
lité de Weibull et de Chaudhry-Ahmad La méthode du maximum de vraisemblance est utilisée pour l’estimation des paramètres. Les
données ont été mesurées dans deux groupes de placettes pendant une saison de récolte. Pour le premier groupe qui est composé de
deux placettes de 50 arbres et d’une autre de 100 arbres, le re-échantillonnage «bootstrap» a montré que les paramètres de la fonction
de Weibull ont une erreur plus faible pour les petits échantillons que celle de la fonction de Chaudhry-Ahmad. Le second groupe est
constitué de 37 placettes de 10 arbres. Aucune différence significative entre l’ajustement des deux fonctions de probabilité n’est mise
en évidence. Les paramètres des deux modèles sont corrélés avec les productions moyennes des placettes et avec les coefficients de
variation intra-placettes. Les résultats ne montrent pas de différences significatives entre les fonctions de probabilité de Weibull et de
Chaudry-Ahmad. Le modèle définitif sera choisi ultérieurement après la mise en relation entre les paramètres des deux fonctions et
des variables dendrométriques facilement mesurables.
distribution de la production de résine / Pinus pinaster / Weibull / Chaudhry et Ahmad / modélisation
1. INTRODUCTION
Resin tapping was an important rural activity in the
Mediterranean basin until the 1970s when the internation-
al crisis in natural resin prices rendered this traditional
labor no longer profitable. Presently Pinus pinaster Ait
(maritime pine) is the only species tapped in Spain. Resin
tapping is restricted to a few areas (mainly Central Spain),
where trees produce a sufficient quantity of resin and
extraction is facilitated by favorable terrain. Recently, an
increased demand for natural resins has pushed up prices
and many of the abandoned stands are tapped again.
Ann. For. Sci. 57 (2000) 369–377 369
© INRA, EDP Sciences
* Correspondence and reprints
Tel. 34 91 347 68 15; Fax. 34 91 357 31 07; e-mail:
N. Nanos et al.
370
Scientific interest in this forest product has traditionally
been focused on improving the extraction method and pro-
ducing improved genetic material since it was noted early
that resin production is under high genetic control [15].
Despite long-standing scientific interest, there is a lack
of information about the silvicultural treatment that
should be applied to stands dedicated to resin production
and no prediction models exist that can help forest man-
agers determine whether tapping a certain stand will be
profitable or not. Moreover, if a resin production model
can be combined with a growth and yield model, then the
decision will be made even more easily.
The first step of the modelling process is to determine
the probability density functions (pdf) that can model the
stand production distribution. To our knowledge no stud-
ies have been made on this topic.
Bailey and Dell [2] introduced the well-known
Weibull function in the forestry field in their effort to
model the diameter distributions of pure, even-aged
stands. This function has received a great deal of attention
due to its flexibility and simplicity [11-14, 20]. Apart
from diameter distribution model, it has been used to
model tree-age distributions [4], vertical distributions of
foliage weight and surface area [3] as well as seed cone
survivorship curves [6].
Chaudhry and Ahmad [5] presented the second pdf
used in this study. They derived their function as a solu-
tion to a generalized Pearson differential equation. The
properties, parameter estimation and applications of the
function are discussed in the same paper so no further
details will be presented here. This function was chosen
among many other candidates because of its bi-paramet-
ric nature and flexibility.
In the present study, the Weibull and the Chaudhry-
Ahmad probability functions have been used to model
resin-yield distributions. Accuracy of model predictions
was assessed with bootstrap re-sampling and an error
index developed for this case. These probability density
functions could be used in future to construct models of
stand resin production.
2. MATERIALS AND METHODS
2.1. Study area
The experiment took place in pure, even-aged stands
of Pinus pinaster located in central Spain. The study area
is characterized by the complete absence of significant
slopes. The soil texture is relatively uniform, with a high
percentage of sand (always over the 90%) and low con-
tent of organic matter [1], which makes the area rather
unproductive. The climate is typical Mediterranean with
460 mm of mean annual precipitation and 11.3 °C of
mean annual temperature.
2.2. Data
Data came from a total of 40 experimental plots. Two
sets of plots were installed according to their main objec-
tive. The first set of plots was used to select the most
appropriate among various probability functions and to
assess the precision of pdf ’s parameter estimates. Three
plots were established, two of them including 50 trees
(Co1–C1) and one 100 trees per plot (S1). The second set
was used to validate the previously chosen probability
functions at a broad range of environmental and silvicul-
tural conditions. It included thirty-seven 10-tree plots.
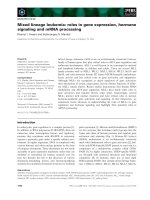
Location of plots is found in figure 1.
Trees in each plot were numbered and tapping was car-
ried out using bark chipping with application of acid
paste, following the same protocol for all the trees. The
resin produced by each individual was weighed in the
field by visiting plots every 20 to 30 days (when pots
were full of resin). Pots were weighed full and empty, and
the net resin weight was computed by subtracting the two
measures. The tapping period lasted six months, from
May to October 1998.
2.3. Statistical analysis
The bi-parametric Weibull function is given by:
f(x) = c/b (x/b)
(c–1)
exp(–(x/b)
c
) (1)
where
x is the tree resin production (kg) and “b” and “c”
the scale and shape parameter respectively.
The Chaudhry and Ahmad probability function for the
random variable x is given by:
f(x) = 2(a/π)
1/2
exp(2aµ
0
2
) exp(–aµ
0
2
((x/µ
0
)
2
+ (µ
0
/x)
2
)) (2)
where x is the resin production (kg), “µ
0
” the location
parameter of the distribution that coincides with the mode
and “aµ
0
2
” the shape parameter [5].
There exists a large and growing literature on the esti-
mation methods of the parameters of the Weibull func-
tion. Maximum likelihood (ML), percentile, and
moments method have been widely used for parameter
estimation. Shiver [20], using data from a simulator
developed to provide slash pine diameter distributions,
found that percentile estimators were biased but had
smaller variance than ML estimators.
In the present study, maximum likelihood was used for
parameter estimation. Regarding the Chaudhry-Ahmad
Resin production distributions
371
pdf, the solution of the ML equations is straightforward
[5], but for the Weibull likelihood, maximization is
achieved iteratively. We used a Newton-Raphson ML
estimation procedure for the Weibull parameters, written
in SAS ® (SAS/IML).
2.4. Set 1
The chi-square test was used to check for the good-
ness-of-fit of the two probability functions for the set-1
plots. The null hypothesis to be tested is that f(x, ϑ) is the
true distribution function (x being the vector of observa-
tions and ϑ the vector of parameters). Usually, f(x, ϑ) is
not completely specified in the null hypothesis because
its parameters have to be estimated from the data. In that
case the user should regard p-values with caution [19].
When ML is used for parameter estimation, the asymp-
totic distribution of the x
2
statistic will be between the
x
2
(a, k–1) and the x
2
(a, k–1–q), (“q” being the number of
parameters estimated from the data, “k” the number of
classes into which trees fall and “a” the level of signifi-
cance). We compared the test statistic to the chi-square
distribution with both k–1 and k–1–q degrees of freedom.
The Akaike’s information criterion (AIC), has been
also used to compare the fit of the two distributions. We
first computed the log-likelihood ratio given by:
(3)
where L(x) is the likelihood ratio, f
A
and f
W
are the
Chaudhry-Ahmad and the Weibull density function, x
i
the
vector of observations and
ϑ
A
,
ϑ
W
the vectors of estimat-
ed parameters for the Chaudhry-Ahmad and the Weibull
density respectively.
ln
Lx
=ln
f
A
x
i
,
ϑ
A
Π
i
=1
n
f
W
x
i
,
ϑ
W
Π
i
=1
n
Figure 1. Installed plots.
N. Nanos et al.
372
Since the distributions to be compared have the same
number of independent parameters, the Chaudrhy-Ahmad
fits better than the Weibull when ln L(x) > 0 [19].
A bootstrap re-sampling technique [8], was also used
to assess the absolute error in parameter estimates of the
two probability functions. Re-sampling was restricted to
the set –1 plots (S1, Co1 and C1) since the rest of the
plots were not big enough. One thousand bootstrap sam-
ples of different size were randomly chosen from the
three plots. The size of the samples (trees per sample)
varied from 10 to 40 for the Co1 and C1 plots and from
10 to 90 for the S1 plot. A total of 15000 samples were
constructed (4000 for each of the Co1 and C1 plots and
7000 for the S1 plot). Sampling was done by randomly
selecting a tree from the sample and replacing it before
the next tree was chosen. Parameters of both probability
functions were calculated for each bootstrap sample and
the average absolute error in parameter estimation for
every sample size was computed. In order to compare the
probability functions in terms of accuracy of parameter
estimations, we computed the
proportional absolute
error (PAE)
for each bootstrap sample size:
(4)
where i=10, 20,…, 90 is the bootstrap sample size, p
i
is
the average value of the parameter for 1000 bootstrap
samples of size i, p
r
is the value for the parameter in the
original sample. This error index permits the comparison
of the two probability functions in terms of accuracy of
parameter estimation, since it provides the proportional
estimation error.
2.5. Set 2
Reynolds et al. [19] report that when trying to select the
best model to fit the observed distributions, one should
consider the usefulness of the model from a practical point
of view. In our case, an error of one tree at low production
classes is less important than an error of one tree at
higher classes. We therefore grouped the data into 1 kg
classes and adopted the weighted sum of the absolute dif-
ferences between observed and estimated frequencies, as
an index of the accuracy of model estimations. Weights
for each class were equal to the mean class production:
(5)
where, EI is the error index, i = 1, 2…n, the number of
classes to which trees fall, x
i
the mean of class i, f
oi
and f
pi
are, respectively, the observed and estimated frequencies
of trees falling into class i.
The above mentioned error index has been computed
for the set-2 plots and for both models. A paired-samples
t-test was then used to check for significant differences
between model estimations.
3. RESULTS
3.1. Set-1
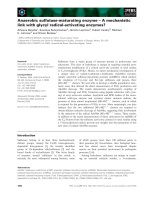
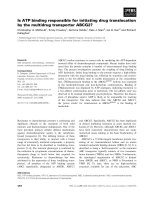
The observed distributions for the set-1 plots (figure 2)
are indicative of differences among sites with respect to
their resin yield capacity. In plot C1, 40% of the trees pro-
duce more than 4 kg of resin while the corresponding per-
centage is 0% and 12% for C1 and S1 plot respectively.
Descriptive statistics as well as the parameter estimates
for the set-1 plots are shown in table I.
No large difference exists between the two probability
functions (figure 2) but the Chaudhry-Ahmad pdf is more
skewed to high yield classes than the Weibull
distribution.
EI
=
x
i
f
o
i
–
f
p
i
Σ
i
=1
n
PAE
i
=
p
i
–
p
r
p
r
100
Table I. Descriptive statistics and parameter estimates for set-1 plots.
Descriptive Statistics Maximum Likelihood Parameter Estimates
WEIBULL CHAUDHRY & AHMAD
Plot Min Max Mean Sk Kur cbaµ
0
S1 0.75 6.27 2.92 0.84 0.90 2.81 3.27 0.110 2.290
C1 0.90 8.75 3.73 0.69 –0.21 2.05 4.22 0.040 2.370
Co1 0.35 3.93 1.75 0.39 –0.32 2.25 1.97 0.180 1.000
Min: minimum plot production; Max: Maximum plot production; Mean: average of the plot; Sk: Skewness(for the normal distribution Sk = 0); Kur:
Kurtosis (for the normal distribution kur = 0); a, µ
0
, b, c: Maximum likelihood parameter estimates.
Resin production distributions
373
Figure 2. Observed frequencies and fitted models for set-1
plots.
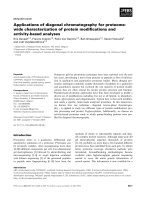
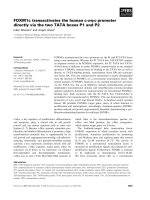
Figure 3. Proportional absolute error in parameter estimates
with respect to bootstrap sample size.
N. Nanos et al.
374
The chi-square test showed that, at 0.05 significance
level the null hypothesis is rejected in plot S1 for both the
probability functions but it cannot be rejected for plots C1
and Co1 (table II). It should be noted that although the
null hypothesis is rejected for the S1 plot, the Chaudrhy-
Ahmad function fits better the distribution since its chi-
square value is much smaller than that of the Weibull.
The AIC leads to the conclusion that the fit of the
Chaudhry-Ahmad density function is better in plots S1
and C1 but worse in plot Co1 (table II).
The results of 1000 bootstrap samples of different
sizes are presented in
figure 3. The “a” parameter of the
Chaudhry-Ahmad function has bigger PAE for all plots
and all sample sizes compared to the other three parame-
ters. Its proportional absolute error reaches a maximum
value of 54.31% in plot S1 for sample size equal to 10. A
significant reduction in the committed error is obvious
when the sample size increases from 10 to 30 trees.
The scale parameter (b) of the Weibull function had
smaller errors for all sample sizes compared to the loca-
tion parameter (µ
0
) of the Chaudhry-Ahmad function.
Finally, it should be noted that parameters “b” and
“µ
0
”(that are related with the location of the distribution),
had smaller errors compared to the “a” and “c” parame-
ters that are responsible for the shape of the distribution.
3.2. Set-2
Large differences were observed in the average pro-
duction among the set-2 plots (table III). The lowest
mean production was found in plot N36 (1.33 kg/tree),
and the highest in N6 (4.7 kg/tree). The within plot vari-
ance showed a clear increasing tendency for increasing
average plot production (figure 4).
Only seven distributions (18%) are negatively skewed
showing that in general the mean is bigger than the mode
and the median of the distribution.
The parameter estimates are shown in table III. The
scale parameter of the Weibull function and the location
parameter of the Chaudhry-Ahmad function were found
to be highly correlated with the mean production of each
plot. A strong relationship exists between the scale para-
meter of the Weibull function and the average plot pro-
duction (R
2
= 0.99). The same relationship for the
location parameter of the Chaudhry-Ahmad function is
not so strong (R
2
= 0.86) (figure 5a).
The shape parameters (
c and aµ
0
2
) were less correlat-
ed with other measures of the actual distributions. The
best correlation coefficients resulted between both the
shape parameters and the within plot coefficient of varia-
tion (CV). As shown in figure 5b, this relationship is a
non-linear one for both parameters. Apparently, when the
coefficient of variation of the actual distribution increas-
es from 20 to 35%, the shape parameter of the Chaudhry-
Ahmad function reduces significantly; but, when the CV
reaches a value of 40% (standard deviation is four times
bigger than the mean), then the reduction in “aµ
0
2
”
becomes smaller.
The final step of the model comparison was to calcu-
late the error index given in equation (5), for the set-2
plots. The t-test for this index resulted in a non-significant
difference between errors made by the two pdfs
(p=0.60).
Table II. Akaike’s Information Criterion and chi-square test.
CHI-SQUARE
Chi-square statistic Critical Values
Plot AIC W
EIBULL CHAUDHRY x
2
(a, k–1) x
2
(a, k–1–q)
& AHMAD
S1 3.07 17.30 11.19 11.07 7.81
C1 1.92 7.73 5.39 15.50 12.59
Co1 –1.69 0.21 1.45 7.81 3.84
AIC: Akaike’s Information Criterion; x
2
(a, k–1), x
2
(a, k–1-q): chi-
square statistic for a = 0,05 the level of significance, k the number of
classes into which trees fall and q the number of estimated parameters.
Figure 4. Mean plot production with respect to within plot
variance.
Resin production distributions
375
4. DISCUSSION
Large differences were found among the sampled plots
with respect to their resin-yielding ability. Such differ-
ences could be attributed to edaphic, climatic or genetic
factors [7]. The first two of these seem to be the most
important in our case because the spatial distribution of
the experimental plots does not advocate the existence of
genetic differences among trees of different plots.
Obviously, tapping should be restricted to the more pro-
ductive stands (where extraction will be profitable), leav-
ing the less favorable ones for timber production.
At present, no information concerning modelling resin
production distributions exists. Frequency distributions
presented by different authors are in accordance with the
data presented in this paper [21]. Peters [16] reports that
resin-yield distributions obtained by micro-chipping of
slash pine trees, were strongly skewed to the high-yield
side. We have observed that only 7 out of 40 distributions
studied were negatively skewed.
Table III. Descriptive statistics and parameter estimates for set-2 plots.
Descriptive Statistics Maximum Likelihood Parameter Estimates
WEIBULL CHAUDHRY & AHMAD
Plot Min Max Mean Sk Kur cbaµ
0
N1 0.73 4.85 3.07 –0.46 0.20 2.71 3.30 0.07 1.85
N2 1.78 7.13 4.11 0.28 0.20 2.94 4.78 0.05 3.18
N3 1.30 3.80 2.32 0.63 –0.03 3.64 2.64 0.26 2.06
N4 1.08 6.55 3.26 0.91 –0.35 1.92 3.69 0.05 2.09
N5 2.35 5.58 4.15 –0.43 –0.61 3.88 4.34 0.12 3.75
N6 3.35 8.50 4.70 1.98 4.22 3.16 5.33 0.08 4.27
N7 1.30 6.70 3.86 0.34 –1.04 2.29 4.36 0.04 2.55
N8 1.23 5.80 3.35 0.05 –1.53 2.28 3.79 0.06 2.16
N9 2.17 6.88 4.61 0.10 –0.90 3.05 5.25 0.06 3.83
N10 0.75 3.30 1.79 0.84 –0.20 2.39 2.02 0.25 1.34
N11 2.23 6.03 3.64 0.87 0.64 3.20 3.93 0.12 3.21
N12 0.69 6.85 3.59 0.21 0.29 2.25 4.04 0.04 1.81
N13 2.18 6.00 3.83 0.35 –0.80 2.96 4.24 0.09 3.27
N14 1.76 5.81 4.05 –0.34 –1.78 2.56 4.47 0.06 3.09
N15 1.28 7.13 3.76 0.48 1.17 2.56 4.25 0.05 2.61
N16 1.73 6.75 3.73 0.70 –0.60 2.71 4.43 0.06 3.08
N17 0.95 5.50 2.98 0.25 –0.49 2.29 3.37 0.07 1.90
N18 0.95 5.38 3.10 0.11 –1.13 2.31 3.51 0.06 1.94
N19 0.98 2.85 2.00 –0.41 –0.27 4.13 2.20 0.34 1.68
N20 0.93 3.88 1.96 1.60 3.65 2.49 2.21 0.25 1.57
N21 1.03 4.70 2.57 0.52 1.79 2.85 2.88 0.13 1.93
N22 1.40 4.00 2.72 –0.24 –1.12 3.65 3.01 0.16 2.24
N23 1.03 5.43 2.60 1.27 0.47 1.96 2.95 0.09 1.83
N24 1.60 5.15 3.19 0.54 –0.75 2.82 3.76 0.11 2.62
N25 2.03 5.40 3.73 0.04 –1.58 2.78 4.18 0.09 3.13
N26 0.70 3.73 1.78 0.76 0.05 2.05 2.01 0.19 1.18
N27 1.15 4.90 2.73 0.39 –1.22 2.44 3.09 0.10 1.98
N28 0.95 3.98 2.54 0.10 –1.35 2.73 2.87 0.12 1.84
N29 0.63 3.68 1.81 1.39 3.62 2.50 2.03 0.25 1.34
N30 0.35 3.63 1.50 0.88 1.00 1.64 1.68 0.19 0.74
N31 0.68 3.60 1.68 1.08 1.93 2.18 1.90 0.23 1.16
N32 1.13 2.73 1.82 0.54 –1.04 3.67 2.01 0.49 1.60
N33 0.53 2.23 1.74 –1.50 2.70 4.54 1.90 0.30 1.25
N34 0.65 1.95 1.39 –0.25 –0.27 4.15 1.53 0.74 1.18
N35 0.58 3.53 2.03 0.10 –1.46 2.06 2.29 0.13 1.16
N36 0.28 2.33 1.33 0.24 –1.55 1.99 1.50 0.27 0.64
N37 0.53 3.93 2.18 0.03 –0.99 2.15 2.46 0.11 1.19
For symbol description see table I.
N. Nanos et al.
376
Our results indicate that the Chaudhry-Ahmad and the
Weibull function, when fitted by ML to the experimental
plots gave equal estimation errors. Chaudhry and Ahmad
[5] found that their function was better than the log-nor-
mal pdf in fitting data from diameters of even-aged stands
of Douglas-fir. They used the x
2
statistic to compare the
probability functions. In our opinion, the error index that
we developed to compare the probability functions, is
more suitable than the x
2
statistic, which has been also
used by other authors [10]. The reason is that this statis-
tic treats equally all deviations from the real frequencies,
regardless of the economic importance of the errors. We
preferred to weight the errors made by the models by giv-
ing greater weights to errors made at high production
classes.
Results suggest that the use of 10-tree samples permits
a good estimation of parameters of the Weibull function
while bigger samples are necessary for the Chaudhry-
Ahmad density function. Shiver [20] reports that using
50-tree sample plots, the Weibull function predicts diam-
eter distributions with less than 10% error in any diame-
ter class. Such sample sizes, although desirable, are not
feasible in the case of resin-yield distributions due to the
cost of data collection.
No major differences were detected between the
Weibull and the Chaudhry-Ahmad functions. Neverthe-
less, the best model should be chosen at later stages of the
modelling process, when parameters of both the probabil-
ity functions will be regressed against other, easily mea-
sured stand attributes.
Apart from the location and scale parameters, which
are known to be correlated with the mean of the distribu-
tion, the shape parameters were well correlated with the
within plot coefficient of variation. Those results are in
accordance with those obtained by Bondarev [4], who
found that the shape parameter of the Weibull function
was negatively correlated with the coefficient of age vari-
ation of pure larch stands. Especially the shape parameter
of the Weibull function has been traditionally interpreted
as the “skewness” parameter [2, 18], but in the case of
resin-yield distributions it should not be regarded as such
because the vast majority of the distributions are posi-
tively skewed. As we have shown, this parameter usually
lies in the interval from 1 to 3.6 and rarely shows higher
values. Inside this interval, the shape parameter is related
to the dispersion of the distribution. The bigger the dis-
persion the smaller the shape parameter.
The proposed probability functions are useful for pre-
dicting the stand resin production. Models based on resin-
yield distributions should be preferred against models of
the mean stand production because the formers provide
information about the variance of the production.
On the other hand, models of resin-yield distributions
can be useful for tree breeding purposes [17]. Tree breed-
ers have observed that the resin production distribution is
strongly skewed to the high yield classes [9, 16, 21], devi-
ating significantly from the normal distribution.
Nevertheless, the computation of the selection intensity
for superior individuals has been based on the assumption
of normality of the underlying distribution. Under this
assumption the intensity of selection is underestimated.
Figure 5. Regression models for the scale and location parameters (a) and for the shape parameters (b) of the probability functions.
(a) (b)
Resin production distributions
377
Acknowledgments: The authors whish to thank the
Junta de Castilla y León for the technical support. We are
also grateful to two anonymous referees, Nieves Cañadas,
Santiago Gonzalez-Martinez, and to Irena T. Farrell for
their comments on the manuscript. Special thanks to
Jesus de Miguel for his help in preparing the figures and
to Francisco Javier Auñon for his help in data collection.
This work was founded by INIA, project SC97-118.
REFERENCES
[1] Allué C., Allué M., Notas sobre la marcha ordenada del
monte “Pinar Viejo” (Coca, Segovia) I, in: Actas de la reunión
de Valsain, SECF, Madrid, 1994, pp. 295-306.
[2] Bailey R.L., Dell T.R., Quantifying diameter distribu-
tions with the Weibull function, For. Sci. 19 (1973) 97-104.
[3] Baldwin V.C.Jr., Peterson K.D., Burkhart H.E., Amateis
R.L., Dougherty P.M., Equations for estimating Loblolly pine
branch and foliage weight and surface area distributions, Can. J.
For. Res. 27 (1997) 918-927.
[4] Bondarev A., Age distribution patterns in open boreal
Dahurican larch forests of Central Siberia, For. Ecol. Manage.
93 (1996) 205-214.
[5] Chaudhry M.A., Ahmad M., On a probability function
useful in size modelling, Can. J. For. Res. 23 (1993) 1679-1683.
[6] De Groot P., Fleming R.A., Analysis and modelling of
cohort life tables of Jack pine seed cones, Can. J. For. Res. 24
(1994) 1579-1592.
[7] Deshmukh D.K., Characterization of Chir pine (
Pinus
roxburghii
Sargent) for resin yielding capacities, Indian
Forester,
June (1966) 368-390.
[8] Efron B., Bootstrap methods: another look at the jack-
knife, Ann. Statist. 7 (1979) 1-26.
[9] Goddard R.A., Peters W.J., Progress in the selection and
breeding of superior trees to upgrade gum yield, Naval Stores
Rev. 74 (1965) 4-5,13,15.
[10] Kershaw J.A., Maguire D.A., Crown structure in west-
ern hemlock, Douglas-fir and grand fir in western Washington:
horizontal distribution of foliage within branches, Can. J. For.
Res. 26 (1996) 128-142.
[11] Khatouri M., Dennis B., Growth-and-yield model for
uneven-aged
Cedrus atlantica stands in Morocco, For. Ecol.
Manage. 36 (1990) 253-266.
[12] Kilkki P., Maltamo M., Mykkänen R., Päivinen R., Use
of the Weibull function in estimating the basal area dbh-distrib-
ution, Silva Fenn. 23 (1989) 311-318.
[13] Maltamo M., Comparing basal area diameter distribu-
tions estimated by tree species and for the entire growing stock
in a mixed stand, Silva Fenn. 31 (1997) 53-65.
[14] Maltamo M., Puumalainen J., Päivinen R., Comparison
of beta and Weibull functions for modelling basal area diameter
distributions in stands of
Pinus sylvestris and Picea abies,
Scand. J. For. Res. 10 (1995) 284-295.
[15] Mergen F., Inheritance of oleoresin yield in Slash pine,
Naval Stores Rev. 64, 9 (1954) 8-20-9.
[16] Peters J.W., Variation in oleoresin yielding potential of
selected Slash pines, For. Sci. 17 (1971) 306-307.
[17] Prada M.A., Allué M., Gil L., Pardos J.A., Programa de
mejora genética de
Pinus pinaster Ait grandes productores de
miera en la provincia de Segovia, in: Actas de la reunión de
Madrid, SECF, Madrid, (1996) pp. 67-71.
[18] Rennolls K., Geary D.N., Rollinson T.J.D.,
Characterizing diameter distributions by the use of the Weibull
distribution, Forestry 58 (1985) 57-66.
[19] Reynolds M.R.Jr., Burk T., Huang W.C., Goodness-of-
fit tests and model selection procedures for diameter distribu-
tion models, For. Sci. 34 (1988) 373-399.
[20] Shiver B.D., Sample sizes and estimation methods for
the Weibull distribution for unthinned Slash pine plantation
diameter distributions
, For. Sci. 34 (1988) 809-814.
[21] Squillace A.E., Combining superior growth and timber
quality with high gum yield in Slash pine, in: 8th South Conf.
Forest Tree Impr. Proc. (1965) pp. 73-76.