Báo cáo khoa học: "Evidence of osmoregulation in Larix decidua at Alpine treeline and comparative responses to water availability of two co-occurring evergreen species" potx
Bạn đang xem bản rút gọn của tài liệu. Xem và tải ngay bản đầy đủ của tài liệu tại đây (143.04 KB, 11 trang )
Original article
Evidence of osmoregulation in Larix decidua
at Alpine treeline and comparative responses to water
availability of two co-occurring evergreen species
Alessandro Badalotti
a,*
, Tommaso Anfodillo
b
and John Grace
a
a
University of Edinburgh, Institute of Ecology and Resource Management, Darwin Building, Mayfield Road,
Edinburgh EH9 3JU, Scotland, U.K.
b
Dipartimento Territorio e Sistemi Agro Forestali, University of Padova, Agripolis, Via Romea, 16, 35020 Legnaro (PD), Italy
(Received 18 November 1999; accepted 12 May 2000)
Abstract – The water relations of three coniferous species (Larix decidua, Picea abies and Pinus cembra) growing at a treeline eco-
tone in the Southern Alps were investigated. Sap flux and xylem water potential were measured in two individuals of each of the
above-mentioned species during part of summer 1997. Throughout the growing period,
L.decidua showed a gradual decrease in min-
imum water potential while for
P.abies and P.cembra, variations were more correlated to actual weather conditions. Daily sap flux
was also higher in
L.decidua than in the two other species. Pressure-volume curves derived for L.decidua during July 1997 demon-
strated that the species further diminished its minimum water potential through osmoregulation. During dry periods the other species
showed an evident reduction in sap flux suggesting a water saving behaviour. The three species seem therefore to have evolved dif-
ferent drought avoidance strategies.
osmotic adjustment / Pinus cembra / Picea abies / sap flow / pressure-volume curves
Résumé
– Évidence d'un ajustement osmotique chez Larix decidua à la limite de l'étage forestier alpin et réponses comparées
à la disponibilité en eau de deux espèces de conifères co-existantes.
On a étudié les stratégies hydriques de trois espèces de coni-
fères (
Larix decidua, Picea abies et Pinus cembra) qui poussent dans un écotone à la limite supérieure de l'étage forestier dans le sud
des Alpes. On a mesuré le flux de sève et le potentiel hydrique du xylème pour deux individus des espèces citées précédemment pen-
dant une partie de l'été 1997. Durant la période de végétation,
L. decidua a montré une diminution progressive du potentiel hydrique
minimum tandis que les variations de
P.abies et de P.cembra étaient corrélées en grande partie aux conditions atmosphériques. Le
flux de sève journalier aussi était plus important chez
L. decidua que dans les deux autres espèces. Les courbes pression-volume éta-
blies pour
L.decidua au mois de juillet 1997 montrent que l'espèce est en mesure de diminuer ultérieurement son potentiel hydrique
minimum à travers un ajustement osmotique. Pendant les périodes de sècheresse, les autres espèces ont manifesté une réduction
visible du flux de sève suggérant ainsi un comportement adapté pour limiter la consommation d'eau. Les trois espèces semblent donc
avoir développé des stratégies différentes pour éviter la sécheresse.
ajustement osmotique / Pinus cembra / Picea abies / flux de sève / courbes pression-volume
Ann. For. Sci. 57 (2000) 623–633 623
© INRA, EDP Sciences
*Correspondence and reprints
Tel. 0131 650 5437; Fax. 0131 662 0478; e-mail:
A. Badalotti et al.
624
Abbreviations
F
d
: Sap flux density (dm
3
dm
-2
h
-1
)
PAR: Photosynthetic active radiation (µmol m
-2
s
-1
)
R: Hydraulic resistance (MPa dm
-1
h)
RTLP: Relative water content at turgor loss point
RWC: Relative water content
VPD: Vapour pressure deficit (hPa)
WPTLP: Water potential at turgor loss point (MPa)
ε
max
: Maximum elastic modulus
of the cell wall (MPa)
ψ: Xylem water potential (MPa)
ψ
m
: Minimum xylem water potential (MPa)
ψ
pd
: Predawn xylem water potential (MPa)
ψ
π
: Osmotic potential (MPa)
ψ
π 100
: Osmotic potential at full turgor (MPa)
1. INTRODUCTION
In the last few years a renewed interest in the physiol-
ogy of plants growing at treeline has been sparked by the
realisation that global climate change could have a
marked effect on the treeline ecotone [3, 13]. Treelines
are controlled by a range of environmental factors in dif-
ferent parts of the world with temperature usually identi-
fied as the main one [15]. The treelines of the Alps
appear to be determined, at least in part, by winter and
spring desiccation of needles when the soil is frozen.
This has been attributed to an incomplete development
of the needle cuticle during the short growing period [30,
37], although this is not usually the case in more mar-
itime regions [10, 11].
Recent evidence suggests that climate changes can
affect the distribution of plant communities and shift the
range of various alpine species [19, 21] and climate
warming has been thought to be the cause of an altitudi-
nal shift upwards in alpine plants [9]. However, no evi-
dent effects of recent higher summer temperatures on alti-
tudinal range have been recorded in alpine Pinus
sylvestris and Pinus cembra [14]. A better understanding
of tree physiology at the treeline is needed in order to pre-
dict possible future scenarios brought about by climate
change. Indirect effects (such as the duration of snow
cover or the amount of water in the soil) appear to be
more important than direct temperature effects on life
processes [18]. Climate scenarios suggest lower rainfall
and more frequent droughts [36], which may influence
species distributions as a consequence of species variabil-
ity in water relations [7]. It follows that the seasonal mon-
itoring of water status in trees at treeline should increase
our understanding over how climate change can affect
their distribution. Recently, drought resistance mecha-
nisms of different species at treeline have been studied in
the Southern Alps [2]. Although trees growing at the
alpine treeline only rarely undergo severe water stress
because of high precipitation during the vegetative peri-
od, moderate water deficits may lead to a strong reduc-
tion of transpiration due to a high stomatal sensitivity to
drought. Tree species found at treeline show a well-devel-
oped water-saving behaviour, probably induced by the
low soil water content due to the shallow mountain soils.
Some species (such as Larix decidua) appear to cope with
these moderate water deficits better than others (Picea
abies and P. cembra). Studies carried out on a treeline
ecotone in the Italian Alps hypothesised the occurrence of
osmoregulation in L. decidua during periods of drought.
Osmoregulation can contribute to the maintenance of tur-
gor during periods of water stress and could therefore
increase the chances of this species to compete with the
other treeline species for the colonisation of the alpine
areas rendered suitable to seedling establishment in the
case of climate warming. In this article we will discuss
the importance of this phenomenon in relation to drought
response and competitive abilities of these three species.
2. MATERIALS AND METHODS
2.1. Study site
The experiments were conducted on a treeline ecotone
(sensu Crawford [5]) at 2080 m above sea level in the
Southern Alps (Italian Dolomites, Cortina d’Ampezzo).
The site has a Southern aspect and 30% slope, with shal-
low calcareous soil. The treeline is formed by mixed
stands of relatively young L. decidua, P. cembra and
P. abies which are invading edges of recently abandoned
pasture [8]. June-September mean precipitation is
450–500 mm.
Six trees (the same ones used in another study [2] dur-
ing 1996) were used for the experiment, two for each of
the above-mentioned species (table I).
2.2. Xylem water potential
Xylem water potential (Ψ) was measured for seven
days (from 1 July to 23 August 1997; days 182–235) on
1-year-old shoots. Two shoots were collected at a height
of 2 m on each tree from predawn (Ψ
pd
) to dusk at inter-
vals of 2 hours and measurements were made directly at
the site with a pressure chamber within two minutes of
collection. Data were then averaged since no significant
(p = ns) statistical difference was recorded between indi-
viduals of the same species (table III).
Osmoregulation in L. decidua
625
2.3. Sap flux density
Xylem sap flux density (F
d
, dm
3
dm
-2
h
-1
) was mea-
sured in each tree using 2 cm continuously-heated sap
flowmeters [12]. Sensors were inserted into the xylem
(NW aspect) at 1.5–2 m. Measurements were taken
every minute, averaged and stored every 15 minutes
using a storage module connected to a datalogger (CR10,
Campbell Ltd, Lincoln, Nebraska). Protection from high
solar radiation was ensured, both by insulating shields
placed over the sensors in the case of L. decidua and by
the dense tree crowns reaching to the ground for
P. abies
and P. cembra. Sap flux density was measured from 17
June to 13 October 1997 (days 168–286). Sapwood area
and total tree transpiration were not estimated because of
the uncertainty in defining the number of active tree
rings and the contribution of each of them to the total
water transport.
2.4. Hydraulic resistance
The sapwood-specific hydraulic resistance between
soil and needles was calculated from the relationship
between needle water potential and sap flux density:
R
soil-needle
=
(Ψ
needle
– Ψ
soil
)
F
d
Where R
soil-needle
is the sapwood-specific hydraulic resis-
tance between soil and needles (MPa dm
-1
h), Ψ
soil
and
Ψ
needle
are the soil and needle water potential respective-
ly (MPa) and F
d
the sap flux density (dm
3
dm
-2
h
-1
).
2.5. Pressure-volume curves
Ten pressure-volume curves were derived for
L.decidua at the site and two for P. cembra at irregular
intervals in the period between 29 June and 2 August
(days 180–214). Samples were always taken from the S
exposed canopy at a height of 1.5–2.5 m from the ground
in the evening hours of the day previous to the day of the
measurement, sealed in a polythene bag to reduce evapo-
rative loss of water and taken to the laboratory. Here cut
ends of the shoots were immersed in water and the
shoots were left rehydrating for 12–15 hours in the dark-
ness for the whole night [26, 34].
The pressure-volume curves were constituted as the
standard method described in the literature [33] suggests,
collecting data by using a pressure chamber [28]. A wet
piece of blotting paper was enclosed in the pressure
chamber in order to prevent evaporative loss during the
measurements [31,34]. Pressure was increased slowly
(0.01 MPa s
-1
) during the measurements, until a droplet
of xylem sap appeared on the section of the shoot.
In some samples Ψ remained almost constant with tis-
sue dehydration in the region of high turgor potential
[25]. This particular “plateau effect” is believed to be an
artefact caused by oversaturation of samples [20] even if
observed in naturally rehydrated plants [25].
In order to minimise the plateau effect, the raw data
were plotted and, after having excluded the points where
this effect was evident, the real saturated weight (Ψ=0)
of the shoots was extrapolated using a linear regression
of fresh weight against balance pressure as suggested in
the literature [22].
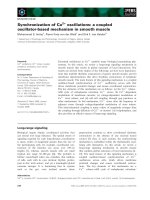
Curves were then analysed using a segmented non-
linear regression algorithm [26] fitted on a modified
exponential model described in the literature [29]. When
the plateau effect was minimum the model used fitted
the experimental data very well (figure 1). In other cases
a slight difference appeared in the region of high turgor
pressure. However, for all curves, the variance explained
from the model exceeded 0.972 (table II). All curves and
parametric values inferred from them were derived sepa-
rately and then averaged for display in the figures. This
was not possible for L.decidua for day 208 and 212, in
which only one curve was available.
2.6. Microclimate
Standard meteorological variables above the canopy
(global radiation, air temperature, relative humidity,
wind velocity and direction, rainfall and photosynthetic
active radiation) were monitored every minute, averaged
and stored every 15 minutes with a datalogger (Campbell
Table I. Main features of the sampled trees including their age
as calculated from sample cores the year before the study, their
diameter at breast height (1.3 m) and their height.
Tree Age Diameter Height
(years) at breast height (cm) (m)
L. decidua #1 38 24.2 10.2
L. decidua #2 59 25.1 9.6
P. abies #1 54 25.1 9.3
P. abies #2 53 30.9 11.1
P. cembra #1 36 27.3 7.2
P. cembra #2 47 33.4 7.9
A. Badalotti et al.
626
Ltd CR10) connected to two multiplexers (Campbell
AM32). A solar panel (Helios technology 50 W) and bat-
teries (140 Ah) provided power.
2.7. Soil water
Relative soil moisture content was measured with time
domain reflectometry (Campbell CS615) at 30 cm depth
with a water content reflectometer from 11 June (day
162) to 13 October (day 286). These measurements are
expressed as relative values in relation to the maximum
value recorded after high precipitation occurred (i.e. rela-
tive soil water content compared to soil holding capacity).
3. RESULTS
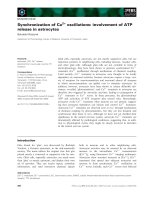
During summer 1997 (June–September) an above-
average rainfall of 652.6 mm was recorded (figure 2a).
However, an unusually dry period occurred from
9 September (day 252) to 13 October (day 286 and end
of the measurements) (figure 2b).
The maximum mean air temperature was reached at
the beginning of September (about 15
°C), just after a
cool spell at the end of August.
3.1. Shoot water potential
Figure 3 shows the seasonal course of predawn water
potential (Ψ
pd
) and minimum water potential (Ψ
m
) for
the selected trees. P. abies was the species with the high-
est values of Ψ
pd
, dropping below –0.4 MPa only during
August and maintaining a fairly constant value through-
out the study period. L. decidua and P. cembra showed
parallel variations for most of July (days 182–204).
While in P. cembra Ψ
pd
became less negative at the end
of July, in L.decidua it continued to decrease to a mini-
mum (–1.07 MPa) at the end of August (day 235).
Minimum water potentials (Ψ
m
) of P. abies and
P. cembra displayed parallel time courses during most of
July (days 190-211). However, while P. abies reached its
minimum (–1.48 MPa) at the end of August (day 235),
the minimum for P. cembra (–1.28 MPa) was reached at
the end of July (day 211). L.decidua Ψ
m
continued to
decrease throughout the study period, with a different
pattern than in the other two species and reaching its
minimum (–2.23 MPa) at the end of August (day 235).
Different statistical tests showed that there was a
highly significant effect of species and, in some cases,
time of the season on the values of Ψ
pd
and Ψ
m
(table III). However, differences between individuals
were not significant.
3.2. Daily and seasonal variations
in sap flux density
Daily fluctuations in water potential, in relation to
meteorological parameters and sap flux density, are
shown for two representative days in figure 4. Because
of the frequent and rapid variations in cloudiness at high
altitude, air temperature, vapour pressure deficit (VPD)
and solar radiation changed abruptly.
Sap flux of all species was visibly coupled with VPD.
In L. decidua F
d
increased sharply and reached the daily
maximum by mid morning. Ψ decreased rapidly and Ψ
m
was usually reached by 10 AM. Once the minimum was
Table II. Values of the variance explained (R
2
) of each of the
pressure-volume curves drawn.
a = Larix decidua, b = Pinus
cembra.
Date Day of year R
2
a
29-Jun 180 0.998
29-Jun 180 0.99
16-Jul 197 0.972
16-Jul 197 0.98
27-Jul 208 0.992
31-Jul 212 0.998
02-Aug 214 0.972
02-Aug 214 0.986
b
01-Aug 213 0.999
01-Aug 213 0.998
Figure 1. Example of accuracy of model (line) derived pres-
sure-volume curve and experimentally derived data (points) for
day 180 (29 June).
Osmoregulation in L. decidua
627
reached, Ψ increased slowly compared to the rapid fall in
the morning.
F
d
in P. abies and P. cembra increased later
and the maximum daily values were much lower than
those of
L. decidua. It is interesting to notice that when
VPD was high at night (1–3 hPa) there was a detectable
sap flux occurring in L.decidua as shown in day 190 in
figure 4. The other two species however did not show
nocturnal transpiration.
3.3. Seasonal variation in hydraulic resistance
Sapwood-specific hydraulic conductance (1/R
soil-needle
)
and hydraulic resistance (R
soil-needle
) were calculated for
the three species during the study period (figure 5) and
showed different trends for each of the species studied.
In L.decidua, R
soil-needle
increased constantly throughout
the month of July, reaching its maximum (0.6 MPa
dm
–1
h) at the end of July (day 211) and then decreasing
during August. In P. abies, after some initial fluctua-
tions, R
soil-needle
increased from July to August reaching
its maximum (0.45 MPa dm
-1
h) at the end of August
(day 235). P.cembra showed a highly fluctuating trend
reaching its maximum (0.51 MPa dm
-1
h) on day 211
only to decrease sharply in August. Regression lines for
R
soil-needle
were good for all cases of L. decidua and
P.abies but only for two of P.cembra.
3.4. Pressure-volume curves
Pressure-volume curves for L. decidua were derived
during five different days from the end of June to the
beginning of August and two curves for P. cembra were
derived at the beginning of August (day 213).
Figure 2. Comparison of seasonal trends in daily precipitation, mean daily air temperature (a) and relative soil moisture content at
30 cm depth (b).
Table III. Results of the statistical tests used to detect signifi-
cant differences between time of the season (results differ from
species to species), species and individuals regarding the data
for Ψ
pd
and Ψ
m
.
Predawn water Minimum water
potential (Ψ
pd
) potential (Ψ
m
)
Time of season*
L. decidua p < 0.001 p < 0.001
P. abies p = ns p < 0.01
P. cembra p = ns p = ns
Species* p < 0.0001 p < 0.0001
Individuals
#
p = ns p = ns
* Kruskal-Wallis test,
#
Wilcoxon test.
A. Badalotti et al.
628
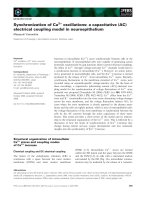
A number of parameters estimated from the pressure-
volume curves are shown in figure 6. Both osmotic
potential at full turgor (Ψ
π100
) and water potential at tur-
gor loss point (WPTLP) reached their maximum value
on day 197 in L.decidua, before decreasing to their mini-
mum at the beginning of August (day 214). The values
obtained on day 213 for P.cembra were slightly higher.
The relative water content at turgor loss point (RTLP)
and the maximum elastic modulus derived from the pres-
sure-volume curves (ε
max
) in L.decidua increased during
the study period reaching their maxima at the beginning
of August.
P.cembra showed a much lower value than L.decidua
on day 213 for both, RTLP and ε
max
.
4. DISCUSSION
4.1. Pressure-volume curves
The main aim of the research was to assess the extent
of osmoregulation in L. decidua and the compared
responses to water availability of two co-occurring ever-
green species. We concentrated on L.decidua as a previ-
ous study [1] on P.abies pressure-volume curves had
Figure 3. Variations of predawn water potential (Ψ
pd
) and minimum water potential (Ψ
m
) for L. decidua, P. abies and P. cembra dur-
ing the study period. Bars = 1
± SE.
Osmoregulation in L. decidua
629
shown that no osmoregulation occurred in this species
and no further experiments seemed necessary. In P. cem-
bra, pressure-volume curves were very difficult to derive
because of very high resin emissions during the dehydra-
tion phase and early attempts were unsuccessful.
We realise that the number of curves at our disposal is
not enough for an in-depth study of the behaviour of the
species. However, comparison of pressure-volume
curves of
L. decidua during the growing season allowed
us to suggest whether osmoregulation had occurred or
not. The latter is a process by which cell turgor is main-
tained by means of increases in cell solute content (low-
ering
Ψ
π
) in response to water stress [17, 24] or when
new organs are expanding [24, 32]. It may be a very
important mechanism for maintaining physiological
activity as Ψ falls, although some authors report it may
be of little importance in conifers [16].
The decrease in
Ψ
π100
by about 0.6 MPa was indica-
tive of osmoregulation (figure 6a). This brings about a
substantial decrease in WPTLP which in turn could
enhance the water extraction capacity of the species (fig-
ure 6a).
Figure 4. Daily fluctuations of environmental conditions (temperature, PAR, VPD) (a) in relation to sap flux density (F
d
) (b) and
shoot water potential (
Ψ) (c). Days 190 (9 July) and 235 (23 August). Bars = 1 ± SE.
A. Badalotti et al.
630
Since stomata conductance is maintained higher also
under water deficit, leaf water potential decreases more
than in absence of osmoregulation.
A lower leaf water potential means also a stronger
decrease in xylem water potential due to the “propaga-
tion” of the water potential gradient among different
plants compartments. A lower xylem water potential
means, in turn, a lower water potential up to the fine
roots. Since the water uptake depends also on the capaci-
ty to decrease the water potential, osmoregulation, in the
end, should have the effect of increasing the water
uptake capacity. Moreover, osmotic adjustment should
allow to maintain turgor in root cells at lower water
potential [27 in 32], leading to a more effective root
elongation. Plants can, therefore, explore a greater vol-
ume of soil increasing the capacity of water uptake.
At the same time an increase in the elastic modulus of
the cell wall (
ε
max
) has been observed, a feature usually
associated with the capacity to withstand low water
potentials (figure 6c).
It is also important to notice that between day 200 and
day 214 there was a progressive decrease in precipitation
and relative soil moisture (figure 2b) which is likely to
have increased the water stress to which the trees were
subjected. Hence the species enhanced its water uptake
ability in mid-summer when the occurrence of moderate-
ly water deficits is most likely.
It would be risky to draw definite conclusion about
the reasons for the occurrence of osmoregulation with
the few curves we have derived but nonetheless they
allow us to make some considerations. It seems unlikely
that osmoregulation be the effect of ontogenetic changes
since a parallel experiment conducted the same year [6]
clearly showed that needle growth in L.decidua finished
on days 188–190 well before the beginning of the
decrease in Ψ
π
we have found. In fact on the first day of
measurements (day 180) needles and shoots were still
expanding [6] but Ψ
π100
was higher than some weeks
later (figure 6a). It should have been the opposite if an
ontogenetic cause was involved. Furthermore, it has
Figure 5. Comparison of hydraulic conductance in L. decidua (a), P. abies (b) and P. cembra (c) on day 235 (23 August). Seasonal
variations in hydraulic resistance (
R) for L. decidua, P. abies and P. cembra are shown below in (d).
Osmoregulation in L. decidua
631
been reported [24] that if plants are hardened by expo-
sure to larger diurnal fluctuation in humidity and solar
radiation (as it occurs at high altitude) the capacity of
osmoregulation may remain unchanged or increase with
age without water stress being involved.
4.2. Daily shoot water potential
and sap flux density variations
Values of Ψ
m
in P. abies were less negative than in
similar studies conducted in other parts of the Alps [23]
but more negative than those found at the same site the
year before [2]. Moreover, Ψ
m
was above the turgor loss
point, which at the alpine treeline was found to be rela-
tively constant throughout the growing season at
about –2.8 MPa [1]. Relatively high values of Ψ
m
sug-
gest that stomatal control may occur well above the
threshold of significant loss of xylem functionality in
conifers growing under similar environmental condi-
tions, found to be between –2.5 and –3 MPa [4]. Daily
variations of VPD and
F
d
in L.decidua were visibly cou-
pled (figure 4). This does not only occur in diurnal hours
Figure 6. Seasonal trends for WPTLP and Ψ
π100
(a), RTLP (b) and ε
max
(c) as obtained from the analysis of the pressure–volume
curves. Bars = 1
±SE apart from values for day 208 and 212 in which they are absent since only one value was available.
A. Badalotti et al.
632
but also during the night and early morning provided
VPD has a value of 1 hPa or higher. This behaviour
might be explained by the fact that cuticle conductance
is rather high leading to a detectable nocturnal transpira-
tion in relation to changes in VPD.
In all species F
d
appears to be especially well correlat-
ed to VPD below the threshold of 7–8 hPa but when
VPD is higher, the high stomatal sensitivity leads to a
reduction of the expected F
d
(see day 190 in figure 4) as
already observed in a precedent study [2].
Variations of daily Ψ in P.abies and P.cembra are
closely coupled to variations in VPD and photosynthetic
active radiation (PAR) (figure 4). Daily water potential
variations (especially Ψ
m
) in L.decidua appear to depend
on seasonal meteorological trends rather than daily ones
as in P.abies and P.cembra. This is probably ascribable
to internal physiological adjustments associated with
osmoregulation. This is consistent with the results of
another study [35] which concludes that deciduous
species (L.decidua) use almost exclusively groundwater
while evergreen species (P.abies and P.cembra) use
rainwater to a larger extent. The same study demonstrat-
ed that L.decidua develops a deep root system which
allows utilisation of water sources in the deepest and
wettest soil layers which are precluded for instance to
P.abies because of its shallow root system.
The lower Ψ
pd
measured in L.decidua at the end of
July and in August might depend on nocturnal transpira-
tion which prevents that an equilibrium between plant
and soil be achieved during the night. Therefore the
extractive capacity of the tree cannot be inferred from
the analysis of Ψ
pd
only but VPD and F
d
must also be
taken into account.
As expected, under non-limiting soil moisture condi-
tions, L.decidua exhibited a F
d
higher than the other two
evergreen species.
4.3. Hydraulic resistance
It is unlikely that significant cavitation of water in the
xylem occurred in these species. Even in L.decidua with
the lowest Ψ
m
, the measurements of Ψ
m
in this study and
in an earlier one [2] are all well above the threshold of
~ 3.0 MPa which is when most (but not all) conifer
species undergo a consistent loss in xylem conductivity
[4]. The increase in overall hydraulic resistance R in
L.decidua is likely to be caused by increased resistance
at the soil-root interface. It appears that this may be the
way that soil moisture influences species also at the tree-
line. In function of its lower Ψ
m
, L.decidua is able to
uptake more water in drier conditions than do P.abies
and P.cembra which appear to be more susceptible to
water shortage. Thus the results confirm what had
already been found in a previous study [2] that despite
high precipitation, soils at high altitude can become
physiologically dry because they are shallow, discontin-
uous and highly permeable.
4.4. Conclusions
Data presented suggests that L.decidua is able to
accumulate solutes within cells decreasing the osmotic
component of water potential. This behaviour may allow
the species to maintain a high stomatal conductance at
lower water potential. Osmoregulation is rarely docu-
mented in conifers but L.decidua might be an exception
perhaps because of its deciduous habit. We do not know
yet whether low altitude ecotypes show a similarly pro-
nounced capacity in accumulating solutes but it might be
speculated that the shorter growing season and the lower
soil water capacity might lead to an enhancement of the
osmoregulation capacity in high altitude trees.
Compared to other two co-occurring conifers,
L.decidua seems to be more adapted to continue carbon
assimilation when mild water deficit conditions occur
and seems to be less sensitive to soil water shortage as
well.
Although it is not possible to draw definitive conclu-
sions from this study, it can be imagined that if precipita-
tion rate, regimes and cloudiness should change towards
more xeric conditions as hypothesised recently [36],
L.decidua might be advantaged and a change in high
altitude forest composition might occur.
Acknowledgements: This research was carried out
with the financial support of the Ministry of University
and Scientific and Technological Research (MURST)
funds ex40%. Special thanks go to Fausto Fontanella,
Roberto Menardi and Giuseppe Sala of the Centre of
Alpine Environment, San Vito di Cadore, for the pre-
cious technical support. We would also like to thank
three anonymous reviewers for their comments and sug-
gestions.
REFERENCES
[1] Anfodillo T., Casarin A., Variazioni stagionali nelle
relazioni idriche di rametti di abete rosso lungo un gradiente
altitudinale, in: Anfodillo T., Urbinati C. (Eds.) Ecologia delle
foreste di alta quota, Proc. XXX Corso di Cultura in Ecologia,
University of Padova, 1993, pp. 143–171.
[2] Anfodillo T., Rento S., Carraro V., Furlanetto L.,
Urbinati C., Carrer M., Tree water relations and climatic varia-
tions at the alpine timberline: seasonal changes of sap flux and
Osmoregulation in L. decidua
633
xylem water potential in Larix decidua Miller, Picea abies (L.)
Karst. and
Pinus cembra L., Ann. Sci. For. 55 (1998) 159–172.
[3] Chapin III F.S., Körner Ch., Arctic and alpine biodiver-
sity: patterns, causes and ecosystem consequences, Trends
Ecol. Evol. 9 (1994) 45–47.
[4] Cochard H., Vulnerability of several conifers to
embolism, Tree Physiol. 11 (1992) 73–83.
[5] Crawford R.M.M., Polar and altitudinal limits to tree
survival, in: Crawford R.M.M. (Ed.), Studies in plant survival:
ecological case histories of plant adaptation to adversity,
Blackwell Scientific Pub., Oxford, 1989, pp. 77–103.
[6] Dandrea M., (1999) Dinamica di accrescimento di rami
e foglie in conifere al limite superiore del bosco, Final theses at
the University of Padova, 1999, p. 30.
[7] Dawson D.E., Spatial and physiological overlap of three
co-occurring alpine willows, Funct. Ecol. 4 (1990) 13–25.
[8] Del Favero R., De Mas G., Lasen C., Paiero P., Il pino
cembro nel Veneto, Regione del Veneto, Dip. Foreste. (1985)
85.
[9] Grabbher G., Gottfried M., Pauli H., Climate effects on
mountain plants, Nature 369 (1994) 448.
[10] Grace J., Tree lines, Phil. Trans. R. Soc. Lond. B, 324
(1989) 233–245.
[11] Grace J., James J., Physiology of trees at treeline, in:
Alden J., Mastrantonio J.L., Odum S. (Eds.), Forest develop-
ment in cold climate, Plenium Press, New York, 1993, pp.
105–114.
[12] Granier A., Une nouvelle methode pour la mesure de
flux de seve brute dans le tronc des arbres, Ann. Sci. For. 42
(1985) 193–200.
[13] Guisan A., Holten J.I., Spichiger R., Tessier L.,
Potential ecological impacts of climate change in the Alps and
Fennoscandian Mountains, Editions des Conservatoire et Jardin
Botaniques Geneve, Geneva, 1995.
[14] Hattenschwiler S., Körner Ch., Responses to recent cli-
mate warming of
Pinus sylvestris and Pinus cembra within
their montane transition zone in the Swiss Alps, J. Veg. Sci. 6
(1995) 357–368.
[15] Holtmeier F.K., The upper timberline: ecological and
geographical aspects, in: Anfodillo T., Urbinati C. (Eds.)
Ecologia delle foreste di alta quota, Proc. XXX Corso di
Cultura in Ecologia, Universtity of Padova, 1993, pp. 1–26.
[16] Joly R.D., Zaer J.B., Alteration of cell-wall water con-
tent and elasticity in Douglas-fir during periods of water
deficit, Plant Physiol. 83 (1987) 418–422.
[17] Jones H.G., Plants and microclimate, 2nd edition.
Cambridge University Press, 1992.
[18] Körner Ch., Impact of atmospheric changes on alpine
vegetation: the ecophysiological perspective, in: Guisan A.,
Holten J.I., Spichiger R., Tessier L., (Eds.), Potential
Ecological Impacts of Climate Change in the Alps and
Fennoscandian Mountains, Editions des Conservatoire et Jardin
Botaniques Geneve, Geneva, 1995, pp. 113–120.
[19] Krauchi N., Potential impacts of climate change on for-
est ecosystems, Eur. J. For. Path. 23 (1993) 28–50.
[20] Kubiske M.E., Abrams M.D., Pressure-volume rela-
tionships in non-rehydrated tissue at various water deficits,
Plant, Cell Environ. 13 (1990) 995–1000.
[21] Kullman L., Short-term dynamic approach to tree-limit
and thermal climate: evidence from
Pinus sylvestris in the
Swedish Scandes, Ann. Bot. Fenn. 25 (1986) 219–227.
[22] Ladiges P.Y., Some aspects of tissue water relations in
three populations of
Eucalyptus viminalis Labill., New Phytol.
75 (1975) 53–62.
[23] Lu P., Biron P., Breda N., Granier A., Water relations
of adult Norway spruce (
Picea abies (L.) Karst.) under soil
drought in the Vosges mountains: water potential, stomatal
conductance and transpiration, Ann. Sci. For. 52 (1995)
117–129.
[24] Morgan J.M., Osmoregulation and water stress in high-
er plants, Ann. Rev. Plant Physiol. 35 (1984) 299–319.
[25] Parker W.C., Pallardy S.G., The influence of resatura-
tion method and tissue type on pressure-volume analysis of
Quercus alba L. seedlings, J. Exp. Bot. 38 (1987) 535–549.
[26] Ritchie G.A., Shula R.G., Seasonal changes of tissue-
water relations in shoots and root systems of Douglas fir
seedlings, Forest Sci. 30 (1984) 538–548.
[27] Sharpe R.E., Davies W.L., Solute regulation and
growth by roots and shoots of water-stressed maize plants,
Planta 147 (1979) 43–49.
[28] Scholander P.F., Hammel H.T., Bradstreet E.D.,
Hemmingsen E.A., Sap pressure in vascular plants, Science
148 (1965) 339–346.
[29] Schulte P.J., Hinckley T.M., A comparison of pressure-
volume curve data analysis techniques, J. Exp. Bot. 36 (1985)
1590–1602.
[30] Tranquillini W., Physiological ecology of the alpine
timberline, Ecological Studies 31, Springer-Verlag, Berlin,
1979.
[31] Turner N.C., Techniques and experimental approaches
for the measurement of plant water status, Plant and Soil 58
(1981) 339–366.
[32] Turner N.C., Adaptation to water deficits: a changing
perspective, Aust. J. Plant Physiol. 13 (1986) 175–190.
[33] Tyree M.T., Hammel H.T., The measurement of the
turgor pressure and the water relations of plants by the pres-
sure-bomb technique, J. Exp. Bot. 23 (1972) 267–282.
[34] Tyree M.T., MacGregor M.E., Petrov A., Upenieks
M.I., A comparison of systematic errors between the Richards
and Hammel methods of measuring tissue-water relations para-
meters, Can. J. Bot. 56 (1978) 2153–2161.
[35] Valentini R., Anfodillo T., Ehleringer J.R., Water
sources and carbon isotope composition (d
13
C) of selected tree
species of the Italian Alps, Can. J. For. Res. 24 (1994)
1575–1578.
[36] Wanner H., Beniston M., Approaches to the establish-
ment of future scenarios for the alpine region, in: Guisan A.,
Holten J.I., Spichiger R., Tessier L. (Eds.), Potential Ecological
Impacts of Climate Change in the Alps and Fennoscandian
Mountains, Editions des Conservatoire et Jardin Botaniques
Geneve, Geneva, 1995, pp. 87–95.
[37] Wardle P., An explanation for alpine timberline, New
Zealand J. Bot. 9 (1971) 371–402.