Báo cáo y học: "Self-rated health showed a consistent association with serum HDL-cholesterol in the cross-sectional Oslo Health Study" pptx
Bạn đang xem bản rút gọn của tài liệu. Xem và tải ngay bản đầy đủ của tài liệu tại đây (155.84 KB, 10 trang )
Int. J. Med. Sci. 2007, 4
278
International Journal of Medical Sciences
ISSN 1449-1907 www.medsci.org 2007 4(5):278-287
© Ivyspring International Publisher. All rights reserved
Research Paper
Self-rated health showed a consistent association with serum
HDL-cholesterol in the cross-sectional Oslo Health Study
Sissel E. Tomten
1
and Arne T. Høstmark
2
1. Norwegian School of Sport and Physical Education, Box 4014 Ullevål Hageby, 0806 Oslo, Norway
2. University of Oslo, Norway, Section of Preventive Medicine and Epidemiology, Box 1130 Blindern, 0318 Oslo, Norway
Correspondence to: Sissel E. Tomten, PhD, The Norwegian School of Sport and Physical Education, PO Box 4014 Ullevål Hageby, 0806
Oslo, Norway. Tlf : +47 23 26 23 69; Fax: +47 23 26 24 51; e-mail:
Received: 2007.05.03; Accepted: 2007.11.16; Published: 2007.11.20
Objective: To examine the association between serum HDL-cholesterol concentration (HDL-C) and self rated
health (SRH) in several age groups of men and women.
Study design and setting: The study had a cross-sectional design and included 18,770 men and women of the
Oslo Health Study aged 30; 40 and 45; 69-60; 75-76 years.
Results: In both sexes and all age groups, SRH (3 categories: poor, good, very good) was positively correlated
with HDL-C. Logistic regression analysis on dichotomized values of SRH (i.e. poor vs. good health) in each age
group of men and women showed that increasing HDL-C values were associated with increasing odds for
reporting good health; the odds ratio (OR) was highest in young men, and was generally lower in women than in
men. Odds ratios in the 4 age groups of men were 4.94 (2.63-9.29), 2.25 (1.63-3.09), 2.12 (1.58-2.86), 1.87 (1.37-2.54);
and in women: 3.58 (2.46-5.21), 2.81 (2.23-3.53), 2.28 (1.84-2.82), 1.61 (1.31-1.99). In the whole material, 1 mmol/L
increase in HDL-C increased the odds for reporting good health by 2.27 (2.06-2.50; p<0.001), when adjusting for
sex, age group, time since food intake and use of cholesterol lowering drugs. Chronic diseases, pain,
psychological distress, smoking, alcohol, length of education, and dietary items did not have any major influence
on the pattern of the HDL-C vs. SRH association.
Conclusion: There was a consistent positive association between HDL-C and SRH, in both men and women in
four different age groups, with the strongest association in young people.
Key words: Health, HDL-C, SRH, epidemiology, biological marker
1. INTRODUCTION
The large number of factors influencing self rated
health (SRH) would suggest complex explanatory
mechanisms which are hard to unravel. Some
epidemiological studies suggest, however, that SRH
may serve as an indicator for overall health, although
it may be influenced by pain [1] and psychological
issues [2]. To examine how useful SRH is to predict
mortality compared with more traditional indicators,
Mossey and Shapiro [3] collected information on SRH,
together with physicians' reports based upon objective
measures, and did a six years follow-up study on
mortality. This investigation showed that subjects who
had given themselves a poor health rating had a three
times greater risk of dying in the next few years
compared with those who had rated their health as
excellent. In the study SRH was a more powerful
predictor of mortality than the physicians' reports.
Furthermore, SHR has been associated with health
service utilization [4], future morbidity [5], and with
general mortality [6,7].
Other studies suggest that SRH may have a
biological basis involving many biomarkers [8,9]. As
observed in a population sample of 4,065 men and
women above 70 years, high density lipoprotein
cholesterol (HDL-C) seems to be one of the biomarkers
which is positively associated with SRH [8]. However,
in cross sectional studies it is hard to appreciate
whether associations might be based on a causal
relationship. It would appear that many of the
single-factor associations with SRH could be explained
by relations to a third factor, and that although HDL-C
might serve as a health marker, the association
between SRH and HDL-C might be weakened and
possibly eliminated when adjusting for potential
confounders such as gender, age, chronic disease, body
mass index, physical activity, and social factors.
The HDL-C vs. SRH-association, as observed in a
cross sectional study among elderly people, raises the
question of 1) whether a similar relationship exists also
in younger age groups, since self rating of health could
be modified by age, and 2) if the strength of the
association may be weakened or eliminated by the
inclusion of possible confounders. The purpose of the
present work was to elucidate these questions.
2. METHODS
Main project
In 2000-2001 the Oslo Health Study was
Int. J. Med. Sci. 2007, 4
279
conducted under the joint collaboration of the National
Health Screening Service of Norway (now the
Norwegian Institute of Public Health), the University
of Oslo and the Municipality of Oslo. The study
population included all individuals in Oslo County
born in 1970, 1960, 1955, 1940-41 and 1924-25. At the
time of the data collection, the subjects were 30, 40, 45,
59-60, or 75 - 76 years of age. A total of 18,770
individuals (45.9% of the invited) participated.
The responders consisted of 8,404 men (42.4% of
the invited) and 10,366 women (49.3% of the invited)
who attended the physical examination and/or
completed at least one of the questionnaires. The
response group did not seem to be related to
self-reported health, smoking, BMI or mental health as
the participants differed only slightly from estimated
prevalence values in the target population [10].
One self-administered questionnaire was part of
the letter of invitation,
( whereas
two supplementary questionnaires were handed out at
the screening units, and sent back in pre-stamped
self-addressed envelopes. The questionnaires
provided information on health status, symptoms,
diseases and various aspects of health related
behaviour, and were returned within days of the blood
sampling. The specific question about health was:
“How would you describe your present state of
health?” with four alternatives: 1) ‘Poor’, 2) ‘Not very
good’, 3) ‘Good’, and 4) ‘Very good’. No definition of
“health” was provided. Up to two reminders were sent
to non-responders. The second reminder invited those
living in the suburban parts of the city to mobile
screening units parked in their neighbourhoods.
At the screening unit a simple clinical
examination was conducted, and measurements and
analyses were performed according to a standard
protocol (HUBRO protocol):
Non-fasting serum total cholesterol, serum
HDL-C, glucose and serum triglycerides were
measured directly by an enzymatic method (Hitachi
917 autoanalyzer, Roche Diagnostic, Switzerland).
Seronorm Lipoprotein was used as reference material
for the lipid analyses and Autonorm Human Liquid
for the glucose analyses. The control material was
introduced at the start and for every 30
th
sample. All
the laboratory investigations were performed by the
Department of Clinical Chemistry, Ullevål University
Hospital, Oslo, Norway. The results were registered
and transferred on data files to the National Health
Screening Service. LDL cholesterol (LDL-C) was
estimated using the Friedewald formula [11]. Body
weight (in kilograms, one decimal) and height (in cm,
one decimal) was measured with electronic Height and
Weight Scale with the participants wearing light
clothing without shoes.
The study protocol was placed before the
Regional Committee for Medical Research Ethics and
approved by the Norwegian Data Inspectorate. The
study has been conducted in full accordance with the
World Medical Association Declaration of Helsinki.
Of the 18,770 participants of the study there were
17,794 respondents (7,933 males and 9,861 females)
with data both on self reported health, serum HDL-C,
and triglyceride concentration. The analyses are
confined to these subjects.
Statistical analysis
Due to the relatively small number of subjects
reporting ‘poor’ health (180 men, 243 women) in the
material, the health rating alternatives ‘poor’ and ‘not
very good’ were grouped together as ‘Poor’, thus
forming three groups to be used in the correlation
analyses: Poor, Good and Very good. The sex and age
distributions of the 3 SRH groups were fairly
symmetrical (results not shown). All bi-variate
associations were studied using non-parametric
correlation analyses. (Rs is used to designate the
Spearman correlation coefficient). Multiple
comparisons were performed using Kruskal Wallis
ANOVA, and Mann-Whitney’s test with Bonferronis
correction for two group comparisons. No weighting
of any of the ‘independents’ was made, since
(graphical) evaluation of the associations between the
various ‘independents’ and the dependent (SRH, 3
groups) were linear (not shown).
Contrasting the subjects which were reporting
positive health, with those reporting negative health,
was considered a major aspect of the study. Therefore,
the variable “SRH” was further dichotomized into
“Poor health” (1719 men and 2724 women) and “Good
health” (pooling “Good” and “Very good”, 6214 men
and 7137 women). Logistic regression analysis was
carried out on the dichotomized health variable.
HDL-C (mmol/L) served as the independent variable
under special investigation. Several possibly
confounding factors were added to the model: sex, age
group (1-4), triglycerides (mmol/L), LDL-C (mmol/L),
time since the last meal (hours), smoking (never
smoked=0, current smoker=1), frequency of alcohol
intake (Group 0: ≤ 2-3 times/week; group 1: >2-3
times/week), musculoskeletal pain (see below),
mood/psychological distress (see below), length of
education (number of years at school), and number of
good friends. Body mass index (kg/m
2
) was used as a
continuous variable in Spearman correlation analysis;
and dichotomized in logistic regression (group 0 =
BMI<30, group 1= BMI ≥30). Other possible
confounders in the association between HDL-C and
SRH were physical activity level (i.e. the amount of
light physical activity at spare time, with 4 alternatives
( no activity, <1h/week, 1-2h/week, ≥3h/week), and
chronic diseases (Group 1:with-; Group 0:without):
diabetes; cardiovascular disease (CVD) including
myocardial infarction or angina pectoris or stroke;
pulmonary diseases including rhinitis or asthma or
chronic bronchitis, and “birthplace”; group 0: born in
an industrialized country (i.e. Europe or
North-America) vs. group 1: born in a developing
country (i.e. in Middle- or South-America, Asia, or
Africa). Musculoskeletal pain was entered into the
model as a Pain index constructed as the sum of pain
Int. J. Med. Sci. 2007, 4
280
scores at six locations (neck/shoulders; arms/hands;
upper back; lower back; hips/legs/feet; other places).
For Spearman correlation analysis, the Pain index is
presented with 6 values representing the scores =6, 6-8,
8-10, 10-12, 12-14, and >14; where increasing values
would be an estimate of pain severity and/or pain
distribution in the body. In logistic regression, a
dichotomized variable was used: group 0: no reported
musculoskeletal pain group 1: pain in one or more of
the locations referred above. The Mood index was
calculated as the sum of scores on 10 questions
(dealing with: fear, anxiety, dizziness, tension, self
blame, insomnia, depression, a feeling of uselessness,
and hopelessness, and that everything was a burden,).
For Spearman correlation, the Mood index is presented
with 6 values representing the scores 10, 10-15, 15-20,
20-25, 25-30, and >30. High Mood index values
indicate a highly negative psychological state. We did
not consider in more detail the psychometric
characteristics of the Mood index, which possibly
might have been improved e.g. by weighting the
contribution of some of its components. In logistic
regression, a dichotomized Mood variable was used;
group 0 = none of the above mood complaints; group
1: one or more of the complaints present.
In all the logistic regression analyses, time since
last food intake and use of cholesterol lowering drugs
were controlled for, and separate logistic regression
analyses were performed according to sex and
age-group (Table 3). As pointed out earlier [12]
covariates in the ‘causal path’ should not be
simultaneously included as independents. It cannot be
ruled out that some covariates, such as diabetes,
physical activity and intake frequency of alcohol,
might be causally associated with HDL-C. It would, on
the other hand, seem difficult to define which factors
are internal and external in a hypothetical causal
pathway from HDL-C to SRH. Therefore, we first
included only HDL-C, and after that, separately added
one by one of the independents listed above when
performing the logistic regression analyses between
HDL-C and SRH (Table 3). The significance level was
set to α =0.001 due to multiple analyses. SPSS 15.0 was
used for the statistical analyses and Sigma Plot 2001 for
producing the figures.
3. RESULTS
Some basic data
In the material 3.0% reported diabetes, 2.7% had a
history of myocardial infarction, 2.9% of stroke, and 4.0
% reported chronic bronchitis, and 14.8% reported
psychiatric problems. There were 25.8% smokers;
71.1% were employed, 5.8% on sick leave, 9.3% were
disabled pensioners. Of the total group 12.2% were on
treatment for hypertension, and 7.1% were using
cholesterol lowering drugs.
Distribution of participants by self-rated health,
sex, and age group
There was a significant decrease in SRH with
increasing age group, and each of the groups had a
rating on health that was significantly different from
all other groups (p<0.001). A majority of the
participants reported good health (Table 1, middle
columns), but the percentage decreased somewhat
with increasing age. In general, men reported
significantly better health than women (p<0.001).
Table 1. Distribution of participants by self-rated health (SRH), sex and age group
Men Women
Agegroup SRH n Percent Agegroup SRH n Percent
Young Poor 171 9,6 Young Poor 316 14,5
Good 1117 62,5 Good 1204 55,3
Very good 498 27,9 Very good 657 30,2
Total 1786 100,0 Total 2177 100,0
Middle-aged Poor 567 20,1 Middle-aged Poor 781 22,2
Good 1638 58,2 Good 1883 53,6
Very good 611 21,7 Very good 848 24,1
Total 2816 100,0 Total 3512 100,0
Senior Poor 551 27,4 Senior Poor 805 35,6
Good 1144 57,0 Good 1173 51,9
Very good 313 15,6 Very good 284 12,6
Total 2008 100,0 Total 2262 100,0
Old Poor 430 32,5 Old Poor 822 43,0
Good 765 57,8 Good 952 49,8
Very good 128 9,7 Very good 136 7,1
Total 1323 100,0 Total 1910 100,0
Int. J. Med. Sci. 2007, 4
281
Correlation between SRH (3 groups) and HDL-C
(the dependents) and various independent factors
A shown in Table 2, SRH correlated positively
(p<0.001) with HDL-C, number of friends, physical
activity, length of education, and intake frequency of
fruit/berries, fruit juice, and raw vegetables , but
negatively (p<0.001) with age group, body mass index
(BMI), LDL-C, triglycerides, Pain and Mood indices,
smoking, and chronic diseases.
HDL-C correlated positively with sex and age,
length of education, physical activity, and intake
frequency of fruit/berries, vegetables and alcohol, but
negatively with BMI, LDL-C and triglycerides,
smoking and some chronic diseases (diabetes and
CVD).
Table 2. Correlation between various independent variables and the dependent variables SRH (3 groups) and HDL-C in the whole
material
Dependent variable= SRH Dependent variable = HDL-C
Independent variable Spearmans r
S
N Spearmans r
S
N
Sex
1
-0,046 17794 0,398 17794
Agegroup -0,252 17794 0,136 17794
Body Mass Index (kg/m
2
) -0,166 17738 -0,361 17738
Time since last food intake -0,042 17665 -0,008 17665
Serum lipids HDL-C(mmol/L) 0,102 17794 1,000 17794
LDL-C(mmol/L) -0,079 17794 -0,027 17794
TG (mmol/L) -0,159 17794 -0,520 17794
Psycho.social factors:
Number of good friends 0,169 15974 0,077 15974
Pain index
2
-0,442 12315 0,005 12315
Mood index
3
-0,398 15716 0,017 15716
Years at school 0,291 17387 0,057 17387
Lifestyle factors:
Smoking
4
-0,138 12353 -0,088 12353
Alcohol intake
5
0,000 17711 0,109 17711
Physical activity
6
0,181 16809 0,140 16809
Diet items
7
:
Fruit/berries 0,091 17485 0,078 17485
Fruit juice 0,115 16887 0,011 16887
Raw vegetables 0,139 17411 0,105 17411
Chronic diseases:
Diabetes
8
-0,147 17386 -0,080 17386
CVD
9
-0,232 17792 -0,038 17792
Pulmonary diseases
10
-0,127 14586 0,011 14586
P<0.001 for all correlations, except those shown in bold. Note that the number of subjects varies due to incomplete data obtained in the questionnaire.
1
Men=1; women=2
2
Musculoskeletal pain score, with 6 levels indicating increasing complaints (see Methods).
3
Psychological distress score, with 6 levels indicating increasing complaints (see Methods.)
4
Never smoked=0; current smoker=1.
5
Alcohol (type unspecified) intake frequency: Group 0: < 2-3 times/week; group 1: >2-3 times/week.
6
Light physical activity at spare time, with 4 alternatives (see Methods).
7
Group 0=Intake frequency <1 per month; group 1= more than1-3 times per month.
8
Group 0=not diabetes, group 1=Diabetes.
9
Group 0= No myocardial infarction or angina pectoris or stroke; group 1=one or more of these diseases.
10
Group 0= No rhinitis or asthma or chronic bronchitis; group 1=one or more of these diseases.
Int. J. Med. Sci. 2007, 4
282
Table 3. Associations between self-rated health (dependent) and HDL-C in four age groups of men and women, as influenced by
covariates ( Odds ratio (OR) and 95% CI
1
)
Men Women
95,0% C.I. for odds
ratio
95,0% C.I. for odds
ratio
Agegroup OR for
good
health
Lower
Limit
Upper
Limit
Agegroup OR for
good health
Lower
Limit
Upper
Limit
HDL-C only
Young 4,94 2,63 9,29 Young 3,58 2,46 5,21
Middle-aged 2,25 1,63 3,09 Middle-aged 2,81 2,23 3,53
Senior 2,12 1,58 2,86 Senior 2,28 1,84 2,82
Old 1,87 1,37 2,54 Old 1,61 1,31 1,99
HDL-C+Number of friends
Young 4,87 2,51 9,45 Young 2,94 1,98 4,35
Middle-aged 2,09 1,50 2,92 Middle-aged 2,47 1,95 3,13
Senior 2,03 1,47 2,79 Senior 2,23 1,78 2,79
Old 1,53 1,08 2,19 Old 1,71 1,32 2,20
HDL-C+ Pain
2
Young 3,42 1,80 6,48 Young 3,31 2,25 4,88
Middle-aged 2,07 1,49 2,87 Middle-aged 2,49 1,97 3,16
Senior 2,02 1,48 2,78 Senior 2,14 1,72 2,67
Old 1,74 1,27 2,39 Old 1,61 1,29 2,00
HDL-C+ Birthplace
3
Young 4,37 2,31 8,26 Young 3,11 2,13 4,54
Middle-aged 1,97 1,43 2,71 Middle-aged 2,54 2,02 3,21
Senior 2,05 1,52 2,76 Senior 2,26 1,83 2,80
Old 1,87 1,38 2,55 Old 1,62 1,31 1,99
HDL-C+Smoking
4
Young 4,24 2,15 8,36 Young 3,80 2,51 5,76
Middle-aged 1,74 1,21 2,49 Middle-aged 2,95 2,24 3,87
Senior 1,77 1,23 2,56 Senior 2,19 1,69 2,83
Old 2,93 1,69 5,06 Old 1,52 1,17 1,97
HDL-C and Mood
5
Young 4,02 2,12 7,60 Young 3,26 2,20 4,81
Middle-aged 2,04 1,47 2,82 Middle-aged 2,72 2,15 3,46
Senior 1,98 1,45 2,69 Senior 2,27 1,82 2,83
Old 1,83 1,33 2,53 Old 1,60 1,29 1,99
HDL-C +Alcohol use
6
Young 4,94 2,63 9,30 Young 3,75 2,56 5,48
Middle-aged 2,41 1,74 3,33 Middle-aged 2,89 2,29 3,64
Senior 2,07 1,54 2,80 Senior 2,22 1,79 2,75
Old 1,84 1,34 2,54 Old 1,57 1,26 1,94
Int. J. Med. Sci. 2007, 4
283
Men Women
95,0% C.I. for odds
ratio
95,0% C.I. for odds
ratio
Agegroup OR for
good
health
Lower
Limit
Upper
Limit
Agegroup OR for
good health
Lower
Limit
Upper
Limit
HDL-C + Diseases
7
HDL-C + Pulmonary disease
Young 4,62 2,44 8,72 Young 3,66 2,50 5,36
Middle-aged 2,18 1,58 3,02 Middle-aged 2,88 2,27 3,65
Senior 2,02 1,49 2,75 Senior 2,10 1,69 2,62
Old 1,94 0,96 3,94 Old 1,62 1,31 2,00
HDL-C +CVD
Young 4,92 2,61 9,26 Young 3,72 2,56 5,41
Middle-aged 2,22 1,62 3,05 Middle-aged 2,87 2,28 3,62
Senior 2,01 1,49 2,71 Senior 2,26 1,83 2,80
Old 1,65 1,21 2,26 Old 1,50 1,21 1,86
HDL-C +Diabetes
Young 4,56 2,41 8,61 Young 3,38 2,30 4,95
Middle-aged 2,27 1,64 3,15 Middle-aged 2,74 2,17 3,48
Senior 1,92 1,42 2,59 Senior 2,18 1,75 2,70
Old 1,71 1,25 2,34 Old 1,55 1,25 1,93
HDL-C +Intake of Fruit/berries
8
Young 5,03 2,64 9,61 Young 3,59 2,44 5,27
Middle-aged 2,11 1,53 2,91 Middle-aged 2,72 2,16 3,43
Senior 2,19 1,62 2,96 Senior 2,34 1,88 2,91
Old 1,81 1,32 2,48 Old 1,55 1,25 1,93
HDL-C +Years at school
Young 3,77 1,97 7,23 Young 2,68 1,81 3,96
Middle-aged 1,84 1,33 2,55 Middle-aged 2,30 1,82 2,92
Senior 1,86 1,38 2,52 Senior 1,95 1,57 2,42
Old 1,62 1,18 2,22 Old 1,48 1,19 1,83
HDL-C +Adiposity
9
Young 4,09 2,14 7,79 Young 2,79 1,90 4,10
Middle-aged 2,11 1,53 2,93 Middle-aged 2,28 1,80 2,90
Senior 1,83 1,35 2,47 Senior 1,98 1,59 2,46
Old 1,73 1,26 2,37 Old 1,49 1,20 1,84
HDL-C +Physical Activity
10
Young 4,42 2,30 8,51 Young 2,80 1,88 4,17
Middle-aged 1,78 1,27 2,48 Middle-aged 2,60 2,05 3,29
Senior 1,88 1,38 2,56 Senior 2,12 1,70 2,64
Old 1,59 1,16 2,19 Old 1,42 1,14 1,77
P<0.001 for all calculations, except those shown in bold.
1
All analyses are adjusted for time since last food intake, and use of cholesterol lowering drugs
2
Musculoskeletal pains, dichotomized: group 0=no pain; group 1= pain located at one or more places (see Methods)
3
Born in industrialized country (i.e. Europe or North-America) =group 0; developing country= 1 (i.e. Middle- or South-America, Asia, or
Africa)
Int. J. Med. Sci. 2007, 4
284
4
Never smoked =0; current smoker= 1.
5
Psychological distress factors, dichotomized: group 0= no complaints; group1= one or more complaints (see Methods)
6
Alcohol (unspecified) intake frequency; group 0: < 2-3 times/week; group 1: >2-3 times/week
7
Group 0= Without disease; group 2= with one or more disease (CVD= angina pectoris or myocardial infarction or stroke; pulmonary
diseases: rhinitis or asthma or chronic bronchitis).
8
Group 0= intake frequency of these diet items <1 per month; group 1: > 1-3 times per month.
9
Group 0= Body mass index (kg/m
2
) <30; group 1: ≥30 kg/m
2
10
Light physical activity at spare time, with 4 alternatives: no physical activity, <1h/week, 1-2h/week, ≥3h/week.
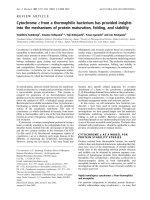
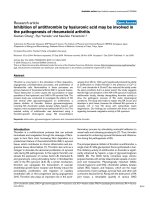
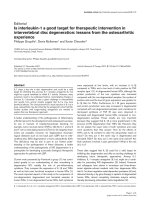
Serum lipid values by sex and age group
The concentration of serum lipids in the four age
groups of the present study is shown in Figure 1. Note
that different age cohorts appear on the abscissa; and
that lines are used only to identify the type of lipids. In
men (top panel) LDL- and HDL-cholesterol, as well as
TG concentration increased from the young (30 years)
to the middle age group (40 and 45 years). HDL-C
continued to increase until the old age group (75-76
years) and LDL-C until the senior age group (59-60
years), whereas TG decreased from the middle age
group to the old. In women (bottom panel) the serum
concentration of all these lipids increased with
increasing age group. Significant differences are
indicated. Since, in general, LDL-C increased more
than HDL-C, the HDL/LDL cholesterol ratio
decreased with increasing age group (Rs =-0,141,
p<0,001) and accordingly, the total cholesterol/HDL-C
ratio increased with increasing age group (Rs =0,124,
p<0,001).
Men
0
1
2
3
4
Age group
Serum lipid concentration (mmol/l)
0
1
2
3
4
5
1 2 3 4
Women
LDL
HDL
TG
LDL
HDL
TG
a
a,b
a,c
a
b
a,b
a,b,c
a
a,b
a,b,c
a,b
a,b
a
a,b
a,b,c
Figure 1. Serum lipid values by sex and age group. Age
group 1=young (30 years old); 2=middle-aged (40 plus 45
years); 3=seniors (59-60 years); 4=old (75-76 years). Note that
different age cohorts appear on the abscissa; the lines are used to
clarify type of lipids. Mean values ± SEM. Number of subjects
in the four age groups was for men: 1786 (young), 2816
(middle-aged), 2008 (seniors) and 1323 (old). Corresponding
numbers for women: 2177, 3512, 2262 and 1910. a) p<0.001 vs.
young; b) p<0.001 vs. middle-aged; c) p<0.001 vs. seniors.
Age 30 years
HDL cholesterol (mmol/L)
0,0
0,5
1,0
1,5
Age 40+45years
Age 59-60 years
Self rated health
0,0
0,5
1,0
1,5
2,0
Age 75-76 years
Men
1 2 3
1 2 3
Age 30 years
HDL cholesterol (mmol/L)
0,0
0,4
0,8
1,2
1,6
2,0
Age 40+45years
Age 59-60 years
Self rated health
0,0
0,5
1,0
1,5
2,0
Age 75-76 years
Women
1 2 3
1 2 3
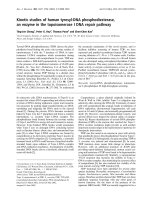
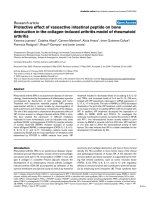
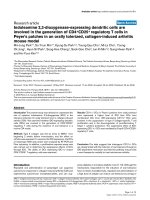
Figure 2. A. Serum HDL-cholesterol concentration in four
age groups of men, as related to self-rated health. Mean
values ± SEM, which were often too small to be shown
graphically. Number of subjects in the three health groups:
Young: 171 (poor), 1117 (good), 498 (very good).
Corresponding numbers for middle-aged: 567, 1638, 611; for
seniors: 551, 1144, 313, and for old 430, 765, 128. Correlation
coefficients (Spearman) between SRH and HDL-C in the four
age groups were: 0.120, 0.148, 0.184 and 0.156 (p<0.001 for
all). B. Serum HDL cholesterol concentration in four age
groups of women, as related to self-rated health. Mean
values ± SEM, which were often too small to be shown
graphically. Number of subjects in the three health groups was:
Young: 316 (poor), 1204 (good), 657 (very good).
Int. J. Med. Sci. 2007, 4
285
Corresponding numbers for middle-aged: 781, 1883, 848, for
seniors: 805, 1173, 284, and for old 822, 952, 136. Correlation
coefficients (Spearman) between SRH and HDL-C in the four
age groups were: 0.210, 0.204, 0.198 and 0.131 (p<0.001 for
all).
Associations between SRH and HDL-C, adjusting
for covariates
In logistic regression (Table 3), SRH was entered
as the dichotomized dependent variable and HDL-C as
the independent variable to be investigated. The
calculations were performed on each sex and age
group separately. In each analysis, time since food
intake and use of cholesterol lowering drugs were
controlled for. Not including other possible
confounders, the odds ratios for good health in men
with high HDL-C were 4.94, 2.25, 2.12 and 1.87 going
from young to old age (Table 3), i.e. an odds ratio
about twice as high in young men as compared with
the other age groups (p<0.05 for age group 1 vs. the
other groups). In women, the age related odds ratio
pattern was similar: 3.58, 2.81, 2.28, and 1.61. In the
whole material, 1 mmol/L increase in HDL-C
increased the odds for reporting good health by 2.27
(2.06-2.50; p<0.001), when adjusting for sex, age group,
time since food intake and use of cholesterol lowering
drugs. When including one more of the possible
confounders, the sex and age group pattern was in
general maintained, but the odds ratios were
somewhat attenuated.
4. DISCUSSION
The present study confirms that there is a positive
association between self-rated health and serum HDL
cholesterol concentration, as previously reported in
elderly subjects [8]. Our study extends the previous
observation by demonstrating a positive relationship
in both sexes and in several age groups. Indeed, the
association between HDL-C and SRH seemed to be
strongest in the young age groups, clearly contrasting
the 3 older age groups. How and why the observed
HDL-C vs. SRH association exists, is not apparent, but
might in part be attributed to the fact that both SRH
and HDL-C are both associated with a third factor.
Among such factors we have considered physical
activity, body mass index, dietary factors, length of
education, immigrant status, chronic diseases as well
as factors related to pain and mood. The present
finding that the strength of the association between
SRH and HDL-C was somewhat attenuated when
controlling for many of these factors would seem in
support of this contention. However, a significant
association prevailed after several adjustments,
suggesting a consistent relationship independent of
the confounding factors which were introduced.
Hypothetically, the apparent age related decrease
in the strength of association between SRH and HDL-C
could in part be explained by the difference in
exposure time of factors influencing SRH. In young
people, some negative factors may not yet have had
time to severely or permanently influence health. For
example, the complaints estimated by the Pain and
Mood indices would have had different exposure time
in young and older people. It should also be kept in
mind that the four age groups represent different
cohorts of people, implying group differences other
than age per se. Apparently, factors not adjusted for in
the present work might be involved, since the age
group related difference in the SRH vs. HDL-C
association persisted in spite of controlling for a large
number of factors.
Lifestyle factors
It is well known that physical activity is
associated with elevated levels of HDL-C [13,14], and
also with good health [15]. It is, however, hard to
appreciate what could be the cause and effect in this
association. Obviously, good health is a prerequisite
for engaging in physical activity, whilst, on the other
hand, physical activity may promote good health. In
any instance, also in the present study there was a
consistent positive association between physical
activity and both HDL-C and SRH, observed in both
sexes and in all four age groups. However, inclusion of
physical activity did not have a major influence on the
SRH vs. HDL-C association.
An inverse relationship between HDL-C and
smoking [16] and positive association between HDL-C
and alcohol intake [17] have been well established, and
the present data are in accordance with earlier reports.
However, introducing smoking and alcohol intake into
the logistic regression model had only a modest effect,
suggesting only a minor influence on the positive
association between SRH and HDL-C.
In the bivariate analyses of the present material
there was a moderate positive association between
SRH and intake frequency of fruit/berries and
vegetables, but these diet items did not affect the
HDL-C vs. SRH association. We may assume that the
positive associations between SRH and various diet
items in part may be attributed to a clustering of health
related behaviour factors [18].
Body mass index
It is well established that overweight reduces
HDL-C, and it would seem easy to conceive that
overweight or obese people also might have a low
self-esteem and a low rating of their health [19]. Our
results corroborate earlier reports showing an inverse
association between body mass index and both SRH
[20] and HDL-C [21]. However, including body mass
index as an additional independent factor had only a
small effect on the HDL-C vs. SRH associations except
in young men and women, where the effect was
appreciable. This is in line with the contention that the
impact of lifestyle factors may be different in old and
young subjects.
Length of education
Length of education might increase the
knowledge of how to improve health through
increased knowledge of the effect of various lifestyle
factors [22]. In accordance with this suggestion, there
was a positive correlation between length of education
Int. J. Med. Sci. 2007, 4
286
and physical activity Rs =0.13 (p<0.001). A
confounding effect of this variable is indicated by a
weakening of the odds ratio for good health with
increasing HDL-C when this factor was added.
Chronic diseases
It would be anticipated that the presence of
chronic diseases would give generally low ratings of
health, and this contention was corroborated in the
present material. In addition, some lifestyle conditions
and diseases may be causally related to the serum
lipids, such as, diabetes 2, and cardiovascular diseases
[22,23]. In accordance with this, the HDL-C
concentration was lower in subjects with, than
without, a history of these diseases (results not
shown). Each of several chronic diseases, i.e. diabetes,
cardiovascular diseases (myocardial infarction, angina
pectoris, and stroke), pulmonary diseases (asthma,
rhinitis, and chronic bronchitis) was negatively
associated with HDL-C. Including these chronic
diseases into the logistic regression model did not,
however, attenuate the HDL-C vs. SRH association
much. Interestingly, the positive association between
SRH and HDL-C was found also within groups of
subjects with a history of chronic diseases (results not
shown). Thus, it would appear that the presence of
chronic illnesses only partially explains the association
between HDL-C and SRH.
Time since food intake
The fact that the blood samples were not obtained
in the fasting state is a limitation in the present study,
due to a possible postprandial increase, especially in
the serum triglyceride concentration. However, in the
questionnaire there is a question about time since the
last meal, and controlling for this variable did not
affect the odds ratio for the association between
HDL-C and SRH (results not shown). Surprisingly,
even the association between serum triglycerides and
SRH was not much affected by time since food intake.
In view of the positive association between
HDL-C and self rated health, it might be questioned
whether the subjects knew their serum lipid values,
and the effect they might have on their health, and
thereby influence their health rating. There is no direct
variable in the questionnaire elucidating this question.
However, we would assume that due to the general
health information in Norway, many of the
respondents knew their total cholesterol value, but
probably not their HDL-C or LDL-C values. One
exception could be patients with hyperlipemia.
Therefore, we split the material into a “high” and a
“low” lipid group, using total cholesterol = 5 mmol/L
and triglycerides =1.7 mmol/L as cut-off values. A
highly significant association between HDL-C and
SRH persisted within both the “low” and the “high”
lipid groups. Additionally, controlling for the use of
cholesterol lowering drugs did not have a major
influence on the outcome. Nevertheless, in all logistic
regression analyses we adjusted for time since food
intake and use of cholesterol lowering drugs
Immigrants from developing countries
The explanations behind the negative health
ratings associated with being born in a developing
country are not apparent. Conceivably, there might
have been socio-economic problems as regards
adaptation to the Norwegian way of living, in
adjusting their traditional dietary habits, and possibly
difficulties in correctly interpreting the question about
health. Additionally, some of them may be refugees
and suffer from post war stress. In any instance, the
negative association between birthplace and SRH did
not affect the SRH vs. HDL-C association much.
Thus, in this relatively large material a consistent
association between SRH and HDL-C was
demonstrated irrespective of sex and age, and after
controlling for Pain and Mood indices, physical
activity level, length of education, birthplace, body
mass index, and many chronic diseases. Based on the
present material it would appear that subjects with
good self-rated health have high serum HDL-C
concentration, are well educated with a high physical
activity level, and not unexpectedly, little pain and
good moods. Inclusion of a number of factors in the
analyses had a moderating effect on the association
between SRH and HDL-C, but did not eliminate the
relationship. Hypothetically, inclusion of other, as yet
unknown, factors might possibly weaken the
association. As inferred from the study of Jylha et al
[8], white blood cell count and haemoglobin (data not
available in the present material) might be among such
factors.
In conclusion, there seems to be a consistent
association between HDL-C and self-reported health,
as observed in many age groups and in both sexes. We
were not able to obliterate the association by
controlling for a large number of potentially
confounding factors.
ACKNOWLEDGMENTS
The data collection was conducted as part of the
Oslo Health Study 2000-2001 in collaboration with the
National Health Screening Service of Norway - now
the Norwegian Institute of Public Health.
CONFLICT OF INTEREST
The authors have declared that no conflict of
interest exists.
REFERENCES
1. Mantyselka PT, Turunen JH, Ahonen RS, Kumpusalo EA.
Chronic pain and poor self-rated health. JAMA. 2003;
290:2435-2442.
2. Siedlecki SL. Predictors of self-rated health in patients with
chronic nonmalignant pain. Pain Manag Nurs. 2006; 7:109-116.
3. Mossey JM, Shapiro E. Self-rated health: a predictor of mortality
among the elderly. Am J Public Health. 1982; 72:800-808.
4. Trump DH. Self-rated health and health care utilization after
military deployments. Mil Med. 2006; 171:662-668.
5. Emmelin M, Weinehall L, Stegmayr B, et al. Self-rated ill-health
strengthens the effect of biomedical risk factors in predicting
stroke, especially for men an incident case referent study. J
Hypertens. 2003; 21:887-896.
6. Idler EL, Benyamini Y. Self-rated health and mortality: a review
Int. J. Med. Sci. 2007, 4
287
of twenty-seven community studies. J Health Soc Behav. 1997;
38:21-37.
7. Idler EL, Russell LB, Davis D. Survival, functional limitations,
and self-rated health in the NHANES I Epidemiologic Follow-up
Study, 1992. First National Health and Nutrition Examination
Survey. Am J Epidemiol. 2000; 152:874-883.
8. Jylha M, Volpato S, Guralnik JM. Self-rated health showed a
graded association with frequently used biomarkers in a large
population sample. J Clin Epidemiol. 2006; 59:465-471.
9. Goldman N, Glei DA, Chang MC. The role of clinical risk factors
in understanding self-rated health. Ann Epidemiol. 2004;
14:49-57.
10. Sogaard AJ, Selmer R, Bjertness E, Thelle D. The Oslo Health
Study: The impact of self-selection in a large, population-based
survey. Int J Equity Health. 2004; 3:3.
11. Friedewald WT, Levy RI, Fredrickson DS. Estimation of the
concentration of low-density lipoprotein cholesterol in plasma,
without use of the preparative ultracentrifuge. Clin Chem. 1972;
18:499-502.
12. Hernan MA, Hernandez-Diaz S, Werler MM, Mitchell AA.
Causal knowledge as a prerequisite for confounding evaluation:
an application to birth defects epidemiology. Am J Epidemiol.
2002; 155:176-184.
13. Wood PD, Haskell W, Klein H, et al. The distribution of plasma
lipoproteins in middle-aged male runners. Metabolism 1976;
25:1249-1257.
14. Wood PD, Terry RB, Haskell WL. Metabolism of substrates: diet,
lipoprotein metabolism, and exercise. Fed Proc. 1985; 44:358-363.
15. Marcus BH, Williams DM, Dubbert PM, et al. Physical activity
intervention studies: what we know and what we need to know:
a scientific statement from the American Heart Association
Council on Nutrition, Physical Activity, and Metabolism
(Subcommittee on Physical Activity); Council on Cardiovascular
Disease in the Young; and the Interdisciplinary Working Group
on Quality of Care and Outcomes Research. Circulation 2006;
114:2739-2752.
16. Assmann G, Schulte H, Schriewer H. The effects of cigarette
smoking on serum levels of HDL cholesterol and HDL
apolipoprotein A-I. Findings of a prospective epidemiological
study on employees of several companies in Westphalia, West
Germany. J Clin Chem Clin Biochem. 1984; 22:397-402.
17. Hulley SB, Gordon S. Alcohol and high-density lipoprotein
cholesterol: causal inference from diverse study designs.
Circulation 1981; 64:III-63.
18. Galan I, Rodriguez-Artalejo F, ez-Ganan L, et al. Clustering of
behavioural risk factors and compliance with clinical preventive
recommendations in Spain. Prev Med. 2006; 42:343-347.
19. Thommasen HV, Self B, Grigg A, et al. The relationship between
self-rated health, stress, health care, overall quality of life and
weight in a rural population. Eat Weight Disord. 2005;
10:e66-e69.
20. Kruger J, Bowles HR, Jones DA, et al. Health-related quality of
life, BMI and physical activity among US adults (>/=18 years):
National Physical Activity and Weight Loss Survey, 2002. Int J
Obes. 2007; 31:321-327.
21. Heitmann BL. The Effects of Gender and Age on Associations
Between Blood Lipid-Levels and Obesity in Danish Men and
Women Aged 35-65 Years. J Clin Epidemiol. 1992; 45:693-702.
22. Molarius A, Berglund K, Eriksson C, et al. Socioeconomic
conditions, lifestyle factors, and self-rated health among men
and women in Sweden. Eur J Public Health. 2007;17(2):125-33.
23. Mota M, Panus C, Mota E, et al. The metabolic syndrome a
multifaced disease. Rom J Intern Med. 2004; 42:247-255.