Báo cáo y học: " Computerized two-lead resting ECG analysis for the detection of coronary artery stenosis after coronary revascularization" doc
Bạn đang xem bản rút gọn của tài liệu. Xem và tải ngay bản đầy đủ của tài liệu tại đây (328.71 KB, 12 trang )
Int. J. Med. Sci. 2008, 5
50
International Journal of Medical Sciences
ISSN 1449-1907 www.medsci.org 2008 5(2):50-61
© Ivyspring International Publisher. All rights reserved
Research Paper
Computerized two-lead resting ECG analysis for the detection of coronary
artery stenosis after coronary revascularization
Eberhard Grube
1
, Andreas Bootsveld
2
, Lutz Buellesfeld
1
, Seyrani Yuecel
1
, Joseph T Shen
3
, Michael Imhoff
4
1. Department of Cardiology and Angiology, HELIOS Heart Center Siegburg, Siegburg, Germany
2. Department of Cardiology, Evangelisches Stift St. Martin, Koblenz, Germany
3. Premier Heart, LLC, Port Washington, NY, USA
4. Department for Medical Informatics, Biometrics and Epidemiology, Ruhr-University Bochum, Bochum, Germany
Correspondence to: Michael Imhoff, MD, PhD, Am Pastorenwäldchen 2, D-44229 Dortmund, Germany. Phone: +49-231-973022-0; Fax:
+49-231-973022-31; e-mail:
Received: 2007.12.10; Accepted: 2008.03.02; Published: 2008.03.02
Background: Resting electrocardiogram (ECG) shows limited sensitivity and specificity for the detection of
coronary artery disease (CAD), where patients with a history of coronary revascularization may pose special
challenges. Several methods exist to enhance sensitivity and specificity of resting ECG for diagnosis of CAD, but
such methods are not better than a specialist’s judgement. We compared a new computer-enhanced, resting ECG
analysis device, 3DMP, to coronary angiography to evaluate the device’s accuracy in detecting hemodynamically
relevant CAD.
Methods: A convenience sample of 172 patients with a history of coronary revascularization scheduled for
coronary angiography was evaluated with 3DMP before coronary angiography. 3DMP's sensitivity and
specificity in detecting hemodynamically relevant coronary stenosis as diagnosed with coronary angiography
were calculated as well as odds ratios for the 3DMP severity score and coronary artery disease risk factors.
Results: The 3DMP system accurately identified 50 of 55 patients as having hemodynamically relevant stenosis
(sensitivity 90.9%, specificity 88.0%). Positive and negative predictive values for the identification of coronary
stenosis as diagnosed in coronary angiograms were 62.7% and 97.8% respectively. Risk and demographic factors
in a logistic regression model had a markedly lower predictive power for the presence of coronary stenosis in
these patients than did 3DMP severity score (odds ratio 2.04 [0.74-5.62] vs. 73.57 [25.10-215.68]). A logistic
regression combining severity score with risk and demographic factors did not add significantly to the prediction
quality (odds ratio 80.00 [27.03-236.79]).
Conclusions: 3DMP’s computer-based, mathematically derived analysis of resting two-lead ECG data provides
detection of hemodynamically relevant CAD in patients with a history of coronary revascularization with high
sensitivity and specificity that appears to be at least as good as those reported for other resting and/or stress ECG
methods currently used in clinical practice.
Key words: coronary artery disease, electrocardiography, computer-enhanced, coronary imaging: angiography, sensitivity,
specificity, post-intervention
Introduction
Coronary artery disease (CAD) is the leading
single cause of death in the developed world. Between
15% and 20% of all hospitalizations are the direct
results of CAD [1].
Revascularization o
f coronary arteries is one of
the most frequently performed medical interventions
in the developed world. In 2002, more than 500,000
coronary artery bypass graft (CABG) surgeries and
nearly 1.2 million percutaneous coronary interventions
(PCI) including coronary stent implantations were
performed in the US. In the same year, more than
200,000 CABGs and more than half a million PCI were
done in Europe [1]. Coronary restenosis after PCI and
bypass graft an
d de-novo coronary stenosis are not
infrequent after revascularization and remain
significant clinical issues [2]. For example, studies of
drug
eluting and non-drug eluting stents show
restenosis rates between 4% and over 20% [3, 4].
Coronary
angiography remains the gold standard
for the morphologic diagnosis of CAD and also allows
revascularization during the same procedure [5, 6].
However, it is resource-intensive, expen
sive, invasive,
and bears a relevant procedure-related complication
rate (< 2%), morbidity (0.03-0.25%), and mortality
(0.01-0.05%) [7,8].
Electrocardio
graphy-based methods are routinely
Int. J. Med. Sci. 2008, 5
51
used as the first tools for initial screening and
diagnosis. Still, in clinical studies they show
sensitivities for prediction of CAD of only 20% to 70%
[9,10]. Even exercise ECG is an insensitive method to
det
ect restenosis, with a sensitivity of below 55%.
Therefore, the usefulness of ECG-based methods in the
follow-up period after revascularization therapy has
been questioned [11, 12, 13].
Risk factors
for CAD such as smoking, arterial
hypertension, diabetes mellitus, obesity, or
hypercholesterolemia (of which at least one is present
in the vast majority of symptomatic CAD patients) can
also be used to screen for hemodynamically relevant
coronary stenosis [14, 15, 16, 17]. But in patients after
coronary
revascularization these risk factors are often
modified by secondary prevention and have not been
well validated for establishing pre-test probability of
coronary stenosis.
Several methods have been proposed and
developed to enhance sensitivity and specificity of
resting ECG for diagnosis of symptomatic and
asymptomatic CAD. Yet such diagnostic ECG
computer programs have not been shown to be equal
or superior to the specialist physician’s judgment [18].
Moreover,
studies comparing computerized with
manual ECG measurements in patients with acute
coronary syndrome have shown that computerized
measurements have diagnostic cut-offs that differ from
manual measurements and may not be used
interchangeably [19]. This is likely one reason
under
lying the limited acceptance of such techniques
in clinical practice during the follow-up period after
coronary revascularization.
The present study compared 3DMP, a new
computer-enhanced, resting ECG device, to coronary
angiography to evaluate 3DMP’s relevance in
detecting coronary restenosis, graft stenosis, or de
novo stenosis after coronary revascularization.
Methods and Materials
The study was approved by the local institutional
committee on human research. Written informed
consent was waived by each participant as a result of
the disclosed non-risk designation of the study device.
All patients received a full explanation and gave verbal
consent to the study and the use of their de-identified
data.
Patients
Between July 01, 2001, and June 30, 2003, 213
patients scheduled for coronary angiography at the
Heart Center Siegburg, Siegburg, Germany, were
included in the study. These patients represented a
convenience sample in that each patient was already
scheduled for coronary angiography for any indication
and had undergone at least one coronary
revascularization procedure at least 6 weeks prior to
the scheduled angiography. Thirty-six patients had a
history of myocardial infarction (MI) more than six
weeks prior to angiography. No patients presented
with acute coronary syndrome at the time of study.
Seven patients were excluded from the final analysis
due to poor ECG tracing quality, and risk factor
information could not be retrieved for 34 patients. The
patient population did not overlap with any previous
study or with the actual 3DMP database. The 3DMP
reference database was not modified or updated
during the study period.
Medical history and risk factors for each patient
were retrieved from the standard medical
documentation. The following risk factors were
classified as “present” or “not present” [14, 15, 16, 17]:
• Arterial hyp
ertension (systolic blood pressure >
140 mmHg and/or diastolic blood pressure > 90
mmHg),
• Diabetes mellitus of any type,
• Hypercholesterolemia (cholesterol > 200 mg/dl or
LDL-cholesterol > 160 mg/dl) and/or
hypertriglyceridemia (triglycerides > 200 mg/dl),
• Active or former smoking (cessation less than 5
years prior to inclusion in the study),
• Obesity (BMI > 30 kg/m2),
• Family history (symptomatic CAD of one parent),
• Other risk factors, including established diagnosis
of peripheral artery disease.
Study device
The study device, 3DMP (Premier Heart, LLC,
Port Washington, NY, USA), records a 2-lead resting
ECG from leads II and V5 for 82 seconds each using
proprietary hardware and software. The analog ECG
signal is amplified, digitized, and down-sampled to a
sampling rate of 100 Hz to reduce data transmission
size; subsequent data transformations performed on
the data do not require higher than 100 Hz/sec
resolution. The digitized ECG data is encrypted and
securely transmitted over the Internet to a central
server.
At the server, a series of Discrete Fourier
Transformations are performed on the data from the
two ECG leads followed by signal averaging. The final
averaged digital data segment is then subjected to six
mathematical transformations (power spectrum,
coherence, phase angle shift, impulse response,
cross-correlation, and transfer function) in addition to
an amplitude histogram, all of which is used to
Int. J. Med. Sci. 2008, 5
52
generate indexes of abnormality. The resulting
patterns of the indexes are then compared for
abnormality to the patterns in the reference database to
reach a final diagnostic output. In addition to the
automatic differential diagnosis and based on the
database comparison, a severity score from 0 to 20 is
calculated that indicates the level of myocardial
ischemia (if present) resulting from coronary disease.
The database against which the incoming ECG
results are compared originated from data gathering
trials conducted from 1978 to 2000 in more than 30
institutions in Europe, Asia, and North America on
individuals of varying ages and degrees of disease
state including normal populations [20,21]. All ECG
ana
lyses in this database have been validated against
the final medical diagnosis of at least two independent
expert diagnosticians in the field, including results of
angiography and enzyme tests. The current diagnostic
capability for identification of local or global ischemia
and the disease severity score used in this clinical
study are based on 3DMP’s large proprietary database
of validated ECG analyses accumulated since 1998.
One important difference between 3DMP and
other ECG methods is that the ECG is locally recorded
but remotely analyzed at a central data facility due to
the size and complexity of the reference database. A
detailed description of the 3DMP technology was
given previously in this journal [22].
ECG acquisition and processing
3DMP tests were conducted as follows by a
trained trial site technician as part of a routine
electrophysiological workup received by each patient
prior to angiography.
Patients were tested while quietly lying supine
following 20 minutes of bed rest.
Five ECG wires with electrodes were attached
from the 3DMP machine to the patient at the four
standard limb lead and precordial lead V5 positions.
An automatic 82-second simultaneous two-lead
(leads V5 and II) ECG sample was acquired with
amplification and digitization.
During the sampling, the ECG tracings displayed
on the 3DMP screen were closely monitored for tracing
quality.
The digital data was then de-identified,
encrypted, and sent via a secure Internet connection to
www.premierheart.com. A second identical copy of
the data was saved on the remote 3DMP machine for
post-study verification purposes before the data
analysis was carried out. The quality of the tracing was
visually rechecked and graded as “good,” “marginal,”
or “poor.” A poor tracing was defined by one of the
following:
• five or more 5.12-second segments of ECG data
contain idiopathic extrema that deviate from the
baseline by ≥ 2 mm and appear ≥ 10 times,
• two or more 5.12-second segments of ECG data
contain idiopathic extrema that deviate from the
baseline by ≥ 5 mm,
• in a 25-mm section of waveform in any
5.12-second segment of the ECG data, the
waveform strays from the baseline by ≥ 3 mm,
• a radical deviation away from the baseline 80° of ≥
2 mm from the baseline, occurring two or more
times,
• a single radical deviation away from the baseline
80° episode of ≥ 5 mm from the baseline.
A marginal tracing was defined by significant
baseline fluctuations that did not meet the above
criteria. Tracings consistently graded as poor after
repeated sampling were excluded from the present
study. All other tracings were included in the study.
3DMP provided automatic diagnosis of regional
or global ischemia, including silent ischemia, due to
coronary artery disease, and calculated a severity
score. This severity score has a maximum range from 0
to 20 where a higher score indicates a higher likelihood
of myocardial ischemia due to coronary stenosis.
Following the 3DMP manufacturer’s recommendation,
a cut-off of 4.0 for the severity score was used in this
study, with a score of 4.0 or higher being considered
indicative of a hemodynamically relevant coronary
artery stenosis of >70% in at least one large-sized
vessel.
Angiographers and staff at the study site were
blinded to all 3DMP findings. The 3DMP technicians
and all Premier Heart staff were blinded to all clinical
data including pre-test probabilities for CAD or
angiography findings from the study patients.
Retest reliability of 3DMP was assessed in 38
patients on whom a second 3DMP test was done
within 4 hours after the first test. The ECG electrodes
were left in place for these repeat measurements. For
comparison with angiography, the first test was
always used in these patients.
Angiography
After the 3DMP test, coronary angiography was
performed following the standards of the institution.
Angiograms were classified immediately by the
respective angiographer and independently by a
second interventional cardiologist within 4 weeks after
the angiogram. If the two investigators did not agree
on the results, they discussed the angiograms until
agreement was reached. Angiograms were classified as
Int. J. Med. Sci. 2008, 5
53
follows:
Non-obstructive CAD: angiographic evidence of
coronary arterial stenosis of ≤70% in a single or
multiple vessels. Evidence included demonstrable
vasospasm, delayed clearance of contrast medium
indicating potential macro- or micro-vascular disease,
documented endothelial abnormality (as indicated by
abnormal contrast staining), or CAD with at least 40%
luminal encroachment observable on angiograms.
These patients were classified as negative for
hemodynamically relevant CAD (= “stenosis: no”).
Obstructive CAD: angiographic evidence of
coronary arterial sclerosis of > 70% in a single or
multiple vessels, with the exception of the left main
coronary artery, where ≥50% was considered
obstructive. These patients were classified as positive
for hemodynamically relevant CAD (= “stenosis: yes”).
The angiographic results represent the diagnostic
endpoint against which 3DMP was tested.
Statistical methods
An independent study monitor verified the
double-blindness of the study and the data integrity
and monitored the data acquisition process, all
angiography reports, and all 3DMP test results.
Descriptive statistics were calculated for all variables
(mean +/- standard deviation). Differences between
two variables were tested with the t-test. Differences in
2x2 tables were assessed for significance with Fisher’s
exact test. Logistic regression was used to analyze
effects of multiple categorical variables. Odds ratios
including 95% confidence intervals were calculated.
Sensitivity and specificity were calculated as were
receiver operating characteristic (ROC) curves
including an estimate of the area under the curve
(AUC). Positive and negative predictive values (PPV,
NPV) for the assessment of coronary stenosis were
calculated with adjustment to prevalence of stenosis
[23]. Moreover, in order to assess the performance of
the prediction of sten
osis independent of the
prevalence of stenosis the positive and negative
likelihood ratios (LR) were calculated [24]. A value of P
< 0.
05 was considered statistically significant. All
analyses were done with SPSS for Windows Version 14
(SPSS Inc., Chicago, IL, USA).
Results
Data from 172 of the original 213 patients were
available for final analysis. The 41 patients excluded
due to poor ECG tracings (7) or unavailability of full
risk factor information (34) were not significantly
different from the included patients with respect to age
(63.7 +/-9.1 years vs. 63.9 +/- 10.0 years; p = 0.925),
gender (29.3% female vs.32.6% male; p = 0.852),
diagnosis of coronary stenosis (39% vs. 32%; p = 0.461),
and type of revascularization procedure (CABG 41.5%
CABG vs. 28.5%; p = 0.132). The study patients
comprised 116 men and 56 women, with an average
age of 63.9 +/- 10 years (35-83). Women were
significantly older than men (68.7 +/- 8.2 years vs. 61.6
+/- 9.9 years; p < 0.01).
Forty-nine patients underwent CABG surgery
and 123 PCI prior to angiography. Men undergoing
PCI were significantly younger than men undergoing
CABG (60.0 +/- 10 years vs. 64.7 +/- 9.2 years, p < 0.02;
table 1). In the PCI patients, women were significantly
older than men (69.3 +/-7.6 years vs. 60.0 +/-10 years,
p < 0.01), whereas there was no significant age
difference in the CABG patients (66.0 +/- 10.6 years vs.
64.7 +/- 9.2 years, p = 0.725).
Only 7 (4.1%) patients had no known risk factors
for CAD, whereas 103 (59.9%) had at least three risk
factors (table 1). Patients with arterial hypertension
and with a family history of CAD were significantly
older than those without; smokers were significantly
younger than non-smokers (each p < 0.05). Diabetes
was significantly more frequent in women (p < 0.05).
Hemodynamically relevant coronary or graft
stenosis was diagnosed by angiography in 55 patients
(32%). There were no significant differences between
men and women in the rate of stenosis. There were
also no significant age differences between patients
with and patients without stenosis (table 2). The
percentage of angiographically identified stenosis was
higher in the CABG group than in the PCI group, but
not significantly (40.8% vs. 28.5%; p = 0.15). Of the 36
patients with a history of myocardial infarction only 15
(42%) had a hemodynamically relevant stenosis. The
difference to patients without an MI history was not
statistically significant.
In a logistic regression model with all risk factors,
age, gender, the type of revascularization procedure,
only arterial hypertension was negatively associated
with an increase in the risk of coronary stenosis (OR
0.34 [0.16-0.72]; p < 0.01). A weak, but not significant,
association could be seen with CABG (OR 1.86
[0.88-3.93]; p = 0.10). With this model, 67.4% of all cases
were correctly classified (OR 2.04 [0.74-5.62], summary
in table 3). When history of MI was included in this
model, the model did not significantly change.
Specifically, history of MI was not a significant factor
in this model.
Int. J. Med. Sci. 2008, 5
54
Table 1: Risk factors, gender, age distribution, type of revascularization, and MI history.
All Patients Gender
female male
Age (years) Age (years) Age (years)
Mean SD N % Mean SD N % Mean SD N %
no 61.0 10.3 44 25.6% 63.9 8.3 11 19.6% 60.1 10.9 33 28.4% Arterial
Hypertension
yes 64.9 9.7 128 74.4% 69.8 7.9 45 80.4% 62.2 9.6 83 71.6%
no 64.9 9.1 51 29.7% 70.2 9.5 14 25.0% 62.9 8.2 37 31.9% High
Cholesterol/Lipids
yes 63.4 10.3 121 70.3% 68.1 7.8 42 75.0% 60.9 10.6 79 68.1%
no 66.2 9.9 105 61.0% 70.4 8.0 39 69.6% 63.7 10.1 66 56.9% Active or Former
Smoking
yes 60.3 9.0 67 39.0% 64.6 7.4 17 30.4% 58.8 9.1 50 43.1%
no 63.5 10.2 131 76.2% 68.9 8.7 37 66.1% 61.3 10.0 94 81.0% Diabetes of any
type
yes 65.3 9.3 41 23.8% 68.2 7.5 19 33.9% 62.7 10.0 22 19.0%
no 66.1 9.6 109 63.4% 71.5 8.0 32 57.1% 63.9 9.4 77 66.4% Family History
yes 60.0 9.4 63 36.6% 64.8 7.0 24 42.9% 57.0 9.6 39 33.6%
no 64.5 9.5 100 58.1% 68.2 8.7 30 53.6% 63.0 9.5 70 60.3% Obesity
yes 63.0 10.6 72 41.9% 69.2 7.8 26 46.4% 59.5 10.4 46 39.7%
no 63.8 10.0 168 97.7% 68.7 8.2 56 100.0% 61.4 10.0 112 96.6% Other Risk Factors
yes 66.5 7.0 4 2.3% 66.5 7.0 4 3.4%
0 67.1 8.6 7 4.1% 67.1 8.6 7 6.0%
1 66.7 9.3 20 11.6% 73.3 6.1 6 10.7% 63.8 9.1 14 12.1%
2 64.7 10.3 42 24.4% 68.6 8.9 15 26.8% 62.6 10.6 27 23.3%
3 62.8 10.4 54 31.4% 68.3 10.5 15 26.8% 60.7 9.7 39 33.6%
4 66.8 8.9 22 12.8% 70.3 7.4 10 17.9% 63.9 9.3 12 10.3%
5 59.1 8.7 20 11.6% 65.4 3.5 8 14.3% 54.8 8.7 12 10.3%
Number of Risk
Factors
6 60.6 10.2 7 4.1% 63.0 1.4 2 3.6% 59.6 12.3 5 4.3%
no 64.1 9.4 136 79.1% 68.2 8.2 46 82.1% 62.1 9.3 90 77.6% Myocardial
infarction in
history
yes 62.9 12.0 36 20.9% 70.8 8.7 10 17.9% 59.9 11.9 26 22.4%
PCI 63.4 10.2 123 71.5% 69.3 7.6 45 80.4% 60.0 10.0 78 67.2% Revascularization
in Patient History
CABG 65.0 9.4 49 28.5% 66.0 10.6 11 19.6% 64.7 9.2 38 32.8%
Table 2: Frequency of coronary stenosis, distribution of gender, age, type of revascularization, risk factors, and MI history.
Coronary Stenosis
no yes
All Patients
All Patients Mean 63.9 63.9 63.9
Std Deviation 9.5 11.0 10.0
N 117 55 172
Gender female Age (years) Mean 69.3 67.3 68.7
SD 7.7 9.5 8.2
N 39 17 56
male Age (years) Mean 61.2 62.4 61.6
SD 9.2 11.4 9.9
N 78 38 116
Arterial Hypertension no N 22 22 44
yes N 95 33 128
High Cholesterol/Lipids no N 32 19 51
yes N 85 36 121
Active or Former Smoking no N 72 33 105
yes N 45 22 67
Diabetes of any type no N 89 42 131
yes N 28 13 41
Family History no N 73 36 109
yes N 44 19 63
Obesity no N 68 32 100
yes N 49 23 72
Other Risk Factors no N 114 54 168
yes N 3 1 4
Number of Risk Factors 0 N 4 3 7
1 N 10 10 20
2 N 32 10 42
3 N 37 17 54
4 N 12 10 22
Int. J. Med. Sci. 2008, 5
55
Coronary Stenosis
no yes
All Patients
5 N 16 4 20
6 N 6 1 7
Myocardial infarction in history no N 96 40 136
yes N 21 15 36
Revascularization in Patient History PCI N 88 35 123
CABG N 29 20 49
Table 3: Prediction of coronary stenosis by logistic regression with risk factors (“A”), by logistic regression with risk factors and MI
history (“B”), by logistic regression with risk factors and severity score (cut-off 4.0; “C”), by logistic regression with risk factors and
MI history and severity score (cut-off 4.0; “D”), and by severity score (cut-off 4.0; “E”) alone for total population, gender, age
groups, type of revascularization, and MI history.
OR 95% CI ROC AUC 95% CI n TP TN FP FN a priori Correct Sens Spec PPV NPV LR+ LR- OR
Lower Upper
ROC
AUC
Lower Upper
Total A 172 8 108 9 47 0.320 0.674 0.145 0.923 0.295 0.830 1.891 0.926 2.04 0.74 5.62 0.674 0.587 0.760
B 172 13 107 10 42 0.320 0.698 0.236 0.915 0.379 0.844 2.765 0.835 3.31 1.35 8.13 0.673 0.585 0.761
C 172 50 104 13 5 0.320 0.895 0.909 0.889 0.644 0.978 8.182 0.102 80.00 27.03 236.79 0.927 0.879 0.975
D 172 50 103 14 5 0.320 0.890 0.909 0.880 0.627 0.978 7.597 0.103 73.57 25.10 215.68 0.929 0.881 0.976
E 172 50 103 14 5 0.320 0.890 0.909 0.880 0.627 0.978 7.597 0.103 73.57 25.10 215.68 0.903 0.855 0.952
Female A 56 7 35 4 10 0.304 0.750 0.412 0.897 0.433 0.889 4.015 0.655 6.13 1.49 25.22 0.730 0.586 0.874
B 56 7 35 4 10 0.304 0.750 0.412 0.897 0.433 0.889 4.015 0.655 6.13 1.49 25.22 0.731 0.588 0.873
C 56 14 34 5 3 0.304 0.857 0.824 0.872 0.550 0.963 6.424 0.202 31.73 6.66 151.14 0.920 0.843 0.997
D 56 14 36 3 3 0.304 0.893 0.824 0.923 0.670 0.965 10.706 0.191 56.00 10.08 311.25 0.937 0.874 0.999
E 56 15 33 6 2 0.304 0.857 0.882 0.846 0.521 0.974 5.735 0.139 41.25 7.44 228.70 0.882 0.793 0.971
Male A 116 7 72 6 31 0.328 0.681 0.184 0.923 0.362 0.827 2.395 0.884 2.71 0.84 8.72 0.668 0.564 0.772
B 116 10 71 7 28 0.328 0.698 0.263 0.910 0.410 0.839 2.932 0.809 3.62 1.25 10.46 0.688 0.585 0.792
C 116 35 70 8 3 0.328 0.905 0.921 0.897 0.681 0.980 8.980 0.088 102.08 25.49 408.85 0.936 0.883 0.990
D 116 35 70 8 3 0.328 0.905 0.921 0.897 0.681 0.980 8.980 0.088 102.08 25.49 408.85 0.936 0.882 0.990
E 116 35 70 8 3 0.328 0.905 0.921 0.897 0.681 0.980 8.980 0.088 102.08 25.49 408.85 0.914 0.856 0.973
< 65 years A 93 7 58 5 23 0.323 0.699 0.233 0.921 0.400 0.841 2.940 0.833 3.53 1.02 12.26 0.703 0.591 0.814
B 93 11 57 6 19 0.323 0.731 0.367 0.905 0.466 0.863 3.850 0.700 5.50 1.79 16.89 0.721 0.604 0.838
C 93 27 57 6 3 0.323 0.903 0.900 0.905 0.682 0.976 9.450 0.111 85.50 19.86 368.01 0.918 0.843 0.993
D 93 27 57 6 3 0.323 0.903 0.900 0.905 0.682 0.976 9.450 0.111 85.50 19.86 368.01 0.915 0.839 0.991
E 93 27 57 6 3 0.323 0.903 0.900 0.905 0.682 0.976 9.450 0.111 85.50 19.86 368.01 0.929 0.868 0.990
> 65 years A 79 4 49 5 21 0.316 0.671 0.160 0.907 0.270 0.834 1.728 0.926 1.87 0.46 7.65 0.701 0.579 0.823
B 79 4 49 5 21 0.316 0.671 0.160 0.907 0.270 0.834 1.728 0.926 1.87 0.46 7.65 0.706 0.587 0.825
C 79 20 51 3 5 0.316 0.899 0.800 0.944 0.755 0.957 14.400 0.212 68.00 14.84 311.50 0.957 0.912 1.001
D 79 19 51 3 6 0.316 0.886 0.760 0.944 0.746 0.948 13.680 0.254 53.83 12.22 237.11 0.958 0.916 1.001
E 79 20 51 3 5 0.316 0.899 0.800 0.944 0.755 0.957 14.400 0.212 68.00 14.84 311.50 0.875 0.796 0.953
PCI A 123 12 81 7 23 0.285 0.756 0.343 0.920 0.405 0.899 4.310 0.714 6.04 2.13 17.10 0.680 0.565 0.795
B 123 12 81 7 23 0.285 0.756 0.343 0.920 0.405 0.899 4.310 0.714 6.04 2.13 17.10 0.677 0.561 0.793
C 123 30 80 8 5 0.285 0.894 0.857 0.909 0.599 0.976 9.429 0.157 60.00 18.19 197.92 0.909 0.839 0.980
D 123 29 81 7 6 0.285 0.894 0.829 0.920 0.622 0.971 10.416 0.186 55.93 17.36 180.20 0.913 0.847 0.980
E 123 30 79 9 5 0.285 0.886 0.857 0.898 0.570 0.975 8.381 0.159 52.67 16.33 169.90 0.897 0.835 0.959
CABG A 49 7 25 4 13 0.408 0.653 0.350 0.862 0.547 0.736 2.538 0.754 3.37 0.83 13.64 0.711 0.560 0.862
B 49 7 24 5 13 0.408 0.633 0.350 0.828 0.491 0.728 2.030 0.785 2.58 0.68 9.79 0.691 0.537 0.844
C 49 19 27 2 1 0.408 0.939 0.950 0.931 0.868 0.975 13.775 0.054 256.50 21.67 3035.99 0.991 0.973 1.008
Int. J. Med. Sci. 2008, 5
56
OR 95% CI ROC AUC 95% CI n TP TN FP FN a priori Correct Sens Spec PPV NPV LR+ LR- OR
Lower Upper
ROC
AUC
Lower Upper
D 49 20 28 1 0 0.408 0.980 1.000 0.966 0.932 1.000 29.000 0.000 NaN NaN NaN 0.999 0.996 1.003
E 49 20 24 5 0 0.408 0.898 1.000 0.828 0.734 1.000 5.800 0.000 n/a n/a n/a 0.905 0.816 0.995
No MI in history A 136 6 93 3 34 0.294 0.728 0.150 0.969 0.455 0.868 4.800 0.877 5.47 1.30 23.10 0.667 0.564 0.769
C 136 35 86 10 5 0.294 0.890 0.875 0.896 0.593 0.976 8.400 0.140 60.20 19.19 188.83 0.925 0.868 0.981
E 136 35 85 11 5 0.294 0.882 0.875 0.885 0.570 0.976 7.636 0.141 54.09 17.51 167.12 0.884 0.821 0.946
MI in history A 36 9 17 4 6 0.417 0.722 0.600 0.810 0.616 0.799 3.150 0.494 6.38 1.42 28.60 0.819 0.681 0.957
C 36 14 20 1 1 0.417 0.944 0.933 0.952 0.909 0.966 19.600 0.070 280.00 16.12 4863.44 0.994 0.977 1.010
E 36 15 18 3 0 0.417 0.917 1.000 0.857 0.781 1.000 7.000 0.000 NaN NaN NaN 0.957 0.898 1.016
n = number of cases; TP = true positives; TN = true negatives; FP = false positives; FN = false negatives; a priori = a priori probability of
stenosis; Correct = fraction of correctly predicted cases; Sens = sensitivity; Spec = specificity; PPV = positive predictive value; NPV = negative
predictive value; LR+ = positive likelihood ratio; LR- = negative likelihood ratio; OR = odds ratio; ROC AUC = receiver operating curve area
under the curve (for continuous severity score and probabilities from logistic regression models); 95% CI = 95% confidence interval; Lower =
Lower boundary of 95% CI; Upper = Upper boundary of 95% CI; NaN = Not a number; MI = Myocardial infarction; PCI = percutaneous
coronary intervention; CABG = coronary artery bypass grafting
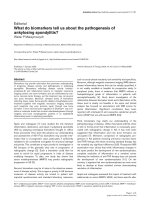
The severity score ranged from 0 to 11.5, mean 2.9
(+/-2.8), with 62.8% of all patients having a severity
score of less than 4. The severity score was
significantly higher for patients with relevant coronary
stenosis as diagnosed at angiography than for patients
without stenosis (5.6 +/- 2.1 vs. 1.7 +/-2.2; p < 0.01;
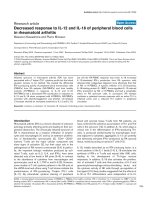
Figure 1). For the association between severity score
and coronary stenosis, the area under the ROC curve
was calculated to be 0.903 [0.855-0.952] (Figure 2). The
coordinates of the curve indicated that a cut-off of 4.0
provided the best combination of sensitivity and
specificity for the prediction of coronary stenosis from
the 3DMP test (as was pre-defined by the
manufacturer).
Coronary Stenosis
yesno
Severity Score
12,00
10,00
8,00
6,00
4,00
2,00
0,00
Figure 1. Severity score versus coronary stenosis as diagnosed
by angiography. Boxplots of severity score. Circles denote
outliers.
Patients without coronary stenosis had a severity
score below 4.0 significantly more frequently than
those with stenosis (p < 0.01), with 89% of all cases
being correctly classified (OR 73.57 [25.10-215.68]). The
results listed in table 4 indicate a sensitivity of 90.9%
and specificity of 88% for the 3DMP test in the
prediction of coronary stenosis (positive predictive
value = 0.627, negative predictive value = 0.978). A
positive likelihood ratio of over 7 and a negative
likelihood ratio of 0.1 indicate a good to strong
diagnostic value for this test (Table 3).
Sensitivity and specificity did not vary
significantly between gender, age groups, or type of
revascularization, although sensitivity was especially
high in patients after CABG, and specificity in older
patients (Table 3). Analysis of ROC also showed that
for each subgroup, the best cut-off was 4.0 (Figure 2).
In a logistic regression model, the addition of all
risk factors did not significantly improve the
classification of coronary stenosis (89.5% correct; OR
80.00 [27.03-236.79]). When information about MI
history was added to this model again the
classification, performance did not change markedly
(89% correct; OR 73.57 [25.10-215.68].
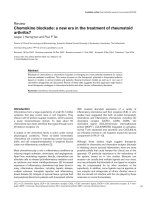
The ROC AUC for a regression model with all
risk factors, all risk factors plus information about MI
history, the severity score alone, a regression model
with the severity score plus all risk factors, and a
regression model with the severity score plus all risk
factors and information about MI history were 0.674
[0.587-0.760], 0.673 [0.585-0.761], 0.903 [0.855-0.952],
0,927 [0.879-0.975], and 0.929 [0.881-0.976] respectively
(Figure 3). Similar results could be found for each
gender and age group (Table 3).
Int. J. Med. Sci. 2008, 5
57
Reference Line
CABG
PCI
1 - Specificity
1,00,80,60,40,20,0
Sensitivity
1,0
0,8
0,6
0,4
0,2
0,0
> 65 yoa
< 65 yoa
male
female
All patients
Figure 2. ROC curves for severity score for the detection of
coronary stenosis for different gender, age groups, and type of
revascularization. yoa = years of age.
1 - Specificity
1,00,80,60,40,20,0
Sensitivity
1,0
0,8
0,6
0,4
0,2
0,0
Reference Line
SC + RF + MI
SC + RF
RF + MI
RF
SC
Figure 3. ROC curves of severity score alone (“SC”), risk
factors (logistic regression model, “RF”), risk factors and MI
history (logistic regression, “RF + MI”), risk factors plus
severity score (logistic regression model, “SC + RF”), and risk
factors plus severity score and MI history (logistic regression
model, “SC + RF+ MI”), for detecting coronary stenosis.
Table 4: Prediction of coronary stenosis by severity score
(cut-off 4.0).
Prediction Cut-off 4.0
no stenosis stenosis
Total
103 14 117 no
59.9% 8.1% 68.0%
5 50 55
Coronary Stenosis
yes
2.9% 29.1% 32.0%
108 64 172 Total
62.8% 37.2% 100.0%
If patients with history of MI were excluded the
diagnostic performance of 3DMP did not change
significantly with 88.2% of these patients correctly
classified (details in Table 3).
To further evaluate performance of 3DMP,
sensitivity and specificity were assessed at different
cut-offs for severity (Table 5). This comparison also
showed that a cut-off of 4.0 provided the best
compromise of sensitivity and specificity. As the
negative predictive value at a cut-off of 4.0 is already
high and increases only slightly with lower cut-offs, a
value of 4.0 may also be suitable for screening in this
patient population.
A second 3DMP test was performed on 38
patients within 4 hours of the first test and before
angiography. The test results were identical in 32
patients. In only 1 patient was the difference in
severity scores greater than 1 and in only 2 patients
would this difference have led to a change in
classification (4.0 and 3.0 for the first test, 3.0 and 4.0
for the second test).
Verification after the end of the data acquisition
confirmed that locally stored and transmitted ECG
data were identical for all recordings.
Table 5: Prediction of coronary stenosis by severity score at different cut-offs for total population (n = 172, a priori probability of
stenosis = 0.372).
OR 95% CI TP TN FP FN a
priori
Correct Sens Spec PPV NPV LR+ LR- OR
Lower Upper
Cut-Off 2.0 53 65 52 2 0.320 0.686 0.964 0.556 0.324 0.986 2.168 0.065 33.13 7.71 142.37
Cut-Off 2.5 53 78 39 2 0.320 0.762 0.964 0.667 0.390 0.988 2.891 0.055 53.00 12.27 228.95
Cut-Off 3.0 51 83 34 4 0.320 0.779 0.927 0.709 0.414 0.978 3.191 0.103 31.13 10.43 92.87
Cut-Off 3.5 50 93 24 5 0.320 0.831 0.909 0.795 0.495 0.975 4.432 0.114 38.75 13.93 107.78
Cut-Off 4.0 50 103 14 5 0.320 0.890 0.909 0.880 0.627 0.978 7.597 0.103 73.57 25.10 215.68
Int. J. Med. Sci. 2008, 5
58
OR 95% CI TP TN FP FN a
priori
Correct Sens Spec PPV NPV LR+ LR- OR
Lower Upper
Cut-Off 4.5 43 104 13 12 0.320 0.855 0.782 0.889 0.609 0.949 7.036 0.245 28.67 12.11 67.83
Cut-Off 5.0 33 107 10 22 0.320 0.814 0.600 0.915 0.608 0.912 7.020 0.437 16.05 6.91 37.30
TP = true positives; TN = true negatives; FP = false positives; FN = false negatives; correct = fraction of correctly predicted cases; Sens =
sensitivity; Spec = specificity; PPV = positive predictive value; NPV = negative predictive value; OR = odds ratio; 95% CI = 95% confidence
interval; Lower = Lower boundary of 95% CI; Upper = Upper boundary of 95% CI
Discussion
The age and gender distributions in the studied
patient group match those of patients with
symptomatic coronary artery disease reported in the
literature [25]. Also the distribution between
post-CABG
and post-PCI patients corresponds to the
official numbers reported for these procedures in most
developed countries [1]. The incidence of clinically
identified
risk factors for CAD among the studied
patients was high across the entire study group. The
calculated relative risks for symptomatic CAD
resulting from the risk factors in the study group is in
the range of what is reported in the literature from
larger epidemiologic studies [14, 15, 16, 17].
The overal
l sensitivity of 90.9% and specificity of
88% of the 3DMP device are in line with results from a
study of 3DMP in patients with CAD but without
previous revascularization done at the same center in
parallel [22]. Similar performance was also reported
f
rom another earlier study, although the results were
based on a quantitative assessment of ischemia by the
3DMP system [21]. The quantitative severity score
used in
the current study was not available at that
time.
Resting ECG analysis, including that of the
12-lead ECG, typically has significantly less sensitivity
in detecting ischemia. Clinical studies report a wide
range of sensitivity from 20% to 70% for acute
myocardial infarction (AMI) and typically less for
hemodynamically significant CAD [9, 26].
Diagn
ostic yield from the ECG can be improved
by exercise testing. Exercise ECG has a reported
specificity of over 80% under ideal conditions.
Clinically, however, the sensitivity is typically not
better than 50-60% and shows significant gender bias
[27, 28, 29, 30]. Performance of exercise ECG testing
can
further be enhanced by multivariate analysis of
ECG and clinical variables. First studies into
computerized, multivariate exercise ECG analysis
showed good to excellent sensitivity in men and
women (83% and 70%, respectively) and specificity
(93%, 89%) [31, 32]. These results were confirmed by a
second
group of researchers [33] and are similar to our
findings with
3DMP. Other researchers used different
statistical approaches and models of multivariate
stress ECG analysis with different sets of variables
included in the models [34, 35, 36, 37]. While these
a
pproaches provided significantly better diagnostic
performance than standard exercise ECG testing, it
appears that none of these methods has been
implemented in broad clinical practice or a commercial
product. It should also be noted that none of the above
studies included patients with previous coronary
revascularization.
In a comprehensive systematic review of 16
prospective studies myocardial perfusion scintigraphy
showed better positive and negative likelihood ratios
than exercise ECG testing [38]. But wide variation
between s
tudies was reported with positive LR
ranging from 0.95 to 8.77 and negative LR from 1.12 to
0.09. Another review of stress scintigraphy studies
showed similar results with a diagnostic accuracy of
85% by wide variation between studies (sensitivity
44%-89%, specificity 89%-94%, for 2+vessel disease)
[39]. In one study the combination of stress ECG
t
esting with myocardial scintigraphy using
multivariate analysis provided only limited
improvement of diagnostic accuracy [40].
Stress
echocardiography performed by
experienced investigators may provide better
sensitivity and specificity than does stress ECG.
Numerous studies into exercise echocardiography as a
diagnostic tool for CAD have been done. Reported
sensitivities range from 31% to over 90% and
specificities from 46% to nearly 100% [41, 42, 43]. With
experienced
investigators, sensitivities of over 70%
and specificities better than 85% can be expected.
While the reported diagnostic performance of
stress echocardiography, myocardial scintigraphy and
stress scintigraphy for the identification of patients
with hemodynamically relevant coronary restenosis,
graft stenosis or denovo stenosis seems to be similar to
that we found for 3DMP, these imaging modalities can
provide additional information such as spatial
localization that the 3DMP method cannot.
In contrast to the study in patients without
previous revascularization from the same center there
were no significant differences with respect to
Int. J. Med. Sci. 2008, 5
59
sensitivity or specificity attributable to gender or age
[22]. This may be due to selection effects, or just to the
smal
ler sample size.
The odds ratio for CAD was 2.04 [0.74-5.62] in a
logistic regression model using the risk factors
identified clinically in this patient group. This is less
than in patients without previous revascularization in
the same setting investigated with the same
methodology [22]. But it is in concordance with large
epidemio
logical studies, although these studies did
not specifically investigate patients after coronary
revascularization [14, 15, 16, 17]. Still, this model could
predict
coronary stenosis only with a sensitivity of
14.5% which is markedly less than for the severity
score. Adding all risk factors, gender, age, and type of
revascularization to the severity score in a logistic
regression model improved prediction of CAD only
marginally (OR 73.57 [25.10-215.68] vs. OR 80.00
[27.03-236.79]).
The endpoint of this study was the morphological
diagnosis of coronary restenosis, de-novo stenosis, or
graft stenosis in coronary angiography, whereas the
investigated electrophysiologic method (3DMP)
assesses functional changes in electrical myocardial
function secondary to changes in coronary blood flow.
Therefore, even under ideal conditions a 100%
coincidence between angiographic findings and 3DMP
results could not be expected. This is probably true for
every electrophysiologic diagnostic method.
Resting and stress ECG in CAD patients
primarily focuses on ST-segment analysis and the
detection of other conduction abnormalities such as
arrhythmias. This is not comparable to the 3DMP
approach, which calculates a severity score for CAD
from a complex mathematical analysis. A comparison
between 3DMP, 12-lead resting ECG, and coronary
angiography in another study showed a higher
sensitivity and specificity for 3DMP than for 12-lead
ECG in the detection of coronary stenosis [
21].
One lim
itation of the present study was that the
angiography results were not explicitly quantified
using a scoring system [44]. Still, the assessment of
coronary
lesions in the study set forth herein was
consistent between two experienced angiographers
who independently evaluated the angiograms.
Moreover, the relevance of morphological
quantification of coronary stenosis in angiograms has
been subject to discussion [45]. Because the target
crit
erion was hemodynamic relevant coronary
stenosis, subclinical or subcritical lesions may have
been classified as non-relevant. This may have
artificially reduced the calculated sensitivity and
specificity of the 3DMP method. Another limitation of
the study may have been patient recruitment. The
patient population represented a convenience sample
of revascularization patients from a larger group of
consecutive patients scheduled for coronary
angiography in a single heart center. While this may
limit the generalizability of the patient sample used
herein, the demographic distribution of this sample
matches well with the distributions reported in the
literature for patients with CAD as do the incidence
and distribution of risk factors. Finally, 3DMP was
compared in this study to angiography but not to any
other non-invasive diagnostic technology. Therefore,
inference about the potential superiority or inferiority
of 3DMP in comparison to other ECG-based methods
can only be drawn indirectly from other studies.
In conclusion, the mathematical analysis of the
ECG by 3DMP appears to provide sensitivity and
specificity for the prediction of relevant restenosis,
de-novo stenosis, and graft stenosis as diagnosed with
coronary angiography in patients after coronary
revascularization that is at least as good as that of
standard resting or stress ECG test methods reported
in other clinical studies. However, this impression
needs to be further confirmed in a direct comparison
between such methods.
Acknowledgements
The authors are extremely grateful to Prof. Hans
Joachim Trampisch, Department for Medical
Informatics, Biometrics and Epidemiology,
Ruhr-University Bochum, Germany, for his critical
review of statistical methodology and data analysis; to
H. Robert Silverstein, MD, FACC, St. Vincent Hospital,
Hartford, CT, USA; and to Eric Fedel, Premier Heart,
LLC, Port Washington, NY, USA, for their constructive
comments and help with the manuscript, and to
Joshua W. Klein, Premier Heart, LLC, Port
Washington, NY, USA, and George Powell, Tokyo,
Japan, for their thorough and thoughtful language
editing.
This study was supported partially by
institutional funds and partially by an unrestricted
research grant from Premier Heart, LLC. Premier
Heart, LLC provided the 3DMP equipment for this
work free of charge.
Competing Interests
Dr. Shen is founder and managing member of
Premier Heart, LLC. He is also co-inventor of the
web-based 3DMP method. The other authors do not
have any disclosures to make.
Int. J. Med. Sci. 2008, 5
60
References
1. OECD. OECD Health Data 2005: Statistics and Indicators for 30
Countries. Paris: OECD Publishing, 2005.
2. Bengtson JR, Mark DB, Honan MB, Rendall DS, Hinohara T,
Stack RS, Hlatky MA, Califf RM, Lee KL, Pryor DB. Detection of
restenosis after elective percutaneous transluminal coronary
angioplasty using the exercise treadmill test. Am J Cardiol. 1990;
65 :28-34.
3. Moses JW, Leon MB, Popma JJ, Fitzgerald PJ, Holmes DR,
O'Shaughnessy C, Caputo RP, Kereiakes DJ, Williams DO,
Teirstein PS, Jaeger JL, Kuntz RE; SIRIUS Investigators.
Sirolimus-eluting stents versus standard stents in patients with
stenosis in a native coronary artery. N Engl J Med. 2003; 349:
1315-1323.
4. Stone GW, Ellis SG, Cox DA, Hermiller J, O'Shaughnessy C,
Mann JT, Turco M, Caputo R, Bergin P, Greenberg J, Popma JJ,
Russell ME; TAXUS-IV Investigators. A polymer-based,
paclitaxel-eluting stent in patients with coronary artery disease.
N Engl J Med. 2004; 350: 221-231.
5. Braunwald E, Antman EM, Beasley JW, et al. ACC/AHA
guideline update for the management of patients with unstable
angina and non-ST-segment elevation myocardial
infarction 2002: summary article: a report of the American
College of Cardiology/American Heart Association Task Force
on Practice Guidelines (Committee on the Management of
Patients With Unstable Angina). Circulation. 2002; 106:
1893-1900.
6. Gibbons RJ, Abrams J, Chatterjee K, et al. ACC/AHA 2002
guideline update for the management of patients with chronic
stable angina summary article: a report of the American College
of Cardiology/American Heart Association Task Force on
practice guidelines (Committee on the Management of Patients
with Chronic Stable Angina). J Am Coll Cardiol. 2003; 41:
159-168.
7. Mason JJ, Owens DK, Harris RA, et al. The role of coronary
angiography and coronary revascularization before noncardiac
vascular surgery. JAMA. 1995; 273: 1919-1925.
8. Scanlon PJ, Faxon DP, Audet AM, et al. ACC/AHA guidelines
for coronary angiography: executive summary and
recommendations. A report of the American College of
Cardiology/American Heart Association Task Force on Practice
Guidelines (Committee on Coronary Angiography) developed
in collaboration with the Society for Cardiac Angiography and
Interventions. Circulation. 1999; 99: 2345-2357.
9. Ammar KA, Kors JA, Yawn BP, et al. Defining unrecognized
myocardial infarction: a call for standardized
electrocardiographic diagnostic criteria. Am Heart J. 2004; 148:
277-284.
10. Salerno SM, Alguire PC, Waxman HS. Competency in
interpretation of 12-lead electrocardiograms: a summary and
appraisal of published evidence. Ann Intern Med. 2003; 138:
751-760.
11. Hecht HS, Shaw RE, Chin HL, Ryan C, Stertzer SH, Myler RK.
Silent ischemia after coronary angioplasty: evaluation of
restenosis and extent of ischemia in asymptomatic patients by
tomographic thallium-201 exercise imaging and comparison
with symptomatic patients. J Am Coll Cardiol. 1991; 17: 670-677.
12. Pirelli S, Danzi GB, Alberti A, Massa D, Piccalo G, Faletra F,
Picano E, Campolo L, De Vita C. Comparison of usefulness of
high-dose dipyridamole echocardiography and exercise
electrocardiography for detection of asymptomatic restenosis
after coronary angioplasty. Am J Cardiol. 1991; 67: 1335-1338.
13. Schroeder E, Marchandise B, De Coster P, Brichant C, Mitri K,
Pieters D, Kremer R. Detection of restenosis after coronary
angioplasty for single-vessel disease: how reliable are exercise
electrocardiography and scintigraphy in asymptomatic patients?
Eur Heart J. 1989; 10: 18-21.
14. Greenland P, Knoll MD, Stamler J, et al. Major risk factors as
antecedents of fatal and nonfatal coronary heart disease events.
JAMA. 2003; 290: 891-897.
15. Khot UN, Khot MB, Bajzer CT, et al. Prevalence of conventional
risk factors in patients with coronary heart disease. JAMA. 2003;
290: 898-904.
16. Wilson PW, D'Agostino RB, Levy D, et al. Prediction of coronary
heart disease using risk factor categories. Circulation. 1998; 97:
1837-1847.
17.
Yusuf S, Hawken S, Ounpuu S, et al; INTER
HEART Study
Investigators. Effect of potentially modifiable risk factors
associated with myocardial infarction in 52 countries (the
INTERHEART study): case-control study. Lancet. 2004; 364:
937-952.
18. Hurst JW. Current status of clinical electrocardiography with
suggestions for the improvement of the interpretive process. Am
J Cardiol. 2003; 92: 1072-1079.
19. Eskola MJ, Nikus KC, Voipio-Pulkki LM, et al. Comparative
accuracy of manual versus computerized electrocardiographic
measurement of J-, ST- and T-wave deviations in patients with
acute coronary syndrome. Am J Cardiol. 2005; 96: 1584-1588.
20. Feng G. EKG and EEG Multiphase Information Analysis (A
collection of unpublished notes, thesis, papers and published
articles from mid seventies to the late eighties translated into
English from Chinese). First Edition. New York, NY: American
Medical Publishers; 1992.
21. Weiss MB, Narasimhadevara SM, Feng GQ, et al.
Computer-enhanced frequency-domain and 12-lead
electrocardiography accurately detect abnormalities consistent
with obstructive and nonobstructive coronary artery disease.
Heart Dis. 2002; 4: 2-12.
22. Grube E, Bootsveld A, Yuecel S, et al. Computerized two-lead
resting ECG analysis for the detection of coronary artery
stenosis. Int J Med Sci. 2007; 7: 249-263.
23. Altman DG, Bland JM. Statistics Notes: Diagnostic tests 2:
predictive values. BMJ. 1994; 309: 102.
24. Deeks JJ, Altman DG. Diagnostic tests 4: likelihood ratios. BMJ.
2004; 329: 168-169.
25. Thom T, Haase N, Rosamond W, et al; American Heart
Association Statistics Committee and Stroke Statistics
Subcommittee. Heart disease and stroke statistics 2006 update:
a report from the American Heart Association Statistics
Committee and Stroke Statistics Subcommittee. Circulation.
2006; 113: e85-151.
26. Mant J, McManus RJ, Oakes RA, et al. Systematic review and
modelling of the investigation of acute and chronic chest pain
presenting in primary care. Health Technol Assess. 2004; 8:
1-158.
27. Anthony D. Diagnosis and screening of coronary artery disease.
Prim Care. 2005; 32: 931-946.
28. Cox JL, Teskey RJ, Lalonde LD, Iles SE. Noninvasive testing in
women presenting with chest pain: evidence for diagnostic
uncertainty. Can J Cardiol. 1995; 11: 885-890.
29. Curzen N, Patel D, Clarke D, et al. Women with chest pain: is
exercise testing worthwhile? Heart. 1996; 76: 156-160.
30. Tak T, Gutierrez R. Comparing stress testing methods. Available
techniques and their use in CAD evaluation. Postgrad Med.
2004; 115: 61-70.
31. Detry JM, Robert A, Luwaert RJ, et al. Diagnostic value of
computerized exercise testing in men without previous
myocardial infarction. A multivariate, compartmental and
probabilistic approach. Eur Heart J. 1985; 6: 227-238.
32. Robert AR, Melin JA, Detry JM. Logistic discriminant analysis
Int. J. Med. Sci. 2008, 5
61
improves diagnostic accuracy of exercise testing for coronary
artery disease in women. Circulation. 1991; 83: 1202-1209.
33. Deckers JW, Rensing BJ, Tijssen JG, et al. A comparison of
methods of analysing exercise tests for diagnosis of coronary
artery disease. Br Heart J. 1989; 62: 438-444.
34. Koide Y, Yotsukura M, Yoshino H, Ishikawa K. A new coronary
artery disease index of treadmill exercise electrocardiograms
based on the step-up diagnostic method. Am J Cardiol. 2001; 87:
142-147.
35. Lehtinen R, Sievänen H, Uusitalo A, et al. Performance
characteristics of various exercise ECG classifiers in different
clinical populations. J Electrocardiol. 1994; 27: 11-22.
36. Pruvost P, Lablanche JM, Beuscart R, et al. Enhanced efficacy of
computerized exercise test by multivariate analysis for the
diagnosis of coronary artery disease. A study of 558 men
without previous myocardial infarction. Eur Heart J. 1987; 8:
1287-1294.
37. Rodriguez M, Moussa I, Froning J, et al. Improved exercise test
accuracy using discriminant function analysis and "recovery ST
slope". J Electrocardiol. 1993; 26: 207-218.
38. Mowatt G, Vale L, Brazzelli M, Hernandez R, Murray A, Scott N,
Fraser C, McKenzie L, Gemmell H, Hillis G, Metcalfe M.
Systematic review of the effectiveness and cost-effectiveness,
and economic evaluation, of myocardial perfusion scintigraphy
for the diagnosis and management of angina and myocardial
infarction. Health Technol Assess. 2004; 8: 1-207.
39. Elhendy A, Bax JJ, Poldermans D. Dobutamine stress myocardial
perfusion imaging in coronary artery disease. J Nucl Med. 2002;
43: 1634-1646.
40. Morise AP, Diamond GA, Detrano R, Bobbio M. Incremental
value of exercise electrocardiography and thallium-201 testing in
men and women for the presence and extent of coronary artery
disease. Am Heart J. 1995; 130: 267-276.
41. Geleijnse ML, Krenning BJ, Soliman OI, et al. Dobutamine stress
echocardiography for the detection of coronary artery disease in
women. Am J Cardiol. 2007; 99: 714-717.
42. Marwick TH, Shaw L, Case C, Vasey C, Thomas JD. Clinical and
economic impact of exercise electrocardiography and exercise
echocardiography in clinical practice. Eur Heart J. 2003; 24:
1153-1163.
43. Smart SC, Bhatia A, Hellman R, et al. Dobutamine-atropine
stress echocardiography and dipyridamole sestamibi
scintigraphy for the detection of coronary artery disease:
limitations and concordance. J Am Coll Cardiol. 2000; 36:
1265-1273.
44. Alderman E, Stadius M. The angiographic definitions of the
bypass angioplasty re-vascularization investigation. Coron
Artery Dis. 1992; 3: 1189-1207.
45. Kuntz RE, Baim DS. Defining coronary stenosis: Newer clinical
and angiographic paradigms. Circulation. 1993; 88: 1310-1323.