Desiccant Enhanced Evaporative Air-Conditioning phần 4 doc
Bạn đang xem bản rút gọn của tài liệu. Xem và tải ngay bản đầy đủ của tài liệu tại đây (5.22 MB, 10 trang )
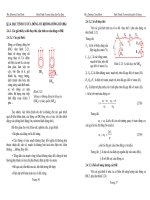
Figure 3-10 Indoor RH histograms for Houston in June–August
3.4.3 New and Retrofit Commercial
The EnergyPlus model completed in 2008 experienced issues that prevented humidity control
from being implemented for the load profile in EnergyPlus. As a result, the RH frequently went
out of control (see Figure 3-11 and Figure 3-12). This generally happens when the building is
empty and the air conditioner is shut down (nights and weekends). This results in high latent
removal (generally in the morning), during the building warm-up period. The DEVap is driven
to achieve the same load profile that the A/C provided, thus the DEVap building would have the
same RH histogram. The DEVap and DX A/C latent removal are equal.
Houston, TX
0%
25%
50%
75%
100%
0
100
200
300
400
500
600
700
Frequency (hours)
Frequency
Cumulative %
4%
10%
16%
22%
28%
34%
40%
46%
52%
58%
64%
70%
76%
82%
88%
94%
100%
RH Bins
Figure 3-11 RH histogram for a small office benchmark in Houston
31
Latent Comparison
0%
20%
40%
60%
80%
100%
0
20
40
60
80
100
Relative Humidity
Latent Load (tons)
27-Jun 4-Jul 11-Jul 18-Jul 25-Jul
DEVap A/C
DX A/C
Return Air RH
Figure 3-12 Latent load comparison and resultant space RH in Houston
(DEVap A/C and DX A/C latent load profiles overlap)
3.5 Energy Performance
For all energy performance calculations, the conversion factors in Table 3–7 are used.
Table 3-7 Source Energy Conversion Factors (Deru et al, 2007)
Source
Factor
Electric source energy
3.365
Natural gas source energy
1.092
For the new residential simulations, the total source energy was for the sum of all the electric and
thermal source energy to run the A/C systems, mechanical ventilator, and dehumidifier. For
retrofit residential simulations, no mechanical ventilation is required in the DX case.
For commercial, the source energy for cooling is the sum of all the electrical energy to run the
DX system, only when there is a call for cooling. Similarly for the DEVap A/C, electrical and
thermal energy is summed only for periods when there is a call for cooling.
Water use impacts for the DEVap and DX A/C are summed to include on-site and off-site water
use. Electric power plants evaporate at 0.5–4.4 gal/kWh in the United States (Torcellini et al.
2003). Including on-site and off-site water use on a per ton·h basis is a reasonable metric to
determine water impact on a regional scale.
3.5.1 New Residential
Power comparison for Houston is shown in Figure 3-13; peak yearly power consumption is
shown in Figure 3-14. From inspection, the peak electricity draw of the DEVap A/C is
considerably less than the standard A/C. This is primarily because compressor power is
eliminated and replaced with only fan power to push air through the DEVap cooling core. Most
of an A/C’s energy use is switched from electricity to thermal energy when switching from DX
to DEVap. In this analysis, natural gas is used as the thermal source.
32
Standard DX A/C Power
DEVap A/C Power
16
16
14
14
12
12
10
10
0 2000 4000 6000 8000
0 2000
4000 6000 8000
kW
kW
8
8
Source
Source
6
6
Natural Gas
Elecric
4
4
Electric
2
2
0
0
Hour of Year
Hour of Year
Figure 3-13 A/C power comparison in Houston for residential new construction
Phoenix
SF DC Tampa Atlanta Chicago Boston Houston
Peak DEVap A/C
1.00
0.67
0.74
0.96
0.95
0.72
0.72
0.97
Peak Standard A/C
5.09 3.22 4.31 4.06 5.01 4.15 4.02 5.21
0.0
1.0
2.0
3.0
4.0
5.0
6.0
Peak kW
Peak Power (kW)
Figure 3-14 Peak power in all cities, residential new construction
Source energy use is shown in Figure 3-15. DEVap source energy savings are 29%–66% across
all the cities modeled. Although significant savings are shown, DEVap has yet to be optimized
for energy performance. The lower RH provided by the DEVap A/C comes with an energy
penalty. Humidity control and energy use still require additional optimization for a more
accurate comparison on an energy basis.
Figure 3-16 shows the specific water use (gal/ton·h) for all the cities modeled in terms of site
water use and water use at the power plant (off site). Off-site water is calculated using a
conversion of 1 gal/kWh-electric.
33
0
5,000
10,000
15,000
20,000
25,000
30,000
35,000
40,000
kWh (source)
DEVap A/C
DX A/C
Phoenix
SF
DC
Tampa
Atlanta
Chicago
Boston
Houston
Figure 3-15 Source energy in all cities, residential new construction
7
Site - DEVap A/C
Gallons / Ton-h
6
5
4
3
2
1
0
Offsite, DEVap A/C
Offsite - DX A/C
Phoenix
SF
DC
Tampa
Atlanta
Chicago
Boston
Houston
Figure 3-16 Water use (evaporation) in all cities, residential new construction
(assumes 1 gal/kWh for electric generation)
34
3.5.2 Retrofit Residential
Power comparison for Houston is shown in Figure 3-17; peak power comparisons are shown in
Figure 3-18. Similar to the new construction cases, the peak electricity draw of the DEVap A/C
is considerably less than the standard A/C.
Standard DX A/C Power
DEVap A/C Power
20
20
18
18
16
16
14
14
12
12
Electric
6
6
Electric
4
4
2
2
0
0 2000 4000 6000 8000
0 2000 4000 6000 8000
0
Hour of Year
Hour of Year
Figure 3-17 A/C power comparison in Houston for residential retrofit case
kW
kW
10
10
Source
Source
8
8
Natural Gas
Phoenix
SF
DC
Tampa
Atlanta
Chicago
Boston
Houston
Peak DEVap A/C
1.00
0.54
0.72
0.73
0.72
0.74
0.69 0.74
Peak Standard A/C
5.11
2.09
4.30
4.21
4.21
4.18
4.15
4.25
0.0
1.0
2.0
3.0
4.0
5.0
6.0
Peak kW
Peak Power (kW)
Figure 3-18 Peak power in all cities for residential retrofit case
Source energy use is shown in Figure 3-19. DEVap source energy savings range from 1% to
67% across all the cities modeled. Performance in Tampa and Houston are noticeably different
than in the new construction case. In these cases, the standard A/C system is able to provide
most of the humidity control without the help of the stand-alone dehumidifier. The retrofit
construction case magnifies that DEVap requires additional optimization for energy
performance. Figure 3-20 shows the specific water use for all the cities modeled.
35
0
5,000
10,000
15,000
20,000
25,000
30,000
35,000
kWh (source)
DEVap A/C
DX A/C
Phoenix
SF
DC
Tampa
Atlanta
Chicago
Boston
Houston
Figure 3-19 Source energy in all cities for residential retrofit case
4
Site
-
DEVap A/C
Offsite
-
DEVap A/C
Offsite
-
DX A/C
Phoenix
SF
DC
Tampa
Atlanta
Chicago
Boston
Houston
Gallons / Ton
3
-
2
1
0
Figure 3-20 Water use (evaporation) in all cities, residential retrofit construction
(assumes 1 gal/kWh for electric generation)
36
40
3.5.3 New and Retrofit Commercial
Figure 3-21 and Figure 3-22 show the energy performance of the DX and DEVap A/C in an
hourly plot in both Houston and Phoenix. The electricity use and switch to thermal energy (in
this case, natural gas) is evident as with the residential cases. In both cities, the peak electricity
is reduced by 80%.
SEER 16 DX A/C Power
DEVap A/C Power
0
10
20
30
40
50
kW
Source Energy [kwh]
Electric Energy [kwh]
0
10
20
30
40
50
kW
Source Energy [kWh]
Thermal Energy [kWh]
Electric Energy [kWh]
1-Jan 2-Mar 1-May 30-Jun 29-Aug 28-Oct 27-Dec
1-Jan 2-Mar 1-May 30-Jun 29-Aug 28-Oct 27-Dec
Figure 3-21 A/C power comparison for a small office benchmark in Phoenix
SEER 16 DX A/C Power
DEVap A/C Power
40
0
10
20
30
Source Energy
Electric Energy
1-Jan 2-Mar 1-May 30-Jun 29-Aug 28-Oct 27-Dec
0
10
20
30
kW
Source Energy
Thermal Energy
Electric Energy
1-Jan 2-Mar
1-May 30-Jun 29
-Aug 28-Oct 27-Dec
kW
Figure 3-22 A/C power comparison for a small office benchmark in Houston
Table 3-8 and Table 3-9 show the results of the simulation in the two cities. The peak electricity
reduction and the total electricity reduction are about 80% and 90%, respectively. The cooling
source energy reductions of 39% and 84% are primarily due to the efficiency gain of the DEVap
A/C. The total energy reduction accounts for energy used to ventilate and distribute air
throughout the year. For the DEVap case, the air flow is set back by 50% during times when
there is no A/C or heating. The variable-speed fan in the DEVap A/C results in energy savings,
because this mode of operation is easily implemented. DX can, however, also implement a
variable-speed fan with added cost. Site water evaporation is 2.08–2.68 gal/ton·h for the two
cities. This level of water consumption is similar to the water used by A/C when electric power
plant water draw (off-site) is considered. For comparison, a modest 1.0 gal/kWh was assumed
for off-site water consumption. Water use by electricity plants was not compared at the state
level because electricity is not bound by state borders. Furthermore, a reliable database of per-
state water use by utilities is not readily available.
37
Table 3-8 Results Summary for Phoenix
Simulation
DX
DEVap
Units
Difference
(%)
Total cooling
15,724
15,725
ton·h
0%
Sensible cooling
14,915
14,909
ton·h
0%
Latent cooling
809
816
ton·h
1%
Cooling electric energy
18,609
1,717
kWh
–91%
Total electric energy
31255
1,891
kWh
–94%
Cooling thermal energy
0
3,707
kWh
Cooling source energy
63,270
9,917
kWh
–84%
Total source energy
106,268
10,506
kWh
–90%
Cooling electric energy (specific)
1.18
0.11
kW/ton
–91%
Source cooling COP
0.87
5.58
–
538%
Peak electric
11.63
2.33
kW
–80%
Total site water evaporation
0
42,224
gal
Total site water evaporation
0.00
2.69
gal/ton·h
Total off-site water use (1 gal/kWh)
31,255
1891
gal
–94%
Total off-site water use (1 gal/kWh)
1.99
0.12
gal/ton·h
–94%
Table 3-9 Results Summary for Houston
Simulation
DX
DEVap
Units
Difference
(%)
Total cooling
14,819
14,695
ton·h
–1%
Sensible cooling
9,933
9,927
ton·h
0%
Latent cooling
4,886
4,768
ton·h
–2%
Cooling electric energy
15,750
1,579
kWh
–90%
Total electric energy
27,166
1,747
kWh
–94%
Cooling thermal energy
0
24,931
kWh
Cooling source energy
53,550
32,791
kWh
–39%
Total source energy
92,366
33,365
kWh
–64%
Cooling electric energy (specific)
1.06
0.11
kW/ton
–90%
Source cooling COP
0.97
1.58
–
62%
Peak electric
10.26
2.18
kW
–79%
Total site water evaporation
0
30511
gal
Total site water evaporation
0.00
2.08
gal/ton·h
Total off-site water use (1 gal/kWh)
27,166
1,747
gal
–94%
Total off-site water use (1 gal/kWh)
1.83
0.12
gal/ton·h
–94%
3.6 Residential Cost Performance
Figure 3-23 shows the annualized LCCs for DX and DEVap A/C in new construction. These
include loan payments, electricity, natural gas, and water. Using 2010 natural gas prices, the
LCCs for DEVap are less than for DX A/C in most cities. The costs of the two systems in many
locations are approximately the same given uncertainties in this analysis. Assuming 50% higher
gas prices has a larger effect in cities that require much dehumidification.
38
$3,000
$2,500
$2,000
DX A/C
DEVap A/C, current gas prices
DEVap A/C, 50% higher gas prices
$/year
$1,500
$1,000
$500
$-
Phoenix
SF
DC
Tampa
Atlanta
Chicago
Boston
Houston
Figure 3-23 Annualized cost comparison for residential new construction
Figure 3-24 illustrates the cost breakdown for Houston and Phoenix. The upfront costs for
DEVap A/C are higher than for DX A/C, but the lower energy costs quickly compensate. Gas
price uncertainty in places like Tampa and DC (not shown), may result in higher overall cost for
DEVap A/C.
Figure 3-24 LCCs for residential new construction for Phoenix (hot, dry) and Houston (hot, humid)
(loan is the repayment of the loan due to the upfront cost of each system)
39
Figure 3-25 shows the annualized LCCs for DX A/C and DEVap A/C for the retrofit case. Costs
for DEVap are higher in Tampa and lower in Phoenix, but uncertainties prevent a distinct
conclusion in other locations. In general, the relative cost of DEVap A/C compared to DX A/C
is higher for the retrofit case than for the new construction case because:
• The assumed financing for the retrofit case (5-year loan at 7%) is more sensitive than the
new construction case (30-year mortgage at 5%) to upfront costs and DEVap has a higher
upfront cost. This is also evident from Figure 3-26, which shows the cost breakdown for
each system in Houston and Phoenix.
• Although DEVap still provides mechanical ventilation, none is required for the retrofit
case. This results in energy savings for the standard DX A/C, which brings no OA into
the house.
• The higher SHRs in the retrofit case compared to new construction result in a smaller
energy penalty for DX A/C. As homes become tighter and latent loads comprise a larger
portion of the total load, this energy penalty increases for DX A/C and makes DEVap
A/C more competitive.
These analyses do not include the effects of time-of-use pricing and potential peak demand
charges that may soon come to bear in the residential energy market. Such pricing would
inevitably improve the economics of the DEVap A/C because it effects reductions in electricity
use.
Figure 3-25 Cost comparison for residential retrofit
40