Engineering Materials and Processes phần 8 pdf
Bạn đang xem bản rút gọn của tài liệu. Xem và tải ngay bản đầy đủ của tài liệu tại đây (162.37 KB, 14 trang )
Integration Issues 89
30 40 50 60 70 80 90
6
7
8
9
10
11
12
13
14
Ag(200nm)/Al(30nm) on SiO
2
400
o
C
500
o
C
600
o
C
Thickness (nm)
time
1/2
(s
1/2
)
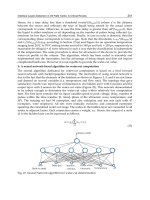
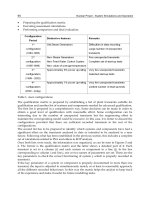
Figure 6.6. Al oxide thickness as a square root function of time for an Ag(200nm)/Al(30
nm) bilayer system [8]
6.1.3.2 Growth Kinetics of Oxide Surface Layer
In order to investigate the growth kinetics, the thickness of either aluminum or
silver was changed. The influence of the initial Al thickness on the oxide growth
kinetics was studied by considering the following two bilayers structures: Ag(200
nm)/Al(20 nm) and Ag(200 nm)/Al(30 nm). The Al
x
O
y
thickness (x) derived from
the RBS data presented in the previous sections was plotted as a function of the
square root of annealing time (t
1/2
) for the range 15 to 120 minutes (Figures 6.5 and
6.6). Note the square root of annealing time is expressed in seconds in Figures 6.5
and 6.6. The plots of thickness (x) versus square root of time are straight lines,
which imply that the oxide growth follows a parabolic growth behavior (x
2
~t). In
Figure 6.5, the slopes of the 500 and 600°C are almost parallel compare to the
400°C anneal.
For the thicker Al(30 nm), the lines are almost all parallel to each other (Figure
6.6). The diffusion coefficient D for the different bilayers Ag(200 nm)/Al(20 nm)
and Ag(200 nm)/Al(30 nm) systems annealed at different temperatures were
determined by taking the squares of the slopes of the plots in Figures 6.5 and 6.6.
The results of these diffusion coefficients are given in Table 6.1 and reflect the
behavior of the plots of thickness versus time
1/2
. The diffusion coefficient increases
as a function of temperature and is the highest for the 600°C anneal. It was found
that the growth rates are much higher in Ag(200 nm)/Al(20 nm) than those in
Ag(200 nm)/Al(30 nm) bilayers.
90 Silver Metallization
Table 6.1. Effect of temperature on the rate constants in the Ag/Al bilayer system for
annealing times greater than 15 minutes [8]
Diffusion coefficient D (10
–21
m
2
/s) of Al oxide
Temperature (°C)
Ag(200 nm)/Al(20 nm) Ag(200 nm)/Al(30 nm)
400 0.25 0.80
500 5.78 1.59
600 6.18 3.06
Figure 6.7 is a plot of the logarithm of the growth rate versus the reciprocal of
temperature for two different Ag/Al bilayer systems. The two straight lines in
Figure 6.7 are linear fits of the experimental data in Table 6.1. Based on the least
square fit of the slopes in Figure 6.7, the activation energy (E
a
) was determined
from the Arrhenius plots. The activation energy is E
a
= 0.25±0.15 eV for the
Ag(200 nm)/Al(20 nm) bilayer and E
a
= 0.34±0.05 eV for the Ag (200 nm)/Al(30
nm) bilayers and represents the energy barrier of the limiting step in the surface
oxide formation process.
1.1 1.2 1.3 1.4 1.5
0
1
2
3
4
5
6
7
8
Ag(200nm)/Al(20nm)
Ag(200nm)/Al(30nm)
1000/T (K
-1
)
Ln[D] (m
2
/s) x 10
-21
Figure 6.7. Arrhenius plots for Ag (200 nm)/Al (20 nm) and Ag (200 nm)/Al(30 nm)
bilayer structures for different temperatures [8]
Integration Issues 91
6.1.3.3 Factors Influencing the Transport of Aluminum Through the Silver
The focus of this section is to investigate the effect of factors such as Al thickness
and trapping of Al in the silver on the transport kinetics and subsequent formation
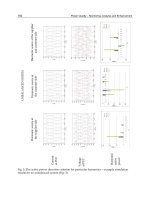
of the surface oxide. The curves in Figure 6.8a and b show the transport ratio
M(t)/M(∞) of Al atoms through the Ag layer as a function of time for Ag(200
nm)/Al(20 nm) and Ag(200 nm)/Al(30 nm) bilayer structures annealed at different
temperatures. The transport ratio based on RBS data was calculated using the
amount of Al diffusing after time t, M(t) and the amount after infinite time, t→∞
defined as M(∞). It is observed that the transport ratio increases dramatically after
Figure 6.8. Transport ratio of Al atoms through the Ag layers annealed at different
temperatures, (a) Al(20 nm)/Ag(200 nm) and (b) Al (30 nm)/Ag(200 nm) [8]
0 20406080100120
0.0
0.1
0.2
0.3
0.4
0.5
8
M(t)
M( )
Annealing Time
(a) Al(20 nm)/Ag(200 nm)
600
o
C
500
o
C
400
o
C
0 20406080100120
0.0
0.2
0.4
0.6
0.8
1.0
8
(b) Al(30 nm )/Ag(200 nm)
600
o
C
500
o
C
400
o
C
M(t)
M( )
Annealing Time
92 Silver Metallization
short anneals at all temperatures; but it remained almost constant after 15–120
minutes for 400°C anneals.
For the 500°C anneal, the Al transport ratio shows a linear increase to a
maximum value of ~0.3 (Figure 6.8a). By increasing the Al thickness to 30 nm
(Figure 6.8b), the experimental data shows that annealing in the temperature range
400–600°C for times between 15 and 120 minutes; the transport ratio of Al
outdiffusion almost shows the same behavior for all temperatures; that is a rapid
increase at short times followed by a plateau-like behavior.
At 600°C, the Al transport ratio takes longer to reach plateau-like behavior. For
the different thicknesses, the data shows the same behavior for annealing
temperatures ≥600°C.
The plot in Figure 6.9 shows the profiles for the residual Al and O
concentration in Ag as a function of temperature for the Ag(200 nm)/Al(20 nm)
and Ag(200 nm)/Al(30 nm) bilayers structures, respectively. From Figure 6.9, it
follows that for a thin initial Al thickness (20 nm) the residual O mimics the Al; it
displays a very slow increase with temperature.
For the thicker Al, the percentage of residual Al increases linearly up to about
400°C, whereafter it flattens to some constant value ~6.2 at.%. The percentage of
O, however, increases almost linearly with temperature for the thicker Al(30 nm)
layer.
0 200 400 600
0
4
8
12
Residual Concentration (at. %)
Temperature (
o
C)
Al(20nm): Oxygen
Al(20nm): Aluminum
Al(30nm): Oxygen
Al(30nm): Aluminum
Figure 6.9. Plot of residual Al and O concentration in Ag layer as a function of annealing
temperature [8]
Integration Issues 93
6.1.4 Discussion
6.1.4.1 Formation of Aluminum Oxide Surface Layer
By annealing a Ag/Al bilayer structure in an ammonia ambient, the Al segregates
to the surface to react with residual O in the ambient to form an Al
x
O
y
layer on the
surface of the Ag. For the temperature range (400–600°C) considered in this
investigation, no nitridation reaction between Al and N was detected. Wang et al.
only formed an oxynitride from annealing the Ag/Al bilayers structure in NH
3
at
725°C. The thermodynamic data supported these results since the Gibbs free
energy for consumption of 1 mol of O to form Al
2
O
3
at 725°C is much lower,
~606.079 kJ/mol (~6.292 eV/Al atom), than that of N to form AlN, ~217.923
kJ/mol (~2.262 eV/Al atom). From the resonance data, it was shown in Figure 6.4
that the Al/O ratio is ~0.64 which points to the formation of Al
2
O
3
. Previous
studies [6] showed that for Ag/Ti bilayers annealed in an NH
3
ambient at
temperatures 300–700°C, TiN(O) encapsulation films are formed at the surface
instead of Ti-oxide. The large negative heat of formation of TiO
2
(222–365 kJ/mol)
compared to that of TiN (169 kJ/mol) is compensated by the partial pressure of
NH
3
relative to that of O
2
, leading to nitride rather than oxide formation.
The smaller thermal decomposition energy of NH
3
(432 kJ/mol) compared to
N
2
(942 kJ/mol) makes it possible to form Ti-nitride at relatively lower
temperatures. The data indicate that the amount of Al that segregates to the surface
depends on the annealing temperature and annealing time. At higher temperatures
and times, more Al moves to the free surface. A high residual Al, however,
remains in the Ag(200 nm)/Al(20 nm) and Ag(200 nm)/Al(30 nm) structures after
annealing at temperatures up to 600°C for times 15–120 minutes. This high level of
residual Al is believed to be due to trapping of the aluminum in the Ag film.
6.1.4.2 Growth Kinetics of Oxide Surface Layer
The results obtained from the kinetics study suggest a parabolic growth behavior,
which implies that the diffusion of the reaction species is the process governing the
oxidation reaction. That is, the growth is governed by the diffusion of Al through
the Ag layer. Due to the parabolic (x~t
1/2
) behavior of the growth kinetics, the
oxide growth is diffusion-controlled. Based on the data in Table 6.1, it follows that
the diffusion coefficient is higher for the Ag(200 nm)/Al(20 nm) bilayers than that
of the Ag(200 nm)/Al(30 nm) bilayer. The activation energies are 0.25 eV for
Ag(200 nm)/Al(20 nm) and 0.34 eV for Ag(200 nm)/Al(30 nm) structures. These
values of the activation energies are in agreement with that reported in literature
(0.3–0.44 eV) [2]. Due to the fact that there is no significant difference in the
activation energies for the two different thicknesses, it seems that the activation
energy is approximately independent of the thickness.
94 Silver Metallization
6.1.4.3 Factors Influencing the Transport of Aluminum Through Silver
Wang et al. [5] reported that the segregation of Al in Ag/Al system annealed in an
NH
3
ambient is influenced by the following factors: the chemical affinity between
Al and Ag, the formation of a solid solution, intermetallic compound formation, a
competition between the trapping of Al by the Ag and the diffusion of Al to the
reaction surface, and the interfacial energy barrier between the newly formed Al
oxide barrier and the underlying Ag layer. Based on these factors, they formulated
a model to explain the transport of Al through Ag and derived an expression for the
transport ratio M(t)/M(∞), given by the following equation [5]:
∑
∞
=
++
+−
−=
∞
1
222
222
)(
)]1(/exp[2
1
)(
)(
n
nn
n
LL
RlDtL
M
tM
ββ
β
(6.1)
where, βtanβ = L are the positive roots of the equation,
)/(
)/(
TkE
b
eDlL
Δ−
=
α
is a dimensionless parameter, α is a constant of
proportionality with units of velocity (cm/s), l is the thickness of Ag; T is the
temperature and k
b
is Boltman’s constant. R is a constant, which accounts for the
chemical effects between the trapped Al and Ag; depends on the diffusion process
and was chosen to be 500 to fit the experimental data. One of the fundamental
assumptions made in the derivation of the model is that the customary diffusion
equation be modified as given in Equation 6.2 [5], to (a) account for the
accumulation of Al at the Ag/Al-oxide interface, and (b) assume constant self-
diffusivity of Al (D) instead of grain boundary diffusivity.
2
2
1
x
C
R
D
t
C
∂
∂
+
=
∂
∂
(6.2)
The constant R = S/C, where S = trapped Al concentration and C =
concentration of the free diffusing Al atoms. Complete details about the
assumptions and derivations of Equation 6.2 are given in [5]. The theoretical
results calculated from the Equation 6.1 are depicted in Figure 6.10 for two
different Ag/Al bilayers thickness.
Integration Issues 95
0 5 10 15 20 25 30
0.0
0.2
0.4
0.6
0.8
1.0
8
M(t)
M( )
Annealing Time (min)
100 nm Ag
200 nm Ag
Figure 6.10. Theoretical calculated plot of the transport ratio of Al atoms through the Ag
layers for different thicknesses: 100 nm (solid line) and 200 nm (dashed line) [5].
At higher temperatures, the transport ratio for different thicknesses follows the
theoretical model. For the thicker Al(20–30 nm) films, a lower transport ratio was
obtained than the theoretical curves. The lower transport ratio in this study
compared to the calculated curves is attributed to the higher residual Al
concentration in the Ag. The higher residual Al is a direct consequence of the
increased trapping of Al in the Ag, which in turn is a result of the reduction of SiO
2
into free Si and O. For thin Al layers ~8 nm, the reduction of SiO
2
by Al can be
neglected. The results in the present study suggest that for thicker Al (20–30 nm)
films the reduction of SiO
2
has to be taken into account since it has an effect on the
trapping of Al in the silver, in the sense that the Al reacts with freed O. The
reduction of SiO
2
by Al is governed by the following reaction and enthalpy data:
4Al + 3SiO
2
→ 2Al
2
O
3
+ 3 Si, ΔH = –658 kJ/mol (6.3)
The oxygen freed by the reduction of SiO
2
confines the Al inside the Ag and hence
is in direct competition with the surface reaction given by:
4Al + 3O
2
→ 2Al
2
O
3
, ΔH = –1675 kJ/mol (6.4)
96 Silver Metallization
As a result of the reaction between the diffused Al and freed O, some Al are
trapped inside the Ag instead of being available for the surface reaction. The
presence of O in Ag layer explains the lower backscattering yields of the Ag signal
of the annealed samples compared to the as-deposited ones. The larger trapping of
Al in Ag suggests a greater value of R than that used in the theoretical model
calculations.
According to Equation 6.1 if R increases the transport ratio, M(t)/M(∞),
decreases, which explains our lower ratio. The larger trapping factor is due to the
presence of O in Ag and implies an increased barrier to Al transport through the
Ag. Figure 6.11 depicts the effect of the increased barrier on the Al transport
through the Ag. The dotted line is the barrier height based on results obtained from
the studies of the thin Al (~8 nm) interlayer and where the reduction of SiO
2
is
neglected [5]. This model explains the kinetics of Al diffusion through Ag as a
combination of a competitive behavior between the diffusion in Ag and the
trapping of Al atoms at the Ag/Al oxide interface. The increased barrier as a result
of the increased trapping of Al results in less Al diffusion to the surface and hence
thinner Al oxide layers despite thicker aluminum interlayers.
Figure 6.11. Schematic representation of the diffusion model of Al through Ag [5]
SiO
2
Ag (l)
Al
Al
x
O
y
Al diffusion
Interfacial Energy Barrier
Δ
E
Trapped Al atom
Reaction Front
Integration Issues 97
6.1.5 Conclusions
In this study Al
2
O
3
encapsulation of Ag was successfully obtained by annealing a
Ag(~200 nm)/Al(~20–30 nm) bilayer in a flowing NH
3
ambient at temperature
between 400 and 600°C, for times 15–120 minutes. It is believed that an Al-
oxynitride as a result of the nitridation of Al will only be formed when Ag/Al
bilayers are annealed in NH
3
at temperatures >600°C. The kinetics of Ag/Al
bilayers was studied to understand the factors influencing the transport of Al
through Ag. The aluminum oxide formation follows a t
1/2
dependence implying a
diffusion-controlled mechanism. To form a surface oxide for the Ag (200
nm)/Al(20 nm) and Ag(200 nm)/Al(30 nm) structures, an activation energy
between 0.25 and 0.34 eV was obtained. The Al thickness has almost no significant
influence on the activation energies.
A larger trapping factor was obtained for the thicker Al due to the reduction of
the underlying SiO
2
substrate. The larger trapping factor results in a lower transport
ratio M(t)/M(∞). The O freed during the reduction of SiO
2
ties up the Al and
causes a larger barrier to the Al available for reaction at the surface to form the Al-
oxide passivation layer. It is therefore evident that the thicker Al layers (20–30 nm)
do not affect the kinetics in terms of the activation energy but has a significant
influence on the trapping of Al as a result of the reduction of the SiO
2
substrate.
The increased trapping leads to undesirable high residual Al levels, which is
detrimental to the electrical properties of the Ag metallization.
Previous studies [7] have shown that the accumulated Al concentration dictates
the resistivity of the silver films and that the resistivity increases with the amount
of Al that remains in the Ag film after annealing. It is, therefore, desirable to use
Al interlayers < 10 nm for encapsulation of Ag, because in this case the residual Al
is lower and resistivities comparable with bulk values of Ag can be obtained at
~700°C [4, 8].
6.2 Effect of Metals and Oxidizing Ambient on Interfacial
Reactions
6.2.1 Introduction
Thin film metallurgies have been of importance in many areas of technological
significance, including semiconductor devices, surface coating, interface
metallurgy, and corrosion resistance. The interactions occurring in the metal–metal
or metal–silicon systems therefore dictate the stability and properties of these
systems. Among the factors that affect thin film interactions, i.e. provide the
driving forces, is the ambient in which the thin film resides during annealing or
operation of the structures.
Interest in metals such as Ag, Au and Cu in metallization schemes for
integrated circuit technology necessitates the investigation of the stability of these
metals when in contact with silicon [1, 3, 9–10]. It has been shown that Cu reacts
98 Silver Metallization
with silicon at temperatures as low as 200°C to form the silicide, Cu
3
Si [10]. When
this structure is left at room temperature, a 1 mm-thick oxide grows at the Si–Cu
3
Si
interface. Therefore, in the Si/Cu
3
Si system silicon oxidation occurs at room
temperature compared to thermal oxidation, which requires temperatures between
1000 and 1200°C to form oxides of appreciable thickness. The Cu
3
Si catalyzes the
oxidation of silicon [9].
In pioneering work, Hiraki et al. [11], reported on the effect of Au on the low
temperature oxidation of silicon. The interaction between metals (Au and Ag) and
silicon in an oxidizing ambient is investigated.
6.2.2 Experimental Details
Gold and silver layers of thickness varying from 50 to 150 nm were deposited on
Si(100) substrates via electron-beam evaporation. The base and operating pressure
were 10
–7
and 10
–6
Torr, respectively. All anneals were performed in a Lindberg
single-zone quartz tube furnace under a flowing O
2
ambient for times varying from
30 to 120 min at temperatures ranging from 200 to 350°C.
Rutherford backscattering spectrometry (RBS) was used to determine the
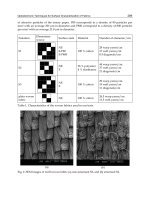
composition and thickness of the different layers. Scanning electron microscopy
(SEM) and transmission electron microscopy (TEM) were used to evaluate the
surface morphology and microstructure of the Au/Si and Ag/Si systems,
respectively. The SEM was operated at 10 kV at a working distance of 5 mm to
obtain surface information at high resolution. All XTEM images were taken at
200 keV.
6.2.3 Results
Figure 6.12 compares the RBS spectrum of an as-deposited Au(50 nm)/Si(100)
structure with that annealed at 350°C for 60 minutes in an O
2
ambient. During
annealing in the oxidizing ambient, an intermixed ‘‘Au+Si’’ is formed and silicon
is freed to diffuse to the surface. At the surface the diffused silicon reacts with the
oxygen to form a silicon oxide. The presence of the oxide is confirmed by the shift
of the Au signal to lower energies and the oxygen and Si surface peaks.
Integration Issues 99
Figure 6.12. RBS spectrum of an as-deposited Au(50 nm)/Si(100) structure (solid line) with
that (dashed line) of a structure annealed at 350°C for 60 minutes in an O
2
ambient [13]
RUMP simulation of the annealed spectrum suggests an oxide thickness of
~132 nm. Annealing of the Au(150 nm)/Si(100) structure at 350°C for 60 minutes
resulted in the formation of a silicon oxide of 115 nm (Figure 6.13). Compared to
the data presented in Figure 6.12, the RBS spectrum in Figure 6.13 indicates that
the entire Au has not intermixed with the silicon. The layer immediately below the
surface oxide is an Au rich layer. For the same annealing conditions, i.e.
temperature and time, a slightly thinner oxide is formed for the thicker (150 nm)
Au layer.
100 Silver Metallization
Figure 6.13. RBS spectrum of an as-deposited Au(150 nm)/Si(100) structure (solid line)
with that (dashed line) of a structure annealed at 350°C for 60 minutes in an O
2
ambient [13]
Cross-sectional transmission electron microscopy (XTEM) analysis was
performed to supplement the RBS analysis. The XTEM analysis indicated that the
annealing resulted in a multilayered structure, namely a silicon oxide (~132 nm),
an intermixed Au+Si layer and the underlying silicon substrate. It has to be pointed
out that due to the porous nature of the oxide the Ti of the capping layer indiffused
into it, therefore, the final thickness of the oxide extends to the surface. In
agreement with the RBS results, the XTEM analysis showed that during annealing
the entire Au layer is consumed to form the intermixed Au+Si layer. Scanning
electron microscopy analysis revealed that the silicon oxide formed at the surface
is porous and non-uniform in thickness. Figure 6.14 shows the RBS spectra of the
as-deposited Ag(150 nm)/Si(100) structure and that annealed at 350°C for 60
minutes in O
2
.
Integration Issues 101
Figure 6.14. RBS spectrum of an as-deposited Ag(150 nm)/Si(100) structure (solid line)
with that (dashed line) of a structure annealed at 350°C for 60 minutes in an O
2
ambient [13]
The broad tail of the annealed spectrum suggests that the Ag does not intermix
with silicon, and no silicon is released to form a surface oxide as in the case of the
Au/Si system, instead silver agglomerates are formed. The formation of the
agglomeration is confirmed by the fact that the RBS spectrum of the annealed
sample shows both silicon and silver at the surface. The RBS data was further
supported by the SEM analysis, which shows the silver agglomerates, a
discontinuous silver film is formed on the Si substrate after annealing the Ag/Si in
an O
2
ambient.
6.2.4 Discussion
Upon annealing the Au/Si structure in an oxidizing ambient, the presence of the Au
results in the relaxation of the metal–silicon interfacial energy and leads to the
formation of an intermixed Au+Si layer adjacent to the silicon substrate. Silicon
atoms can be ejected from the interface and migrate through the Au layer to the
surface to form a silicon oxide layer. It has to be pointed out that the solid
solubility of Si in gold is very low [12].
The observed enhanced outdiffusion of silicon through gold is often attributed
to the formation of an oxide on the Au surface when annealed in an oxidizing
102 Silver Metallization
ambient. The oxide is thought to act as a sink, which becomes the driving force for
the enhanced outdiffusion. Furthermore, the outdiffusion of Si and its accumulation
on the surface of Au is related to the surface energy of the system.
In view of the above mentioned, the surface potential model is proposed to
explain the diffusion of Si through Au and the subsequent surface oxide formation.
According to the surface potential model, the major contributing factors are the
overcoating metal (Au) and the type of ambient present [1]. The overcoating metal
determines the difference in electronegativity (or ionicity), which in turn is a
measure of the bonding between the two materials, Au and silicon. On the other
hand, the type of ambient gas, alters the surface properties of the metal upon
absorption and results in an increase or decrease in the work function of the metal.
Table 6.2 summarizes the effects of these factors.
In terms of the model, the Au–Si interaction can be described as:
Au
x
+ Si
y
→ Au
x
–Si + Si
y–1
(6.5)
Au
x
–Si → outdiffusion of Si; or alloy formation; etc: (6.6)
Table 6.2. The effect of electronegativity difference, and ambient-induced work function on
diffusion of silicon [13]
System
Electronegativity
difference (ionicity)
Work function
Effect
Au/Si 2.4 (Au)–1.8(Si) = 0.6 Reduced (negative
surface potential)
Enhanced outdiffusion
of Si
Ag/Si 1.9(Ag)–1.8(Si) = 0.1 Little effect Little outdiffusion of Si
According to Table 6.2, the overcoating metal, Au is more electronegative than
Si, which gives a partial ionic bond in the Au
x
–Si complex as Au
x
δ
–
–Siδ
+
. It has
been reported that dry oxygen induces a negative surface potential on Au. The
combination of the higher electronegativity of gold and ambient induced negative
potential on Au brings about reduction in the work function of the gold and
therefore making the Reactions 6.5 and 6.6 favourable.
Based on the surface potential model and the data given in Table 6.2, an oxide
will only form on the surface of a Au overlayer and not Ag. The ionicity of the
Ag/Si bond is less than 1/10 that of the Au/Si due to the smaller electronegativity
of silver. Therefore, the ambient will have a much smaller effect in the case when
silver is used as the overcoating metal. In support of this model, it has been shown
that a hydrogen ambient induces a positive surface potential on Au resulting in an
increase in its work function by 0.18 eV. This increase in work function is
unfavourable to Reactions 6.5 and 6.6 and hence reduced Au–Si interactions in the
presence of this ambient.
The released silicon diffuses through the Au along grain boundaries. This is
consistent with the fact that after heating the Au/Si system to temperatures above