Expert Systems for Human Materials and Automation Part 8 ppt
Bạn đang xem bản rút gọn của tài liệu. Xem và tải ngay bản đầy đủ của tài liệu tại đây (3.63 MB, 30 trang )
Interface Layers Detection in Oil Field Tanks: A Critical Review
201
Hence, for a time delay less than a threshold twater*(th
liquid
/d) (where d is the distance
between the sensor and reflector) the type of liquid being sensed by the actual sensor
corresponds to water. Otherwise, in case the time delay is greater than oil*(t
hliquid
/d), then
the liquid is either emulsion or oil depending on the number of pulses being collected (i.e.
emulsion for less than 3 pulses, oil otherwise). Finally, in case no echo is detected, then the
corresponding phase corresponds to foam or gas. Note that the thresholds, t
water
*(th
liquid
/d)
and t
oil
*(th
liquid
/d) (e.g. according to Section 2.1(a) and Figure for an operation temperature
ranging from 20
0
C to 70
0
C setting twater and toil to 140 μs and toil, = 150 μs, respectively is
reasonable for thliquid = d) were selected in such a way that the classification is independent
of the temperature. The same procedure is done for all sensors of the device to provide the
water-cut profile of the column. This algorithm, which has been coded in assembly and
implemented into the transmitter, has the advantage of being simple and does not require
complicated hardware. However it is not capable to provide the water-cut value.
b. A neural network-based algorithm for water-cut computation
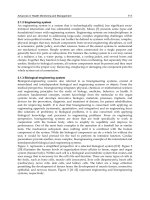
The second algorithm dedicated for water-cut computation is based on a feed forward
neural network with backpropagation training. The motivation of using neural network is
due to the fact that the elements of the database as shown in Figures 3, 5, and 6 are not linear
and depend on several variables (i.e. temperature and flow rate). The topology that gave
satisfactory results was: input layer of dimension 6, one hidden layer with 6 neurons and the
output layer with
1 neuron for the water-cut value (Figure 23). This network demonstrated
to be robust enough to determine the water-cut value within relatively low computation
time. The first layer contains the six input variables (peak to peak voltage, delay, number of
pulses within the time window [0, tmax], phase of the ultrasonic wave, temperature, and
ΔP). The training set had 94 exemplars, and also validation and test sets each with 47
exemplars, were employed. All sets were mutually exclusive, and contained exemplars
spanning the considered water-cut range. The nodes in the hidden layer are connected to all
nodes in adjacent layers. Each connection carries a weight, w
ij
. Hence, the output of a node
(j) in the hidden layer can be expressed as follows:
6
1
()
j
i
j
i
i
ui g w x
=
=×
∑
(13)
Fig. 23. Neural Network algorithm for water-cut determination
Expert Systems for Human, Materials and Automation
202
Where g
j
is the activation function which is usually selected as non linear to enable the
network to model to some extent some nonlinearities present in the problem. Following
extensive experiments, the Logsig function was found to be the most appropriate in our
case. Thus, for a particular input vector, the output vector of the network is determined by
feedforward calculation. We progress sequentially through the network layers, from inputs to
outputs, calculating the activation of each node using Eq. (7), until we calculate the
activation of the output nodes.
3.4 Electronic design
The overall system is modular and consists of a 1-D array of tens of ultrasonic transducers
which are connected to each other in a daisy chain manner via stainless-steel shielded wires
and an embedded transmitter based on Reduced Instruction Set Computer (RISC) processor
to perform control, data acquisition and real-time pattern recognition tasks. In addition it
delivers the output results (i.e. low and high position of the emulsion layer) either as current
loop 4-20 mA or RS-485 protocol to the remote control room. The temperature of the tanks
which can reach up to 700C in summer season. Furthermore, and following the results
obtained from the experimental setup, each transducer has been equipped with a
temperature sensor. In addition, two pressure sensors were added to sensors 1 and 26
respectively.
3.4.1 Ultrasonic transducer
Each transducer comprises the sensor and its corresponding electronics (housed in stainless
steel enclosures with IP-68 norm) and is provided with a periodical pulse repetition rate of
approximately 10 Hz for the received echoes to die completely out before an excitation of
200 V peak to peak of the next burst cycle. Thus, the whole column which consists of 28
sensors can be scanned within 2.8 s. This is fast enough for oil field tanks, since they are
filled with a maximal flow rate of 500 l/min (e.g. 22.8l/2.8 sec,), which corresponds to a
negligible increase of the liquid height in the tank since the tank diameter usually exceeds 5
m. The returned echoes are pre-amplified and amplified with an accumulative gain of up to
30 dB using a variable gain amplifier which also provides pass-band filtering with a
bandwidth of 3 MHz +
200 KHz. The role of the filter is to reduce low frequency noises
induced by the vibrations of the pipes which are connected to the tank. Thus, using this
filter, the signal to Noise Ratio (SNR) of the signal in Figure 12 was improved from 9.4 dB to
16.4 dB which is high enough to perform pattern recognition tasks. The next step is then to
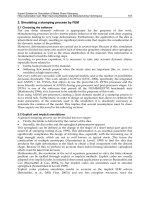
emit similar echo signals to the transmitter for further processing. Figure 24 shows the
electrical connections between the sensors and the transmitter. A set of only twelve (12)
electrical wires (2 for DC power supply, 2 for signals and 8 for control) only connect
adjacent enclosures in a daisy chain manner. Thus an analog switch is associated to each
ultrasound sensor to enable/disable the high voltage (e.g. 200 Volts) pulse voltage generated
by the transmitter based on the value carried out by the input address bus. The echo signal
from the sensor is then amplified and carried out via a single shared wire to the transmitter.
This design has the advantage to reduce the number of wires between the transducers to a
constant value (12 wires), independently from the height of the tank or the target resolution.
All the electronics parts were implemented in PCBs. In addition, the instrument is not
invasive since the ultrasonic sensors are not directly in contact with the process fluid but
protected with glass proving an EEx-m protection.
Interface Layers Detection in Oil Field Tanks: A Critical Review
203
3.4.2 Transmitter
The transducers are sequentially enabled by the transmitter in a time multiplexed manner to
sense the surrounding liquid. The corresponding analog echoes signal is then sent to the
transmitter for digitalization at a sampling rate of 100 Msamples/s and for further
processing. This latter task is handled by a RISC ARM-based processor which also transfers
the final results (i.e. tank profile) to the remote control room.
12 wires
Amplifier
Address
Transducer-1 (n=1)
Ultrasound
waves
Selector
Transducer-n (n=28)
Address
Selector
Amplifier
Fig. 24. Electronic design: Transducer-Transducer connections.
The transmitter also comprises a main processing unit that implements the pattern
recognition algorithm and provides an Input/Output interface to/from the remote
computer (RS485 or 4-20 mA standards which generates three levels corresponding to the
bottom and top levels of the emulsion layer and the top level of the oil, as well as the tank
profile), an amplifier module to amplify the signal to an acceptable level, and a
pulser/selector circuit to activate each of the sensors in a time multiplexed manner with a
short burst signal. The analog signal sent by the ultrasonic sensor is converted into digital by
a high speed comparator for further processing.
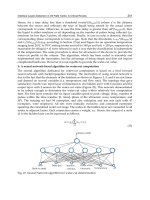
4. Experimental results and discussions
The ultrasonic system has been immersed into the column and extensively assessed under
different scenarios as follows: The oil tank and water tank continuously feed the column
with various water-cut values by remotely adjusting the control valves placed after the oil
pump and water pump respectively using a host computer. The fluid inside the tank is then
simultaneously carried out into a storage tank, allowing a continuous supply of the mixed
fluid into the column until both oil and water tanks become empty. Figure 25 shows the
Expert Systems for Human, Materials and Automation
204
principle of the experiment. The assessment of the device is done by comparing the amount
of water-cut measured at a specific height in the column (e.g. height corresponding to sensor
#16) with the output of the water-cut meter which measures the amount of water in oil of
the two phase outflow carried out from the column at the same height than sensor # 16.
Figure 26 shows the results obtained from the two devices, where the “reference” signal is
provided by the water-cut meter and “instrument” signal is provided by our acoustic
system. It can be clearly observed the capability of our device to track fast water-cut
variations, even within the critical range of 40- 60% which would not be possible with the
capacitance or conductance probes. Note that in some situations, the water-cut meter
indicates brief 0% water-cut, which is different from the output of the acoustic system. This
might be due to the flow regime of the fluid crossing the water-cut meter where because the
fluid is discharged from the column into the storage tank by gravity, no liquid is present at
those time slots (which corresponds to 0% water-cut). Figure 27 shows another experiment
covering higher water-cuts. Hence, it can be clearly observed the capability of the device to
determine the profile of oil tanks for various values of water-cut. Overall, the averaged
relative error for oil and water was always less than +/- 3%. It is defined respectively as:
() ()
( )[%] 100[%]
()
ar
r
QW QW
Error W
QW
−
=× and
() ()
()[%] 100[%]
()
ar
r
QO QO
Error O
QO
−
=×
Where Q
r
(W) and Q
r
(O) are the total quantities of water and oil respectively injected into the
column and Q
a
(W) and Q
a
(O) the total amounts of water and oil respectively as computed
by the instrument.
Stora
g
e tank
From Water tank
From Oil tank
FM
Water-cut meter
Host PC
Transmiter
Electrical wires
Outlet valve
Inlet
l
Reflector
Sensors Array
Sensor # 16
Fig. 25. Experimental setup to validate the accuracy of the device to measure the water-cut .
Interface Layers Detection in Oil Field Tanks: A Critical Review
205
Fig. 26. Plot comparing the measured water-cut versus the reference.
Fig. 27. Plot comparing the measured water-cut versus the reference for high water-cut.
Regarding the emulsion layer detection, Figures 18(a) and (b) shows the dynamic behavior
of the emulsion for one of the sensors of the device (sensor #16) in case of water dominated
(e.g. water fraction more than 90%) or oil dominated mixture (e.g. oil fraction more than
90%) respectively. It could be seen that in case of water dominant emulsion, the delay keeps
decreasing since the bubbles of oil tend to disappear. However, in oil dominant emulsion,
the delay keeps increasing since the bubbles of water tend to disappear.
Figure 29 shows the results of tracking the emulsion layer in the column. Initially, the
column was filled with water (of height 285 cm) and oil (of height 75 cm). By filling the
column with water (of height 30 cm), an emulsion layer has been created on the top of the
column. As the water tends to move downward, the thickness of the emulsion layer tends to
increases and reaches its maximum value at time t = 20 s. Next, pure oil starts to appear at
the top of the tank and its thickness tends to increase until it reaches its maximal value at
time = 78 s. Hence, the water thickness increases by 30 cm from its initial value. Figure 30
shows the graphical user interface in the computer of the control room showing a snapshot
of the above experiment in which an emulsion layer was formed between the water and
Expert Systems for Human, Materials and Automation
206
kerosene. The emulsion layer is represented by two windows: In window 1 the plot of the
emulsion layer is represented, whereas in Window 3, the profile of the whole tank is
represented by assigning each sensor with a specific color (e.g. Blue for water, pink for
emulsion, yellow for gas, and brown for crude oil).
Fig. 28. Dynamic tracking of sensor 16 in water-dominant (a) and oil dominant (b) emulsion.
Interface Layers Detection in Oil Field Tanks: A Critical Review
207
Fig. 29. Dynamic tracking of the emulsion layer.
Fig. 30. Graphical user interface in the remote computer.
5. Conclusion
In this book chapter, a critical review on the most recent devices for emulsion layer
detection was presented. At present, the radioactive-based device seems to be the most
successfully commercially available devices from the accuracy point of view. However,
because of the continuous danger it presents to the operator, oil companies are reluctant to
use this technology in their field. This book chapter also presents an alternative safe solution
which uses ultrasonic sensors. This device was designed, implemented and tested for real-
time and accurate detection of the emulsion layer in a 4.35 m height tank. In addition, it was
Expert Systems for Human, Materials and Automation
208
demonstrated that the instrument can provide the profile of the two phase liquid within a
relative error of +/- 3%. The device is easy to maintain and install (no need to modify the oil
tank) and is modular (i.e. Field Removable and Replaceable) and can deal with sludge
buildup which may be caused by crude oil at the surface of the sensor and/or reflector.
6. References
[1] S.C. Bera, J.K. Ray, and S. Chattopadhyay, “A low-cost noncontact capacitance-type level
transducer for a conducting liquid”, IEEE Transactions on Instrumentation and
Measurement, Volume 55, Issue 3, pp. 778 – 786, June 2006.
[2] W. Yin, A. Peyton, G. Zysko, and R. Denno “Simultaneous Non-contact Measurement of
Water Level and Conductivity”, in Proceedings of IEEE conference on
Instrumentation and Measurement Technology (IMTC’2006), pp. 2144–2147, April
2006.
[3] Holler, G.; Thurner, T.; Zangl, H. and Brasseur, G; “A novel capacitance sensor principle
applicable for spatially resolving downhole measurements”, Proceedings
IMTC/2002, Volume 2, pp. 1157 – 1160, Volume 2, May 2002.
[4] Weiss, M and Knochel, R, “A sub-millimeter accurate microwave multilevel gauging
system for liquids in tanks”, Microwave Theory and Techniques, IEEE
Transactions on Volume 49, Issue 2, pp. 381 - 384 Digital Object Identifier
10.1109/22.903101, February 2001.
[5] R.Meador and H. Paap, “Emulsion Composition Monitor”, U.S. Patent No. 4,458,524,
date of Patent: 10 July 1984.
[6] Foden, P.R. Spencer, and R. Vassie, J.M.; “An instrument for-accurate sea level and wave
measurement”, Proceedings in OCEANS '98 Conference, pp. 405 – 408, Volume 1,
28 September-October 1
st
, 1998.
[7] Antonio Pietrosanto, and Antonio Scaglione “Microcontroller-Based Performance
Enhancement of an Optical Fiber Level Transducer”, from Giovanni Betta, Associate
Member, IEEE, IEEE Transactions on Instrumentation and Measurement, Volume
47, No. 2, April 1998.
[8] Lee Robins, “On-line Diagnostics Techniques in the Oil, Gas, and Chemical Industry”, in
Proceedings Third Middle East Non-destructive Testing Conference, 27-30
November, Bahrain, Manama, 2005.
[9] Al-Naamany, A. M.; Meribout, M.; and Al Busaidi, K., “Design and Implementation of a
New Nonradioactive-Based Machine for Detecting Oil–Water Interfaces in Oil
Tanks”, IEEE Transactions on Instrumentation and Measurement, Volume 56, Issue
5, pp. 1532 –1536, Oct. 2007.
[10] Mackenzie and Kenneth V.;“Discussion of sea-water sound-speed determinations".
Journal of the Acoustical Society of America Volume 70, Issue 3, pp. 801-806, 1981.
[11] Urick R. J., “Sound propagation in the sea”; The Journal of the Acoustical Society of
America, Volume 86, Issue 4, October 1989, pp. 1626.
[12] L. Kinsler, A. Frey, and A. Coppens, “Principal of Acoustics” John Wiley & sons, ISBN-
13:9780471847892, 2000.
[13] L C Lynnworth, "Ultrasonic impedance matching from solids to gases", IEEE
Transactions on Sonics and Ultrasonics, SU-12. (2). pp. 37-48, 1965.
[14] Lynnworth, L. C. and Magri, V., “Industrial Process Control Sensors and Systems”,
Ultrasonic Instruments and Devices: Reference for Modern Instrumentation,
Techniques, and Technology, Volume 23 in the series Physical Acoustics, Academic
Press, pp. 275-470, 1999.
11
Integrated Scheduled Waste Management
System in Kuala Lumpur Using Expert System
Nassereldeen A. K, Mohammed Saedi and Nur Adibah Md Azman
Bioenvironmental Engineering Research Unit (BERU),
Department of Biotechnology Engineering, Faculty of Engineering,
International Islamic University Malaysia,
Malaysia
1. Introduction
Over the past decade, Malaysia has enjoyed tremendous growth in its economy and
population, this resulted in an increase in the amount of waste scheduled generated.
Furthermore, scheduled waste management has long been a problem area for local
authorities in Kuala Lumpur. Continued illegal dumping by waste generators is being
practiced at large scale due to lack of proper guidance and awareness. This paper reviewed
discussed and suggested about service provided for scheduled waste management by an
authority and international scenario of scheduled waste management. An expert system was
developed to integrate scheduled waste management in Kuala Lumpur. The knowledge
base was acquired through journals, books, magazines, annual report, experts, authorities
and web sites. An object oriented expert system shell, Microsoft Visual Basic 2005 Express
Edition was used as the building tools for the prototype development. The overall
development of this project has been carried out in several phases which are problem
identification, problem statement and literature review, identification of domain experts,
prototype development, knowledge acquisition, knowledge representation and prototype
development. Scheduled waste expert system is developed based on five types of scheduled
waste management which are label requirements, packaging requirements, impact of
scheduled wastes, recycling of scheduled wastes, and recommendations. Besides, it contains
several sub modules by which the user can obtain a comprehensive background of the
domain. The output is to support effective integrated scheduled waste management for KL
and world-wide as well.
2. Scheduled wastes
Even though use of information technology plays a major role in application of technology
nowadays, application of artificial intelligence (AI) is still in its infancy in Kuala Lumpur.
During the last decade AI has grown to be a major of research in computer science. Varieties
of AI-based application programs have been developed to address real life problems and
have been successfully field-tested (L.C. Jayawardhanaa et al, 2003). As Kuala Lumpur still
lacks proper systems of information assimilation, archival and delivery, AI tool can
effectively be employed to solve for the management of scheduled waste.
Expert Systems for Human, Materials and Automation
210
Scheduled wastes are defined as wastes or combination of wastes that pose a significant
present or potential hazard to human health or living organisms. This definition specifically
excludes municipal solid waste and municipal sewage. Scheduled wastes are broadly
classified into the categories of chemical wastes, biological wastes, explosives and
radioactive wastes (Chapter 5 Waste Disposal). Scheduled waste management has long been
a problem area for local authorities in Kuala Lumpur. Continued illegal dumping by waste
generators is being practiced at large scale due to lack of proper guidance and awareness. In
2007, the Department of Environment Malaysia (DOE) was notified that 1 698.118 metric
tones were generated. In addition, Kuala Lumpur has enjoyed tremendous growth in its
economy. This has brought about a population growth along with a great influx of foreign
workforce to cities. It resulted in an increase in the amount of waste generated. The main
reason attributable to this deficiency is the lack of expertise in the scheduled waste
management domain. The aim of this research is to address scheduled waste management
in Kuala Lumpur by providing an expert system called Scheduled Waste Expert System
(SWES). Currently, there are various facilities have been approved for management of
scheduled wastes in Malaysia. These include 211 licensed waste transporters, 76 recovery
facilities (non e-waste), 85 partial recovery e-waste facilities, 35 on-site incinerators, 3 clinical
waste incinerators and 2 secured landfills (Department of Environment, Malaysia, 2008). For
Kuala Lumpur, in 2007, there are 11 licensed waste transporters and 6 local off-sites
recovery facilities (Laporan Tahunan Jabatan Alam Sekitar Wilayah Persekutuan, Kuala
Lumpur 2002-2007). However, there are many of other potential sites which could be used
as illegal dumped area. To guide the proper implementation of scheduled waste
management, the need of expertise, in the form of human expert or a written program such
as an expert system is crucial factor. In order to convey the expert knowledge to the
operational level personnel, the most convenient and cost effective means is an expert
system (Asanga Manamperi et. al, 2000).
3. International scenario of integration of scheduled waste management
Scheduled waste management has different meaning and classification according to the
country. For example, most of the waste is classified under hazardous waste (HW) because
of their physical characteristics that suitable with HW. HW can be classified on the basis of
their hazardous nature which includes toxicity, flammability, explosively, corrosively and
biological infectivity (Moustafa, 2001). According to Chinese law, solid waste is classified
into three types: industrial solid waste (ISW), municipal solid waste (MSW) and hazardous
waste (HW). According to the environmental statistics for the whole country in 2002, the
quantity of ISW generated in China was 945 million tons, of which 50.4% was reused as
source material or energy, 16.7% was disposed of simply, 30.2% was stored temporarily, and
2.7% was discharged directly into the environment. In recent years, the quantity of ISW
generated in China has been increasing continually. Compared with 1989, the quantity of
ISW generated in 2002 had increased by 66%. The categories of ISW are closely related to the
industrial structure in China. (Qifei et. al, 2006).
The total volume of hazardous waste generated in Thailand in 2001 was 1.65 million tons, of
which 1.29 million tons (78%) were generated by the nonindustrial (community) sector. As
well as the industrial and nonindustrial sectors, a main source of hazardous waste
generation is the transport of hazardous wastes from foreign countries into Thailand. More
than 70% of the hazardous waste generated in Thailand is in the form of heavy metal sludge
Integrated Scheduled Waste Management System in Kuala Lumpur Using Expert System
211
and solids. Other important groups of hazardous waste are oils, acid wastes, infectious
wastes, solvents, and alkaline wastes. It has also been reported that petroleum refineries and
the electroplating, textile, paper, and pharmaceutical industries are the primary producers
of hazardous wastes in Thailand. Besides, for the nonindustrial hazardous waste is
generated from everyday activities in nonindustrial or community sources, such as
automotive repair shops, gas stations, hospitals, farm and households. Hazardous waste
from community sources consist primarily of used oils, lead acid and dry-cell batteries,
cleaning chemicals, pesticides, medical wastes, solvents, and fuels (Hiroaki et.al, 2003).
Amounts of wastes generated from industries in Dar es Salaam are estimated at 76 326 tonne
per year (about 203.6 tonne per day or 58 kg per capita per year). The hazardous waste
generation from industries in Dar es Salaam as estimated was a total of 46 340 tonne per
year (about 127 tonne per day or 29 kg per capita per year). Assuming a negligible annual
increase, the hazardous wastes production is about 40% of the total waste production in Dar
es Salaam industries. The hazardous waste production levels in Dar es Salaam (Tanzania)
can be estimated at 95 000 tonne per year or 3.8 kg per capita per year. The per capita waste
generation rate is about 60% of that of Japan, 17% of Denmark and 3.8% of the Netherlands
(Mato et. al, 1999).
In India, the HWs (Management and Handling) Rules, 1989, as amended in 2003 defined 36
industrial processes, which generate HW (HWM Rules, 2003). In order to encourage the
effective implementation of the HW (M&H) Rules 1989 as amended in 2003. The key issues
in India for HW management are the environmental health implications of uncontrolled
waste generation, improper waste separation and storage prior to collection, multiple waste
handling, the poor standards of disposal practices, and the non-availability of
treatment/disposal facilities. The most influential issue is the scarcity of resources (skilled
human as well as budgetary) in the country. The majority of the problems and challenges
facing by India in managing HW are detailed.
4. Computer technique in waste management
There are many computer techniques in managing the waste worldwide. As an example, for
Sri Lankan solid waste composting, BESTCOMP is used. BESTCOMP is one of the Expert
System. BESTCOMP is short form from ‘Born to guide for Solid waste COMPosting’. This
system is based on several phases including problem identification, knowledge acquisition,
knowledge representation, programming, testing and validation. It is composed of several
basic components such as the user interface, knowledge base, inference mechanism and the
database (L.C. Jayawardhanaa et. al, 2003).
Another Sri Lankan alternative is BESTFill for landfilling applications. An expert system
was developed to assist proper implementation of landfill technology in Sri Lanka. This
system contains several sub modules by which the user can obtain comprehensive
background of the domain. The output is expected to support effective integrated solid
waste management (Asanga et. Al, 2000).
Besides, for environmental site evaluation of waste management facilities, EUGENE model
is used. This model is a sophisticated mixed integral linear programming model developed
to help regional decision makers on long-term planning for solid waste management
activities. The method used to embed waste management environmental parameters in the
EUGENE model consists in building global impact index (GII) for all site or facility
combinations (Vaillancourt et. al, 2002).
Expert Systems for Human, Materials and Automation
212
In addition, fuzzy goal programming approach is used for the optimal planning of
metropolitan solid waste management systems. This system demonstrates how fuzzy, or
imprecise, objectives of the decision maker can be quantified through the use of specific
membership functions in various types of solid waste management alternatives (Ni-Bin et.
al, 1997).
Another system that had been used was Analytic Network Process (ANP) and Decision
Making Trial and Evolution Laboratory (DEMATEL) to evaluate the decision-making of
municipal solid waste management in Metro Manila. ANP has a systematic approach to set
priorities and trade-offs among goals and criteria, and also can measure all tangible and
intangible criteria in the model while DEMATEL convert the relations between cause and
effect of criteria into a visual structural model (Ming-Lang, 2008).
5. Methodology
Expert system (ES) has been chosen to organize part of the knowledge domain in scheduled
waste management from all data collected to non-expert users (Nassereldeen, 1998). This
knowledge should support them in term of label and packaging requirements, impact and
recycling of scheduled wastes, recommendations, besides predicting the scheduled waste
generated and population in Kuala Lumpur.
5.1 Visual Basic Expert System (VBES) development
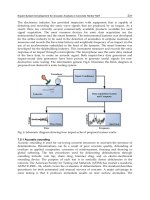
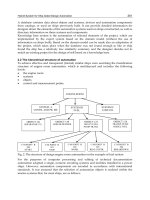
Figure 1 below shows the flow diagram of this project, problem identification, problem
statement, literature review and identifications of domain experts are done. For other phases
Problem Statement &
Literature Review
Identify the
domain experts
Prototype
development
Knowledge
acquisition
Knowledge
representation
Prototype
validation
Prototype
development
complete?
End
Problem Identification
Yes
No
Fig. 1. Flow Diagram for Scheduled Waste Expert System
Integrated Scheduled Waste Management System in Kuala Lumpur Using Expert System
213
are elaborated below. Several entities in the integration of scheduled waste management
system in KL. Five different entities of this process, each of which has many sub entity:
• Label Requirements
• Packaging Requirements
• Impact of scheduled waste
• Recycling of scheduled waste
• Recommendation
Types of label
requirements
are suitable
for each type
of scheduled
waste
Television
iPod
Other
Digital
Wastes
Ink
Catridge
Handphone
/ iPhone
Battery
Human
Health
Socio-
economy
Disaster/
Tragedy
Environment
Impact of
Scheduled
Waste
Packaging
Requirements
Label
Requirements
Recycling of
Scheduled
Waste
Recommendations
Expert System
Development
Law
Cleanliness
Lifestyle
Strict
Enforcement
Wise
consumer
Types of
packaging
requirements
are suitable
for each type
of scheduled
waste
Fig. 2. Five Different Entities of Expert System Development
5.2 Building tool
For the development of Scheduled Waste Expert System (SWES), an expert system shell,
Microsoft Visual Basic 2005 Express Edition, was preferred over conventional programming
languages. This software was used because of its user friendly. In fact, many books that
guide the author how to use this software are available in the library.
5.3 System requirements
• Operating System
The user must have Windows 2003, XP, or 2000; Windows NT, 95, 98, or ME will not
work.
• Available hard drive space
The requirement varies with the edition and type of installation and whether other
components such as Internet Explorer (IE) already are installed on the computer. The
user should plan on the total installation taking between 2GB and 5GB (gigabytes). A
large (at least 80GB) hard drive is relatively inexpensive and easy to install, so if
remaining space on the existing hard drive is scarce, the user may wish to consider
upgrading before installing Visual Basic 2005.
• Processor
Expert Systems for Human, Materials and Automation
214
According to Microsoft, a processor speed of 600 MHz (megahertz) is the minimum and
1 GHz (gigahertz) is recommended. Because upgrading a processor by replacing the
motherboard is not so inexpensive or easy, another alternative is boosting your system
RAM, discussed next if the user is on the borderline.
• RAM
According to Microsoft, 128MB (megabytes) is the minimum, and 256MB is
recommended.
5.4 Knowledge acquisition
Knowledge acquisition is the lengthiest process in building of an expert system. However, it is
the single most important process of the knowledge engineer upon which quality of the expert
system depends on. The central core of the knowledge base was acquired from the published
text books, journals, magazines, experts, meeting authorities and pamphlet. This knowledge
consists of well established facts, rules, theory and guidelines that had been practiced over
many years. Annual Report of Department of Environment (DOE) related to statistics of
scheduled waste generated have provided very valuable sources of information. This source of
information provided a means to build a unique knowledge base for Scheduled Waste Expert
System (SWES). All the sources are come from Department of Environment, Kuala Lumpur
(DOE), Kuala Lumpur City Hall (DBKL), and Alam Flora Sdn. Bhd (AFSB).
Knowledge acquisition has now become relatively easy than two decades ago, due to the
advancement of Internet facilities. Much valued information about management of
scheduled waste of Kualiti Alam and Radicare, organization, companies, recycling
procedure and so on, were acquired through the Internet. These were helpful in building the
sub modules of the Scheduled Waste Expert System (SWES).
6. Results and discussion
6.1 User interface
Proper organization of the user interface is important since it is the part of the expert system
that interacts with the user. The presence of a standard user interface framework not only
simplifies development efforts, but also reduces user training and support requirements for
users. In the SWES, the knowledge base was divided into five categories which are label
requirements, packaging requirements, impact of scheduled wastes, recycling of scheduled
wastes, and recommendations as shown in the Figure 3.
Fig. 3. Main User Interface of SWES
Integrated Scheduled Waste Management System in Kuala Lumpur Using Expert System
215
6.2 Rules for the ES
Through studying the annual report, magazine, journal, book and web sites, knowledge was
translated into five sets of rules:
i. Label requirements
ii. Packaging requirements
iii. Impact of scheduled wastes
iv. Recycling of scheduled wastes
v. Recommendations
The major operations that can be done on the ES as in figure 4 are:
i. Clear, this command removes selected text in the text box
ii. Recommendation, Solution, Result & Comment, these commands give the best solution
and comment about the selected case.
iii. Help, this command help the user how to use this system.
iv. Quit, this command prompts exit SWES.
Fig. 4. The output after user click on any radio buttons
6.3 Rules for impact of Scheduled Wastes
The information is converted into ES rules in a simple language as in figure 5.
The rule will be in a form of radio button and the meaning of the rule is:
If the selection is RadioButton1, then Example SW 110 E-Waste <> (1) Toxic ingredients in E-
Waste such as lead, beryllium, mercury, cadmium and bromibated flame retardants can pose
both occupational and envitonmental health threats. (2) E-Waste that are lanfilled produce
highly contaminated leachate which eventually pollutes the environment especially surface
water and grounwater. (3) Acid and sludge obtained from melting computer chips if disposed
into the ground will cause acidification of soil and subsequently contamination of
groundwater. (4) Brominated flame retardant plastic or cadmium containing plastics are
landilled, both polybrominated diphenyl ethers (PBDE) and cadmium may leach into the soil
and groundwater. (5) Combustion of E-Waste will emit toxic fumes and gases that pollute the
surrounding air. When E-Wastes are exposed to fire, metals and other chemical substances,
extremely toxic dioxins and furans will be emitted. The toxic fall-out from open burning affects
both the local environment and broader global air quality, depositing highly toxic byproducts
in many places throughout the world. (6) If E-Wastes are discarded together with other
household wastes, the toxic compnents will pose a threat to both health and the vital
components of the ecosystem; if the selection is RadioButton2, then Example SW 311 Oil <> (1)
Expert Systems for Human, Materials and Automation
216
IF selection is RadioButton1
THEN Example SW 110 E-Waste <> (1) Toxic ingredients in E-Waste such as lead, beryllium, mercury, cadmium and
bromibated flame retardants can pose both occupational and envitonmental health threats. (2) E-Waste that are lanfilled
produce highly contaminated leachate which eventually pollutes the environment especially surface water and grounwater. (3)
Acid and sludge obtained from melting computer chips if disposed into the ground will cause acidification of soil and
subsequently contamination of groundwater. (4) Brominated flame retardant plastic or cadmium containing plastics are
landilled, both polybrominated diphenyl ethers (PBDE) and cadmium may leach into the soil and groundwater. (5) Combustion
of E-Waste will emit toxic fumes and gases that pollute the surrounding air. When E-Wastes are exposed to fire, metals and
other chemical substances, extremely toxic dioxins and furans will be emitted. The toxic fall-out from open burning affects both
the local environment and broader global air quality, depositing highly toxic byproducts in many places throughout the world.
(6) If E-Wastes are discarded together with other household wastes, the toxic compnents will pose a threat to both health and
the vital components of the ecosystem.
IF selection is RadioButton2
THEN Example SW 311 Oil <> (1) Oil that is illegall dumped can contaminate groundwater and nearby rivers, affect public
health and financial implications. (2) The health impacts of direct and indirect exposure to oil include carcinogenic effects,
reproductive system damage, respiratory effects, central nervous system effects and many more.
The rule in VB language;
If Me.RadioButton1.Checked Then
Me.TextBox1.Text = ("Example SW 110 E-Waste <> (1) Toxic ingredients in E-Waste such as lead, beryllium, mercury, cadmium
and bromibated flame retardants can pose both occupational and envitonmental health threats. (2) E-Waste that are lanfilled
produce highly contaminated leachate which eventually pollutes the environment especially surface water and grounwater. (3)
Acid and sludge obtained from melting computer chips if disposed into the ground will cause acidification of soil and
subsequently contamination of groundwater. (4) Brominated flame retardant plastic or cadmium containing plastics are
landilled, both polybrominated diphenyl ethers (PBDE) and cadmium may leach into the soil and groundwater. (5) Combustion
of E-Waste will emit toxic fumes and gases that pollute the surrounding air. When E-Wastes are exposed to fire, metals and
other chemical substances, extremely toxic dioxins and furans will be emitted. The toxic fall-out from open burning affects both
the local environment and broader global air quality, depositing highly toxic byproducts in many places throughout the world.
(6) If E-Wastes are discarded together with other household wastes, the toxic compnents will pose a threat to both health and
the vital components of the ecosystem.")
Fig. 5. Rules for Impact of Scheduled Waste
Fig. 6. Choices of Impact of Scheduled Waste
Oil that is illegall dumped can contaminate groundwater and nearby rivers, affect public
health and financial implications. (2) The health impacts of direct and indirect exposure to
oil include carcinogenic effects, reproductive system damage, respiratory effects, central
nervous system effects and many more. The selection is continuously until RadioButton5.
Integrated Scheduled Waste Management System in Kuala Lumpur Using Expert System
217
Figure 6 shows the translation of the rule into impact of scheduled waste using VB while
figure 7 shows the output after the user click on any radio buttons.
6.4 Scheduled Waste Expert System (SWES)
Fig. 7. Interface for Scheduled Waste Expert System
Once the user clicks on the SWES button at the main user interface, they will be five
categories listed as in figure 7. Then, user can choose any categories and the system will give
user the best solutions. The system will produce the answer through texts, graphs and
pictures within a single form. Scheduled Waste Management module has been designed for
the use of the novices to the field. It has been divided into premises and companies handling
scheduled waste in Kuala Lumpur, labeling and packaging requirement, transportation, and
process flow. For process flow, it divided into two which are Kualiti Alam’s process flow
and Radicare’s process flow as in figure 8.
Fig. 8. Interface for Scheduled Waste Management Sub Module
6.5 System validation
In validating the scheduled waste expert system, it should be remembered that the purposes
of the study are to develop on integrated scheduled waste management system in KL by
Expert Systems for Human, Materials and Automation
218
using Visual Basic Expert System and to recommend a new approach for integration of
scheduled waste management system in KL. Many expert system prototypes were tested
and validated using case studies, the results of which were analyzed internally by the
system developers themselves. Similarly in the case of the SWES, it was validated in two
steps. As the first step, the system validation involved program debugging, error analysis as
in the Figure 9 below, and output generation. After the code is corrected, no error occurs
anymore as in the Figure 10. So, the program can be debugged.
Fig. 9. Area in the circle shows error occurred during coding
Fig. 10. Area in the circle shows no error occur after the code is corrected
Secondly, empirical data from DOE’s data, journal and authority agents validated its
performance. The objective was to evaluate the SWES’s diagnostics capability by comparing
Integrated Scheduled Waste Management System in Kuala Lumpur Using Expert System
219
its output with the data which were collected and documented during the knowledge
acquisition phase. As an example, the output for estimation of scheduled waste generated
and population in KL are validated with the statistics provided by the DOE and journal.
According to DOE, scheduled waste generated is estimated increasing every year while
according to the journal, population in KL will increase 4% every year. For label and
packaging requirements and impact and recycling of scheduled waste are validated through
the various sources such as magazines, DOE’s annual report and web sites. For example,
Figure 11 shows scheduled waste generated in 2002 is 1 560.420 tonne metric while Figure
11 shows scheduled waste generated in 2007 is 1 698.118 tonne metric. According to the
DOE’s statistics, the outputs show scheduled waste generated in 2002 and 2007 are same. So,
the outputs are corrected and validated.
Fig. 11. Area in the circle shows scheduled waste generated in 2002 is 1 560.420 tonne metric
7. Conclusion
The purpose of the study includes understanding scheduled waste generated in Kuala
Lumpur and service provided for scheduled waste management by the authority which is
Department of Environment (DOE). In addition, scheduled waste management system in
Kuala Lumpur will be developed by using Visual Basic Expert System (SWES). Finally, a
new approach for integration of scheduled waste management system in Kuala Lumpur is
recommended.
From the result obtained, the project can be considered as successful as the integrated
program for scheduled waste management system had been developed. Scheduled waste
expert system is developed based on five types of scheduled waste management which are
label requirements, packaging requirements, impact of scheduled wastes, recycling of
scheduled wastes, and recommendations. The knowledge base of this system is based on
ruled-base expert system which is IF THEN rule and the acquisition knowledge that is
gathered for this study is organized into this rules. The development of scheduled waste
expert system consists of six main forms or interfaces which are photo gallery, scheduled
waste management, literature, legislations, training tool, and scheduled waste expert system
itself. It has been incorporated with several user interfaces in order to make the system user
friendly as much as possible. SWES can also be used as a stand-alone learning tool in
environmental studies and by others. Thus a system of much versatility has been developed.
Expert Systems for Human, Materials and Automation
220
This is use of tools of information technology to help in solve local problems in managing
scheduled waste in an informative manner.
8. References
A. Moustafa; & Chaaban. (2001). Hazardous waste source reduction in materials and
processing technologies. Journal of Materials Processing Technology. Vol 119 (2001),
pp. 336-343, ISSN 0924-0136.
Chapter 5 Waste Disposal. Retrieved July 23, 2008, from
L.C; A. Manipuraa; A. Alwisb; M. Ranasinghea; S. Pilapitiyac & Indrika A. (2003).
BESTCOMP: expert system for sri lankan solid waste composting. Expert System
with Application. Vol.24, (2003), pp. 281-286, ISSN 0957-4174.
Department of Environment, Malaysia DOE. (2008). Impak. Malaysia: Ministry of Natural
Resources and Environment.
K. Vaillancourt. & J. Wauub. (2002). Environmental site evaluation of waste management
facilities embedded into EUGENE model: A multicriteria approach. European
Journal of Operational Research. Vol139, pp. 436-448, ISSN: 0377-2217.
M. Asanga; L.C. Jayawardhanaa; Ajith De Alwis & Sumith Pilapitiya. (2000). Development
of An Expert System for Landfilling Applications in Sri Lanka. pp. 643-653.
Ming-Lang Tseng. (2008). Application of ANP and DEMATEL to evaluate the decision-
making of municipal solid waste management in Metro Manila. Environ Monit
Asses. ISSN (printed): 0167-6369. ISSN (electronic): 1573-2959.
Nassereldeen Ahmed Kabbashi. (1998). An Expert System for Predicting Air Pollution due to
Development. (Master dissertation: Universiti Putra Malaysia).
Ni-Bin Chang & S. F. Wang. (1997). A fuzzy goal programming approach for the optimal
planning of metropolitan solid waste management systems. European Journal of
Operational Research. Vol99, pp. 303-321. ISSN: 0377-2217.
R.R.A.M. Mato & M.E. Kaseva. (1999). Critical review of industrial and medical waste
practices in Dar es Salaam City. Resources, Conservation and Recycling. Vol25, pp.
271-287, ISSN 0921-3449.
Qifei Huang; Qi Wang; Lu Dong; Beidou Xi & Binyan Zhou. (2006). The current situation of
solid waste management in china. J Mater Cycles Waste Manag. Vol.8, pp. 63-69. DOI
10.1007/s10163-005-0137-2.
12
Expert System Development for Acoustic
Analysis in Concrete Harbor NDT
Mohammad Reza Hedayati
1
, Ali Asghar Amidian
2
and S. Ataolah Sadr
3
1,2
University of Applied Science and Technology Faculty of Telecommunication,
1
Information Technology Mechatronic Offshore (ITOM) &
3
Port and Maritime Organization (PMO)
,
I. R. of Iran
1. Introduction
Port and Maritime Organization of Iran (PMO), in connection with a research project at
Information Technology Mechatronic Offshore research and development cooperative
society (ITMO), has added another dimension to its subsea inspection activities by
introducing new methods of NDT and expert system for condition monitoring and
assessment of concrete structures. ITOM provided a wide range of special and advanced
techniques for most aspects of subsea and underwater. The repair of concrete structures
under water presents many complex problems.
The harsh environmental conditions and specific problems associated with working
underwater or in the splash zone area causes many differences. Proper evaluation of the
present condition of the structure is the first essential step for designing long-term repairs.
To be most effective, evaluation of the existing structure requires historical information on
the structure and its environment, including any changes made to the structure over time,
and the records of periodic on-site inspections or repairs.
Reduction of the human experts involvement in the diagnosis process has gradually taken
place due to the recent developments in the modern Artificial Intelligence (AI) tools. AI is a
research field between psychology, cognitive science and computer science with the overal
goal to improve reasoning capabilities of computers. Artificial Neural Networks (ANNs),
fuzzy and adaptive fuzzy systems, and expert systems are good candidates for the
automation of the diagnostic procedures and e-maintenance application (Filippetti, et al.,
1992 & Hedayati 2009). It is often necessary to test concrete structures after the concrete has
hardened to determine whether the structure is suitable for its designed use. Ideally such
testing should be done without damaging the concrete. The tests available for testing
concrete range from the completely non-destructive, where there is no damage to the
concrete, through those where the concrete surface is slightly damaged, to partially
destructive tests, such as core tests and pullout and pull off tests, where the surface has to be
repaired after the test.
The present work surveys the principles and a criterion of the diagnosis signal processing and
introduces these achievements to an expert system technique. In this paper adoption of a new
sensor is discussed and experimental results are presented for an expert system application,
based on the concept of spectrum and cepstrum analysis of detected signals and the method of
measuring defected parts of subsea concrete without disturbing their structures for a
Expert Systems for Human, Materials and Automation
222
suspected part of the quay wall. A transducer using the principle of vibration sensors has been
tried and considered to be suitable for measuring any probable damage due to irregular
phenomena such as voids, mix separations and cracks on the suspected superficial portion of
the subsea concrete structures. Such transducers are proposed to be the basis for condition
monitoring of armored steel structure in the subsea concrete by analyzing the change of
vibration sensed by related transducers of the testing probe.
It is a common observation that, when there were voids, mix separation or crack the
reflected waves detected by the receiving sensor were different than those from the perfect
areas. The results showed that the analysis of surface wave testing has the ability to detect
changes in the constructed structures. The vibration signals which appear on the perfect part
of structure, give a characteristic vibration signature. This signature provides a base line
against which future measurements can be compared.
It is important to note that similar concrete structure in good condition will have similar
vibration signature differing only in respect of their constructional and structural conditions
tolerances.
2. Development of expert system
Knowledge built in to an expert system may originate from different sources. The prime
source of knowledge for developing an expert system should be the domain expert. To
design and develop knowledge based expert system, the specific knowledge domain or the
subject domain must be acquired. The knowledge domain is to be organized so that the
information can be structured in the computer program for effective use. In this respect, a
knowledge engineer usually obtains knowledge through direct interaction with the expert.
Fig.1 illustrates the process of data procurement for generating the knowledge base.
The domain of reinforced concrete diagnosis serves as a good example in the application
area for:
1. Examining the different means currently used to store and transfer information,
2. The knowledge acquisition and knowledge engineering processes required for
extracting that information and capturing it in a knowledge based expert system, and
3. Showing how the resulting knowledge based expert system provides an integrated
framework for combining specifications, data, and models (Graham-Jones &Mellor
1995).
Fig. 1. Experts appropriate evaluations, assessment, data logging and generating the
information for knowledge base in the Shid-Rajaee harbor
Expert System Development for Acoustic Analysis in Concrete Harbor NDT
223
The scope of this research work is to integrate inspections and observations, specifications,
standards of practice, and data related to quay-wall concrete structure diagnosis (QCD) and
to make full use of the available information in the diagnosis process. Expert System (ES)
focuses on integrating inspection of commonly encountered problems, specifications,
standards of practice and data, both theoretical and empirical, into one cohesive tool.
QCDES is a rule-based expert system which has been developed using the expert system
shell. The main advantage of incorporating a modular design in QCDES is to have great
flexibility in updating or adding modules in the future. The various modules of system
development are represented graphically as follows:
Fig. 2. The QCDES Modules
The development of QCDES has followed the development cycle as follows:
1. Identifying objectives and scope mixseparation
2. Knowledge acquisition (collecting data, reading literature and reports, discussions with
domain experts, case studies, etc.)
3. Preliminary planning and choice of system
4. System design and development
5. Testing, validation and trials
6. Reviews and modifications
7. Implementation
3. Study of problem
Inspection of reinforced concrete structures in marine environment is important. The use of
NDT techniques in combination with coring may enable one to detect the early onset of
Expert Systems for Human, Materials and Automation
224
corrosion where appropriate steps may be taken to slow down the corrosion process. Such
inspection procedures, however, are quite costly as they require experts to conduct the tests
and interpret the results. To wait for the appearance of visible signs of corrosion in a
structure such as rust stains and/or cracks before repair will be conducted is not cost
effective. The presence of such visible signs is indicative of an advanced stage of corrosion
which may require a thorough investigation of the entire structure in order to properly
assess the type of repair or rehabilitation needed for the corroded structure.The use of
prediction models, specifically, the time to initiate corrosion can provide useful information
regarding the early onset of corrosion which allows one to appropriately schedule the
required maintenance.
The subject of diagnosis of deterioration and other problems in reinforced concrete
structures is indeed huge and enormously wide and of great interest to civil engineers.
There are standards for the use of reinforced concrete (British Standards Institution, 1985
&1991). For the purposes of this research work specific domain knowledge relating to
common symptoms of cracking, spalling and delamination is needed.
Vibration condition monitoring of harbor concrete structures makes use of vibration
analysis for the following purposes:
1. Periodic routine vibration measurement to check their structural condition.
2. Trouble shooting for suspected constructional problems.
3. Check to ascertain that the concrete structure has returned to good operating condition
after implementing the reconstruction or repair.
4. Check to enable planning of repair of the harbor concrete structures prior to harbor
service shut- down.
Different defects cause the vibration signatures to change in different ways. A changed
vibration signature provides a means to determine the source of problem as well as prior
warning of the problem itself (Skala & Chobola 2005). This research work is limited to
implementing the acoustic signal processing and condition monitoring of concrete
structures in the splash zone and underwater portions of structures located in the lakes,
rivers, oceans, or ground water.
Fig. 3. The most important modules of proposed rule-based vibration signal diagnostic
expert system
Expert System Development for Acoustic Analysis in Concrete Harbor NDT
225
4. Deciding what action to take
Deciding on the appropriate action to take after a defect has been discovered depends on the
potential hazard of the defect, the risk of continued structural deterioration, the technology
available to repair the defect, the cost associated with the needed repair, and the intended
remaining life of the structure. Following are the possible methods of concrete harbor
inspection:
1. Visual inspection
2. Tactile inspection (Inspection by touch)
3. Underwater non destructive testing of concrete (signal processing)
5. Diving technology
Underwater work can be generally classified into one of three broad categories for accessing
the work site:
1. Manned diving;
2. One-atmosphere armored suit
3. Manned submarine
4. Remotely operated vehicle (ROV).
The industry standards currently allow a diver using compressed air to work at 10 m for an
unlimited period of time. If work is being performed at 20 m, however, the diver can only
work for approximately 60 minutes over a 24-hour period without special precautions to
prevent decompression sickness. The industry standard upper limit is 30 minutes of work
time at 30m in seawater. If these limits are exceeded, precautions must be taken to
decompress the diver.
Undoubtedly, the most dynamic growth in a particular underwater platform has been
exhibited by Remotely Operated Vehicles (ROVs). ROVs look much like an unmanned
version of a submarine. Fig.4 displays the application of the proposed model of ROV,
especially equipped for NDT of quay wall in Shahid-Rajaee harbor. Thay are compact
devices that are controlled by a remote crew. The operating crew and the vehicle
communicate through an umbilical cord attached to the ROV. The crew operates the ROV
with information provided by transponders attached to the frame of the ROV. Generally
the pilot will maneuver the vehicle as closely as prudent to a point adjacent to the
platform and over the work site. ROVs may be launched directly from the surface or from
a submarine mother ship. Most ROVs are equipped with video and still photography
devices. The vehicle is positioned by ballast tanks and thrusters mounted on the frame.
Some ROVs are also equipped with robotic arms that are used to perform tasks that do
not need a high degree of dexterity. Vehicles owned by industrial users range in depth
capability from 200m to 2400 m; the average is 1300m. Structural investigations of
underwater facilities are usually conducted as part of a routine preventive maintenance
program, an initial construction inspection, a special examination prompted by an
accident or catastrophic event, or a method for determining needed repairs. The purpose
of the investigation usually influences the inspection procedures and testing equipment
used. Underwater inspections are usually hampered by adverse conditions such as poor
visibility, strong currents, cold water, marine growth, and debris build-up. Horizontal
and vertical control for accurately locating the observation is difficult. A diving inspector
must wear cumbersome life-support systems and equipment, which also hampers the
inspection mission.