GasTurbine Engineering HandbookSecond Edition phần 9 pot
Bạn đang xem bản rút gọn của tài liệu. Xem và tải ngay bản đầy đủ của tài liệu tại đây (724.77 KB, 82 trang )
G:/GTE/FINAL (26-10-01)/CHAPTER 19.3D ± 641 ± [634±691/58] 1.11.2001 2:38PM
frequency is usually taken up by the GTC, by a fast change in increasing the
load, since the steam turbine cannot respond fast enough. For an increasing
frequency, the gas turbine and the steam turbine both can respond, thus, as
shown in the figure, the gas turbine (60% load) and the steam turbine (40%
load) take their appropriate change in load.
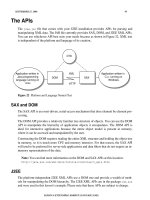
The startup and shutdown of a typical gas turbine is shown in figures 19-5
and 19-6, respectively. The time and percentages are approximate values and
will vary depending upon the turbine design.
The gas turbine during the start-up is on an auxiliary drive, initially it is
brought to a speed of about 1200
Â
±1500 RPM when ignition takes place and
the turbine speed and temperature rise very rapidly. The bleed valves are
open to prevent the compressor from surging. As the speed reaches about
2300
Â
±2500 rpm, the turbine is declutched from its start-up motor, the first
set of bleed valves are closed, and then as the turbine has reached near full
speed, the second set of bleed valves are closed. If the turbine is a two or
three shaft turbine as is the case with aero-derivative turbines, the power
turbine shaft will ``break loose'' at a speed of about 60% of the rated speed of
the turbine.
The turbine temperature, flow, and speed increases in a very short time of
about three to five minutes to the full rated parameters. There is usually a
short period of time where the temperature may overshoot. If supplementary
firing or steam injection for power augmentation is part of the plant system,
these should be turned on only after the gas turbine has reached full flow.
The injection of steam for power augmentation, if done before full load,
could cause the gas turbine compressor to surge.
The shutdown of a gas turbine first requires the shutdown of the steam injec-
tion and then the opening of the bleed valves to prevent the compressor from
0
20
40
60
80
100
120
0
2
4
6
8
10
12
Time in Minutes
Load
Speed
Firing Temperature
Percent change of parametres(%)
Figure 19-5. A typical startup curve for a gas turbine.
Control Systems and Instrumentation 641
G:/GTE/FINAL (26-10-01)/CHAPTER 19.3D ± 642 ± [634±691/58] 1.11.2001 2:38PM
surging as the speed is reduced. The gas turbine, especially for frame type units,
must be put on a turning gear to ensure that the turbine rotor does not bow.
The lubrication systems must be on so that the lubrication can cool of the
various components, this usually takes about 30
Â
±60 minutes.
Startup Sequence
One of the major functions of the combined control-protection system is to
perform the startup sequence. This sequence ensures that all subsystems of the
gas turbine perform satisfactorily, and the turbine does not heat too rapidly or
overheat during startup. The exact sequence will vary for each manufacturer's
engine, and the owner's and operator's manual should be consulted for details.
The gas turbine control is designed for remote operations to start from
rest, accelerate to synchronous speed, automatically synchronize with the
system, and be loaded in accordance with the start selector button depressed.
The control is designed to automatically supervise and check as the unit
proceeds through the starting sequence to load condition. A typical startup
sequence for a large gas turbine follows:
Starting preparations. The steps necessary to prepare the services and
apparatus for a typical startup are as follows:
1. Close all associated control and service breakers.
2. If the computer has been de-energized, close the computer breaker,
start the computer, and enter time of day. Under normal conditions,
the computer is left running continuously.
0
20
40
60
80
100
120
0
2
4
6
8
10
12
14
Time in Minutes
Percent of Parameters (%)
Flow
Power
Firing Temperature
Speed
Figure 19-6. A typical shutdown curve for a gas turbine.
642 Gas Turbine Engineering Handbook
G:/GTE/FINAL (26-10-01)/CHAPTER 19.3D ± 643 ± [634±691/58] 1.11.2001 2:38PM
3. Place maintenance switches to ``Auto.''
4. Acknowledge any alarm condition.
5. Check that all lockout relays are reset.
6. Position ``Remote-Local'' switch to desired position.
Startup description. When the unit is prepared to start, the ``Ready to
Start'' lamp will be lit. With local control, operating one of the following
push buttons will initiate a start:
1. Load minimum start.
2. Load base-start.
3. Load peak-start.
The master contactor function will accomplish:
1. Secondary auxiliary lube pump starter energized.
2. Instrument air solenoid valve energized.
3. Combustor-shell pressure transducer line drain solenoid valve
energized.
When the auxiliary lube pump builds up sufficient pressure, the circuit to
close the turbine gear starter will be completed. Thirty seconds are allowed
for the lube pressure to build up, or the unit will shutdown. With the signal
that the turning-gear line-starter is picked up, the sequence will continue.
Next, the starting-device circuit is energized if lube oil pressure is sufficient.
The turning-gear motor will be turned off at about 15% speed. When the
turbine has reached firing speed, the turbine overspeed trip solenoid and
vent solenoid will be energized to reset. With the build up of overspeed trip
oil pressure, the ignition circuit is energized.
The ignition will energize or initiate:
1. Ignition transformers.
2. Ignition time function (30 seconds allowed for establishing flame on
both detectors or the unit will be shut down after several tries).
3. Appropriate fuel circuits (as determined from mode of fuel selected).
4. Atomizing air.
5. Ignition time function (to de-energize ignition at the proper time).
At approximately 50% speed, as sensed by the speed channel, the start-
ing device is stopped. The bleed valves are closed near synchronous speed,
each at a particular combustor-shell pressure. After fuel is introduced and
Control Systems and Instrumentation 643
G:/GTE/FINAL (26-10-01)/CHAPTER 19.3D ± 644 ± [634±691/58] 1.11.2001 2:38PM
ignition confirmed, the speed reference is increased at a preset variable rate
and will determine the fuel valve position set point. The characterized
speed reference and compressor inlet temperature will provide a feed-
forward signal that will approximately position the fuel valves to maintain
the desired acceleration. The speed reference will be compared with the
shaft-speed signal, and any error provides a calibration signal to ensure
that the desired acceleration is maintained. This mode of control will be
limited by maximum blade path and exhaust temperatures corresponding
to the desired turbine inlet temperatures. If desired acceleration is not
maintained, the unit must be shut down. This control avoids many major
turbine failures.
With the advance of the turbine to idle speed, the turbine is ready to
synchronize, and control is considered in synchronization. Both manual and
automatic synchronizing are available locally. The unit is synchronized, and
the main breaker closed. The speed reference will be switched to become a
load reference. The speed/load reference will be automatically increased at a
predetermined rate so that the fuel valve will be at the approximate position
required for the desired load. For maintenance scheduling, the computer will
count the number of normal starts and accumulate the number of hours at
the various load levels.
Shutdown. Normal shutdown shall proceed in an orderly fashion.
Either a local or remote request for shutdown will first reduce the fuel at a
predetermined rate until minimum load is reached. The main and field
breakers and the fuel valves will be tripped. In an emergency shutdown, the
main and field breakers and fuel valves will be tripped immediately without
waiting for the load to be reduced to minimum. All trouble shutdowns are
emergency shutdowns. The turbine will coast down and as the oil pressure
from the motor-driven pump drops, the DC auxiliary lube oil pump will
come on. At about 15% speed, the turning-gear motor will be restarted, and
when the unit coasts to turning-gear speed (about five rpm), the turning-gear
over-running clutch will engage, allowing the turning-gear motor to rotate
the turbine slowly. Below ignition speed, the unit may be restarted; however,
the unit must be purged completely of any fuel. This is accomplished by
moving through the turbine at least five times its total volume flow.
If left on turning gear, it will continue until the turbine exhaust temper-
ature decreases to 150
F (66
C), and a suitable amount of time (up to
60 hrs) has elapsed. At this point, the turning gear and auxiliary lube oil
pump will stop and the shutdown sequence is complete. On recognition of a
shutdown condition, various contact status and analog values are saved
(frozen) for display, if desired.
644 Gas Turbine Engineering Handbook
G:/GTE/FINAL (26-10-01)/CHAPTER 19.3D ± 645 ± [634±691/58] 1.11.2001 2:38PM
Generator protection. The generator protective relays are mounted in a
switchboard, which usually houses the wattmeter and various transducers,
teleductors, and optional watt-hour meters.
The basic generator protection equipment has the following items:
1. Generator differential
2. Negative sequence
3. Reverse power
4. Lockout relays
5. Generator ground relay
6. Voltage-controlled overcurrent relay
Condition Monitoring Systems
Predictive performance-based condition monitoring is emerging, as a
major maintenance technique, with large reduction in maintenance costs as
shown in Figure 19-7. The histogram shows that although an approximate
one-third reduction in operating and maintenance (O&M) costs was achieved
by moving from a ``corrective,'' more realistically termed a ``breakdown''
1.00
0.75
0.50
0.25
0.00
Corrective Preventive
Predictive
Ref: “Power Plant Diagnostics Go
On-Line”
Mechanical Engineering
December 1989
Unit Cost
Figure 19-7. Comparison between various maintenance techniques.
Control Systems and Instrumentation 645
G:/GTE/FINAL (26-10-01)/CHAPTER 19.3D ± 646 ± [634±691/58] 1.11.2001 2:38PM
or ``fix as fail'' repair strategy, to a ``preventive'' regime, this yielded only
approximately half of the maximum cost savings. Although more difficult to
introduce than the simple scheduling of traditional maintenance activities
required for preventive action, the Electric Power Research Institute (EPRI)
research showed that the introduction of ``predictive'' maintenance strategies
could yield a further one-third reduction in O&M costs.
The introduction of the total maintenance condition monitoring system
means the use of composite condition monitoring systems, which combine
mechanical and performance-based analysis with corrosion monitoring.
These three components are the primary building blocks that enable the
introduction of a comprehensive plant-wide condition management strategy.
Numerous case studies have shown that many turbomachinery operational
problems can only be diagnosed and resolved by correlating the represent-
ative performance parameters with mechanical parameters.
In plant health terms, monitoring and measurement both cost money
and are only half way to the real objective, which is the avoidance of cost
and plant damage. Condition management makes proper use of both
activities and exploits information derived from them to generate money
for the plant operator. Good plant condition management, therefore,
should be the objective of materials and machine health specialists.
The change has further implications: in the past, corrosion and condition
monitoring were considered to be service activities, providing only a reactive
strategy. Condition management embodies a pro-active stance on plant
health. This fundamental understanding should not go unrecognized by
the materials and condition monitoring specialists. Condition management
is a huge opportunity for technical specialists to provide the best possible
service to clients, whether internal or external. The same specialists also will
be able to derive the maximum direct benefit from their expertise.
Conventional alloy selection, coating specification and failure investiga-
tion skills will always be required, as will inspection services to confirm the
condition of the plant. However, the phenomenon labeled corrosion should
no longer be regarded as a necessary evil as it is only a problem when out of
control. The electrochemical behavior characterizing corrosion is also the
means by which on-line plant health management can be achieved.
Major power plant complexes contain various types of large machinery.
Examples include many types of machinery, in particular gas and steam
turbines, pumps and compressors, and their effect on the Heat Recovery
Steam Generators (HRSG), condensers, cooling towers, and other major
plant equipment. Thus, the logical trend in condition monitoring is to multi-
machine train monitoring. To accomplish this goal, an extensive database,
which contains data from all machine trains along with many composite
646 Gas Turbine Engineering Handbook
G:/GTE/FINAL (26-10-01)/CHAPTER 19.3D ± 647 ± [634±691/58] 1.11.2001 2:38PM
multi-machine analysis algorithms are implemented in a systematic and
modular form in a central system.
Implementation of advanced performance degradation models, necessit-
ate the inclusion of advanced instrumentation and sensors such as pyrom-
eters for monitoring hot section components, dynamic pressure transducers
for detection of surge and other flow instabilities such as combustion espe-
cially in the new dry low NO
x
combustors. To fully round out a condition
monitoring system the use of expert systems in determining fault and life
cycle of various components is a necessity.
The benefits of total performance based planned maintenance not only
ensure the best and lowest cost maintenance program but also that the plant
is operated at its most efficient point. An important supplementary effect is
that the plant will be operating consistently within its environmental con-
straints.
The new purchasing mantra for the new utility plants is ``life cycle cost''
and to properly ensure that this is achieved a ``total performance condition
monitoring'' strategy is unsurpassed.
To avoid excessive downtime and maintain availability, a turbine should
be closely monitored and all data analyzed for major problem areas.
To achieve effective monitoring and diagnostics of turbomachinery, it is
necessary to gather and analyze both the mechanical and aerothermal oper-
ating data from the machines. The instrumentation and diagnostics must
also be custom tailored to suit the individual machines in the system, and
also to meet the requirements of the end users. The reasons for this are that
there can be significant differences in machines of the same type or manu-
facturer because of differences in installation and operation.
Requirements for an Effective Diagnostic System
1. The system must produce diagnostic and failure prediction informa-
tion in a timely manner before serious problems occur on the
machines monitored.
2. When equipment shutdown becomes necessary, diagnostics must be
precise enough to accomplish problem identification and rectification
with minimal downtime.
3. The system should be useable and understood well enough by produc-
tion personnel so that an engineer is not always necessary when urgent
decisions need to be made.
4. The system should be simple and reliable and cause negligible down-
time for repairs, routine calibration, and checks.
Control Systems and Instrumentation 647
G:/GTE/FINAL (26-10-01)/CHAPTER 19.3D ± 648 ± [634±691/58] 1.11.2001 2:38PM
5. The system must be cost effective; namely, it should cost less to
operate and maintain than the expenses resulting from loss of produc-
tion and machinery repairs that would have resulted if the machinery
was not under monitoring and predictive surveillance.
6. System flexibility to incorporate improvements in the state of the art
is desirable.
7. System expansion capabilities to accept projected increases in
installed machinery or increases in the number of channels must be
considered.
8. The use of excess capacity in a computer system available at the plant
can result in considerable equipment cost savings. System components
that mate with the existing computer system may, therefore, be a
necessary prerequisite.
A condition monitoring system designed to meet these needs must be
comprised of hardware and software designed by engineers with experience
in machinery and energy system design, operation, and maintenance. Each
system needs to be carefully tailored to individual plant and machinery
requirements. The systems must obtain real-time data from the plant DCS
and if required from the gas and steam turbine control systems. Dynamic
vibration data is taken in from the existing vibration analysis system into a
data acquisition system. The system can comprise of several high-perform-
ance networked computers depending on plant size and layout. The data
must be presented using a Graphic User Interface (GUI) and include the
following:
1. Aerothermal analysis: This pertains to a detailed thermodynamic ana-
lysis of the full power plant and individual components. Models are
created of individual components, including the gas turbine, steam
turbine heat exchangers, and distillation towers. Both the algorithmic
and statistical approaches are used. Data is presented in a variety of
performance maps, bar charts, summary charts, and baseline plots.
2. Combustion analysis: This includes the use of pyrometers to detect
metal temperatures of both stationary and rotating components such
as turbine blades. The use of dynamic pressure transducers to detect
flame instabilities in the combustor especially in the new dry low NO
x
applications.
3. Vibration analysis: This includes an on-line analysis of the vibration
signals, FFT spectral analysis, transient analysis, and diagnostics. A
wide variety of displays are available including orbits, cascades, bode
and nyquist plots, and transient plots.
648 Gas Turbine Engineering Handbook
G:/GTE/FINAL (26-10-01)/CHAPTER 19.3D ± 649 ± [634±691/58] 1.11.2001 2:38PM
4. Mechanical analysis: This includes detailed analysis of the bearing tem-
peratures, lube, and seal oil systems and other mechanical subsystems.
5. Corrosion analysis: On-line electrochemical sensors are being used to
monitor changes in the corrosivity of flue gases especially in exhaust
stacks. The progressive introduction of ever-more stringent regula-
tions to reduce NO
x
emissions has resulted in an increase in the risk of
water wall tube wastage in large power boilers, refinery process
heaters and municipal waste incinerators.
6. Diagnosis: This includes several levels of machinery diagnosis assist-
ance available via expert systems. These systems must integrate both
mechanical and aerothermal diagnostics.
7. Trending and prognosis: This includes sophisticated trending and
prognostic software. These programs must clearly provide users to
clearly understand underlying causes of operating problems.
8. ``What-if'' analysis: This program should allow the user to do various
studies of plant operating scenarios to ascertain the expected perform-
ance level of the plant due to environmental and other operational
conditions.
Monitoring Software
The monitoring software for every system will be different. However, all
software is there to achieve one goalÐit must gather data, ensure that it is
correct, and then analyze and diagnose the data. Presentations must be in a
convenient form and should be easily understood by plant operational person-
nel. All priorities must be to the data collection process. This process must not
in any manner be hampered since it is the corner stone of the whole system.
A convenient framework within which to categorize the software could be
as follows:
1. Graphic User Interface (GUI)ÐThis consists of screens, which would
enable the operator to easily interrogate the system and to visually see
where the instruments are installed and their values at any point of
time. By carefully designed screens, the operator will be able to view at
a glance the relative positions of all values, thus, fully understanding
the operation of the machinery.
2. Alarm/system logsÐTo fully understand a machine we have to have
various types of alarms. The following are some of the suggested types
of alarms:
a. Instrument alarms: These alarms are based on the instrumentation
range.
Control Systems and Instrumentation 649
G:/GTE/FINAL (26-10-01)/CHAPTER 19.3D ± 650 ± [634±691/58] 1.11.2001 2:38PM
b. Value range alarm: These alarms are based on operating values of
individual points both measured and calculated points. These
alarms should be variable in that they would change with operat-
ing conditions.
c. Rate of change alarm: These alarms must be based on any rapid
change in values in a given time range. This type of alarm is very
useful to detect bearing problems, surge problems, and other
instabilities.
d. Prognostic alarms: These alarms must be based on trends and the
prognostics based on those trends. It is advisable not to have
prognostics, which project in time more than the time of data that
is trended.
3. Performance maps: These are performance maps based on design or
initial tests (base lines) of the various machinery parameters. These
maps, for example present how power output varies with ambient
conditions, or with properties of the fuel, or the condition of the
filtration system; or how close to the surge line a compressor is
operating. On these maps, the present value is displayed, thus allow-
ing the operator to determine the degradation in performance occur-
ring in the units.
4. Analysis programsÐThese include aerothermal and mechanical ana-
lysis programs, with diagnostics and optimization programs.
a. Aero-thermal analysis: Typical aero-thermal performance calcula-
tions involve the evaluation of component unit power, polytropic
and adiabatic head, pressure ratio, temperature ratio, polytropic
and adiabatic efficiencies, temperature profiles, and a host of other
machine specific conditions under steady state as well as during
transientsÐstartups and shutdowns. This program must be tai-
lored to individual machinery and to the instrumentation avail-
able. Data must be corrected to a base condition, so that it can be
compared and trended. The base condition can vary from ISO
ambient conditions, to design conditions of a compressor or pump
if those conditions are very different from ISO ambient conditions.
To analyze off-design operation, it is necessary to transpose values
from the operating points back to the design point for comparison
of unit degradation.
b. Mechanical analysis: This program must be tailored to the mechan-
ical properties of the machine train under consideration. It should
include bearing analysis, seal analysis, lubrication analysis, rotor
dynamics, and vibration analysis. This includes the evaluation and
correlation of bearing metal temperatures, shaft orbits, vibration
650 Gas Turbine Engineering Handbook
G:/GTE/FINAL (26-10-01)/CHAPTER 19.3D ± 651 ± [634±691/58] 1.11.2001 2:38PM
velocity, spectrum snapshots, waterfall plots, stress analysis, and
material properties.
c. Diagnostic analysis: This program can be part of an expert system
or consist of an operational matrix, which can point to various
problems. The program must include comparison of both perfor-
mance and mechanical health parameters to a machine specific
fault matrix to identify if a fault exists. Expert analysis modules
can in many cases aid to faster fault identification but are usually
more difficult to integrate into the system.
d. Optimization analysis: Optimization programs take into account
many variables, such as, deterioration rate; overhaul costs, interest,
and utilization rates. These programs may also be dependent on
more than one machine train if the process is interrelated between
various trains.
e. Life cycle analysis: The determination of the effect of the material,
the temperature excursions, the number of startups and shut
downs, and the type of fuel all relate to the life of hot section
components.
5. Historical data managementÐThis includes the data acquisition and
storage capabilities. Present-day prices of storage mediums have been
dropping rapidly, and systems with 80 gigabyte hard disks are avail-
able. These disks could store a minimum of five years of one-minute
data for most plants. One-minute data is adequate for most steady
state operation, while start-ups and shutdowns or other non steady
state operation should be monitored and stored at an interval of one
second. To achieve these time rates, data for steady state operation can
be obtained from most plant-wide D-CS systems, and for unsteady
state conditions, data can be obtained from control systems.
Implementation of a Condition Monitoring System
The implementation of a condition monitoring system in a major utilities
plant requires a great deal of forethought. A major utilities plant will have
a number of varied, large rotating equipment. This will consist usually of
various types of prime movers such as large gas turbines, steam turbines,
compressors, pumps, electric generators, and motors. The following are
some of the major steps, which need to be taken to ensure a successful
system installation:
1. The first decision is to decide on what equipment should be monitored
on line and what systems should be monitored off-line. This requires
Control Systems and Instrumentation 651
G:/GTE/FINAL (26-10-01)/CHAPTER 19.3D ± 652 ± [634±691/58] 1.11.2001 2:38PM
an assessment of the equipment in terms of both first cost and oper-
ating costs, redundancy, reliability, efficiency, and criticality.
2. Obtain all pertinent data of the equipment to be monitored. This
would include details of the mechanical design and the performance
design. Some of this information may be difficult to obtain from the
manufacturer and will have to be calculated from data being
obtained in the field or after installation during commissioning tests
in a new installation. Obtaining baseline data is critical in the
installation of any condition monitoring system. In most systems,
it is the rate of change of parameters that are being trended not the
absolute values of these points. It is also important to decide what
type of alarms will be attached to the various points. Rate of
change alarms must be for bearing metal temperatures especially
for thrust bearings where temperature changes are critical. Prognostic
alarms should be applied to critical points. Alarms randomly
applied tend to slow down the system and do not provide added
protection.
The following are some of the basic data that would be necessary in
setting up a system:
a. Type of gases and fluids used in the various processes. The equa-
tion of state and other thermodynamic relationship, which govern
these gases and fluids.
b. Type of fuel used in the prime movers. If the fuel analysis is
available including the fuel composition and the heating values
of the fuel.
c. Materials used in various hot sections such as combustor liners,
turbine nozzles, and blades. This includes stress and strain proper-
ties as well as Larson-Miller parameters.
d. Performance maps of various critical parameters such as power
and heat consumption as a function of ambient conditions, pres-
sure drop in filters, and the effect of backpressure. Compressor
surge, efficiency, and head maps.
3. Determine the instrumentation, which exists, and their actual loca-
tion. Location of the instrumentation from the inlet or exit of the
machinery is important so that proper and effective compensation
may be provided for the various measured parameters. In some cases
additional instrumentation will be needed. Experience indicates that
older plants require 10
Â
±20% more instrumentation depending upon
the age of the plant.
4. Once the data points have been decided, limits and alarm must be set.
This is a long and challenging task, as the limits on many points are
652 Gas Turbine Engineering Handbook
G:/GTE/FINAL (26-10-01)/CHAPTER 19.3D ± 653 ± [634±691/58] 1.11.2001 2:38PM
not given in the operation manuals. In some cases, the criticality of the
equipment may necessitate that the alarm threshold on certain points
be lowered to give early warning of any deterioration of the system. It
should be noted that since this is a condition monitoring system early
alarm warnings are in most cases desirable.
5. Types of reports and summary charts should be planned to optimize
the data and to present it in the most useful manner to the plant
operations, and maintenance personnel.
6. The types of D-CS and the control systems available in the plant. The
protocol of these systems and their relationships to the condition
monitoring system. The slave or master relationship is important in
setting up the protocols.
7. Diagnostics for the system requires noting any unusual characteristics
of the machinery, especially in older plants, which have a history of
operation inspections and overhauls.
8. Costs of operations such as fuel costs, labor costs, down time
costs, overhaul hours, interest rates are necessary in computing
parameters such as time of major inspections, off-line cleaning, and
overhauls.
Plant Power Optimization
On-line optimization processes for large utility plants is gaining tremen-
dous favor. Plant optimization is gaining importance with Combined Cycle
Power Plants as these plants are operated over a wide range of power in day-
to-day operation. On-line optimization may be defined as the place where
economics, operation, and maintenance meet. At first sight, it may be
imagined that process integration is not connected to condition management
or inspection, and this has been the case in the past. However, there is every
incentive for complete integration of all these production-related techno-
logies, since the condition monitoring of the various components in a plant
are upgraded constantly, thus the operational curves with degradation of
each unit are no longer stagnant.
Process integration was developed initially as a means of optimizing the
design of chemical and petrochemical process plants. Process optimization is
still only a pre-construction or pre-production exercise. This is surprising
because many process plants are designed for batch manufacture of a range
of products, each of which will require continuously changing optimization
parameters. Process optimization and re-optimization ``on the fly'' can
enable companies to meet variations in market demand and maximize
production efficiency and overall profitability.
Control Systems and Instrumentation 653
G:/GTE/FINAL (26-10-01)/CHAPTER 19.3D ± 654 ± [634±691/58] 1.11.2001 2:38PM
When embodied in a modern integrated plant environment, dynamic plant
health assessment, process modeling and process integration provide the
means to augment plant reliability, availability and safety with maximum
capacity and flexibility.
On-line Optimization Process
Figure 19-8 shows how on-line systems are configured. The system gathers
data in real time. The data is gathered from either the D-CS system or from
the control system. Data for startups and transients are needed from the
control system since the data from the D-CS is usually updated every three
to four seconds, while the control system can have very rapid loops, which
are updated as often as 40 times per second. To ensure that performance
data is taken at a steady state condition, since most models of the plant are
steady state, the system must observe some key parameters and ensure that
they are not varying. In turbines parameters, such as turbine wheel space,
temperatures should be observed to be constant. This data is then checked
for accuracy and errors removed. This involves simple checks against instru-
ment operational ranges, and system operation parameter ranges. The data
is then fully analyzed and various performance data checks are made. New
operational and performance maps are then plotted and the system then
can optimize itself against an operational model. The operational goal
is to maximize the efficiency of the plant at all loads, thus the new perform-
ance maps, which show degradation of the plant are then used in the plant
model to ensure that the control is at the right setting for the operation of
the plant at any given time. Many maintenance practices are also based on
the rate of economic return these operational maintenance practices such
as an off-line compressor wash would contribute to the operations of the
plant.
Many plants use off-line optimization. Off-line optimization is an open
loop control system. Instead of the closed loop system, which controls the
plant settings, data is provided to the operator so that he can make the
decisions based on the findings of the operational data. Off-line systems are
also used by engineers to design plants and by maintenance personnel to
plan plant maintenance. Comparisons of the on-line systems to off-line
systems can be seen in Table 19-1.
Performance evaluation is also important initially in determining that a
plant meets its guarantee points and, subsequently, to ensure it continues to
be operated at or near its design operating condition. Maintenance practices
are being combined ever more closely with operational practices to ensure
654 Gas Turbine Engineering Handbook
G:/GTE/FINAL (26-10-01)/CHAPTER 19.3D ± 655 ± [634±691/58] 1.11.2001 2:38PM
that plants have the highest reliability with maximum efficiency. When a new
plant is built, its cost amounts to only about 7
Â
±10% of the life cycle cost.
Maintenance costs represent approximately 15
Â
±20% overall. However,
operating costs, which in the case of a power plant for example, consist
essentially of energy costs, make up the remainder, and amount to between
70
Â
±80% of the life cycle costs of the facility. This brings performance
monitoring to the forefront as an essential tool in any type of plant condition
monitoring system. Operating a plant as close as possible to its design
conditions will guarantee that its operating costs will be reduced. As an
Optimization
Module
Control
Systems of
Individual
Turbines
Process
Control
Distributed
Control
System
Condition
Monitoring
Data Evaluation
System
Performance
Vibration
and
Corrosion
Analysis
Figure 19-8. A block diagram for an on-line condition monitoring system.
Control Systems and Instrumentation 655
G:/GTE/FINAL (26-10-01)/CHAPTER 19.3D ± 656 ± [634±691/58] 1.11.2001 2:38PM
illustration of the opportunity cost this represents, large fossil power plants
currently being commissioned range from 600
Â
±2800 MW. The fuel costs for
these plants will amount to between US$72 million and US$168 million per
annum. Therefore, savings of 1
Â
±3% of these costs can amount to an overall
cost reduction of upward of US$1 million per annum.
A change in approach is clearly necessary in order that the full benefit of
integrated plant condition management and control can be recognized and
exploited. Improved control and enhanced performance monitoring will
enable shutdown intervals to be extended without increasing the risk of
premature or unexpected failure. In turn, this will increase the confidence
of operations, inspection and management personnel in the effectiveness of
unified plant administration.
Life Cycle Costs
The life cycle costs of any machinery are dependent on the life expectancy
of the various components, the efficiency of its operation through out its life.
Figure 19-9 shows the cost distribution by the three major categories, initial
costs, maintenance costs, and operating or energy costs. This figure indicates
that the new costs are about 7
Â
±10% of the life cycle costs, while maintenance
costs are approximately 15
Â
±20% of the life cycle costs and operating costs,
which essentially consist of energy costs, make up the remainder between
70
Â
±80% of the life cycle costs of any major machinery in a utilities plant.
Table 19-1
Comparisons of On-line and Off-line Plant Optimization System Use
On-line Systems Off-line Systems
Objectives Maximize economic benefit,
operate the plant at its
maximum efficiency at all
operation points
Maximize economic benefit,
operate the plant at its maximum
efficiency at all operation points
Optimize overall facilities design
and investment
Target Existing operating plant Existing operating plant
New facilities
Facility expansion
Prime use Process and maintenance
operations
Process and maintenance operations
Design modifications
Users Operation and maintenance
engineers
Operation and maintenance engineers
Project and design engineers
656 Gas Turbine Engineering Handbook
G:/GTE/FINAL (26-10-01)/CHAPTER 19.3D ± 657 ± [634±691/58] 1.11.2001 2:38PM
It is therefore clear why the new purchasing mantra for a utility plant, or for
that matter of fact, for any major plant operating large machinery is ``life
cycle cost.''
This brings forth to the forefront performance monitoring as an essential
tool in any type of plant condition monitoring system. The major costs in a
life cycle are the cost of energy. Thus operating the plant as close to its design
conditions guarantees that the plant will reduce its operating costs. This can
be achieved by ensuring that the turbine compressor is kept clean and that
the driven compressor is operating close to its maximum efficiency, which in
many cases is close to the surge line. Thus knowing where the compressor is
operating with respect to its surge line is a very critical component in plant
operating efficiency.
The life expectancy of most hot section parts is dependent on various
parameters and is usually measured in terms of equivalent engine hours. The
following are some of the major parameters that effect the equivalent engine
hours in most machinery, especially gas turbines:
1. Type of fuel.
2. Firing temperature.
3. Materials stress and strain properties.
4. Effectiveness of cooling systems.
5. Number of starts.
6. Number of trips.
Maintenance practices are being combined more and more with opera-
tional practices to ensure that plants have the highest reliability with max-
imum efficiency. This has led to the importance of performance condition
monitoring as a major tool in the operation and maintenance of a plant. Life
cycle costs, rightly so, now drive the entire purchasing cycle and thus the
10%
15%
75%
Maintenance Cost
Initial Cost
Energy Cost
Figure 19-9. Life cycle costs for Combined Cycle Power Plants.
Control Systems and Instrumentation 657
G:/GTE/FINAL (26-10-01)/CHAPTER 19.3D ± 658 ± [634±691/58] 1.11.2001 2:38PM
operation of the plant. Life cycle costs, based on a 25-year life, indicate that
the following are the major cost parameters:
1. Initial purchase cost of equipment is 7
Â
±10% of the overall life cycle
cost.
2. Maintenance costs are about 15
Â
±20% of the overall life cycle cost.
3. Energy costs are about 70
Â
±80% of the life cycle costs.
This distribution in life cycle costs indicates that component efficiency
throughout the life period of the plant is the most important factor affecting
the cost of a particular machine train. Thus, monitoring the efficiency of the
train and ensuring that degradation rates are slowed down ensures that the
predicted life cycle costs are achieved. Performance monitoring of the entire
train is a must for plants operating on life cycle cost strategies.
Performance monitoring also plays a major role in extending life, diag-
nosing problems, and increasing time between overhauls. On-line performance
monitoring requires an in-depth understanding of the equipment being
measured. Most trains are very complex in nature and thus require very
careful planning in installation of these types of systems. The development
of algorithms for a complex train needs careful planning, understanding of
the machinery and process characteristics. In most cases, help from the manu-
facturer of the machinery would be a great asset. For new equipment, this
requirement can be part of the bid requirements. For plants with already
installed equipment, a plant audit to determine the plant machinery status is
the first step.
To sum up, total performance condition monitoring systems will help the
plant engineers to achieve their goals of:
1. Maintaining high availability of their machinery.
2. Minimizing degradation and maintaining operation near design effi-
ciencies.
3. Diagnosing problems, and avoiding operating in regions, which could
lead to serious malfunctions.
4. Extending time between inspections and overhauls.
5. Reducing life cycle costs.
Diagnostic System Components and Functions
1. Instrumentation and instrumentation mountings
2. Signal conditioning and amplifiers for instrumentation
3. Data transmission system (cables, telephone link-up, or microwave)
658 Gas Turbine Engineering Handbook
G:/GTE/FINAL (26-10-01)/CHAPTER 19.3D ± 659 ± [634±691/58] 1.11.2001 2:38PM
4. Data integrity checking, data selection, data normalization and storage
5. Baseline generation and comparison
6. Problem detection
7. Diagnostics generation
8. Prognoses generation
9. On-site display
10. Systems for curve plotting, documentation, and reporting
Data Inputs
Obtaining good data inputs is a fundamental requirement, since any
analysis system is only as good as the inputs to the system. A full audit of
the various trains to be monitored must be made to obtain optimum instru-
mentation selection.
The factors that need to be considered are the instrument type, its meas-
urement range, accuracy requirements, and the operational environmental
conditions. These factors must be carefully evaluated to select instruments of
optimum function and cost to match the total requirements of the system.
For instance, the frequency range of the vibration sensor should be adequate
for monitoring and diagnostics and should match with the frequency range
of analysis equipment. Sensors should be selected to operate reliably and
accurately within the environmental conditions that prevail (for example, when
used on high-temperature turbine casings). Resistance temperature sensors,
with their higher accuracy and reliability compared to thermocouples, may
be necessary for analysis accuracy and reliability. Calibration of instrument-
ation should be conducted on a schedule established after reliability factors
have been analyzed.
All data should be checked for validity and to determine if they are within
reasonable limits. Data that are beyond predetermined limits should be
discarded and flagged for investigation. An unreasonable result or analysis
should set up a routine for identification of possible discrepant input data.
Instrumentation Requirements
It is essential that instrumentation requirements be tailored to the require-
ments of the machine being monitored. However, the instrumentation
requirements should exist to cover the requirements for both vibration and
aerothermal monitoring.
Any existing instrumentation should be used if found to be adequate.
While there are advantages in the use of noncontacting sensors built into
Control Systems and Instrumentation 659
G:/GTE/FINAL (26-10-01)/CHAPTER 19.3D ± 660 ± [634±691/58] 1.11.2001 2:38PM
the machine for measurement of journal displacements, this instrumentation
is often impossible to install in existing machinery. Suitably selected and
located accelerometers can adequately cover the vibration-monitoring
requirements of machinery. Accelerometers are often an essential supple-
ment to displacement sensors to cover the higher frequencies generated by
gear mesh, blade passing, rubs, and other conditions.
Typical Instrumentation (Minimum Requirements for Each Machine)
(Note: Locations and type of sensors depend on the type of machine under
consideration.)
1. Accelerometer
a. At machine inlet bearing case, vertical
b. At the machine discharge bearing case, vertical
c. At machine inlet bearing case, axial
2. Process pressure
a. Pressure drop across filter
b. Pressure at compressor and turbine inlet
c. Pressure at compressor and turbine discharge
3. Process temperature
a. Temperature at compressor and turbine inlet
b. Temperature at compressor and turbine discharge.
4. Machine speed
a. Machine speed of all shafts
5. Thrust-bearing temperature
a. Thermocouples or resistance temperature elements embedded in
front and rear thrust bearing
Desirable Instrumentation (Optional)
1. Noncontacting eddy-current vibration displacement probe adjacent
to:
a. Inlet bearing, vertical
b. Inlet bearing, horizontal
c. Discharge bearing, vertical
d. Discharge bearing, horizontal
2. Noncontacting eddy-current gap-sensing probe adjacent to:
a. Forward face of thrust-bearing collar
b. Rear face of thrust-bearing collar (Note: The noncontacting sensor
in its role of measurement of gap DC voltage is sensitive to probe
660 Gas Turbine Engineering Handbook
G:/GTE/FINAL (26-10-01)/CHAPTER 19.3D ± 661 ± [634±691/58] 1.11.2001 2:38PM
and driver temperature variations. Careful evaluation must be
conducted of sensor type, its mounting, and location for this
measurement.)
3. Process flow measurement at inlet or discharge of machine
4. Radial-bearing temperature thermocouple or resistance temperature
element embedded in each bearing, or temperature at lube oil dis-
charge of each bearing.
5. Lube oil pressure, temperature, and corrosion probe
6. Dynamic pressure transducer at compressor discharge for indication
of flow instability
7. Fuel system (water capacitance probe, corrosion probe, and Btu
detector)
8. Exhaust gas analysis
9. Torque measurement
Figures 19-10 and 19-11 show possible instrument locations for an indus-
trial gas turbine and centrifugal compressor.
Criteria for the Collection of Aerothermal Data
Turbomachinery operating pressures, temperatures, and speeds are very
important parameters. Obtaining accurate pressures and temperatures will
depend not only on the type and quality of the transducers selected, but also
on their location in the gas path of the machine. These factors should be
carefully evaluated. The accuracy of pressure and temperature measure-
ments required will depend on the analysis and diagnostics that need to be
performed. Table 19-2 presents some criteria for selection of aerothermal
instrumentation of pressure and temperature sensors for measurement of
compressor efficiency. Note that the percentage accuracy requirements are
more critical for temperature sensors than pressure sensors. The require-
ments are also dependent on the compressor pressure ratio.
Pressure Drop in Filter System
The prime design objective of the filter system is to protect the gas turbine.
The performance of the gas turbine inlet-air filter system has important and
far-reaching influences on overall maintenance costs, reliability, and avail-
ability of gas turbines. There are three major results of improper air filtra-
tion: (1) erosion, (2) fouling of the axial-flow compressor, and (3) corrosion
of the gas turbine hot-gas path inlets. The importance of the inlet-air
filter, as it relates to each of these three phenomena, can be appreciated if
Control Systems and Instrumentation 661
G:/GTE/FINAL (26-10-01)/CHAPTER 19.3D ± 662 ± [634±691/58] 1.11.2001 2:38PM
Figure 19-10. Instrumentation for monitoring and diagnostics on a gas turbine engine.
662 Gas Turbine Engineering Handbook
G:/GTE/FINAL (26-10-01)/CHAPTER 19.3D ± 663 ± [634±691/58] 1.11.2001 2:38PM
Figure 19-11. Instrumentation for monitoring and diagnostics on a centrifugal compressor.
Control Systems and Instrumentation 663
G:/GTE/FINAL (26-10-01)/CHAPTER 19.3D ± 664 ± [634±691/58] 1.11.2001 2:38PM
one considers the fact that the gas turbine ingests about 7000
Â
±9000 cf
(198.2179
Â
±254.8516 cm) of air per minute for every megawatt of power
produced.
Temperature and Pressure Measurement for Compressors
and Turbines
Temperature and pressure represent two of the major parameters meas-
ured and evaluated in a monitoring system. All gas turbine engines are
equipped with sensors of this type; however, the exact number as well as
their location varies considerably among manufacturers.
At each of the measurement locations, pressure probes may be attached to
a harness, and these probes will direct the air flow to external pressure
transducers for measurement while serving as a sheath for the appropriate
thermocouple at that location (each thermocouple will be seated inside a
pressure probe).
The electrical output of the thermocouple varies with temperature. This
output is fed through a flexible cable to an external signal-conditioner
circuit to amplify and condition the signal for interfacing to the moni-
toring system.
Table 19-2
Criteria for Selection of Pressure and Temperature Sensors for
Compressor Efficiency Measurements
Compressor
Pressure Ratio
P
2
/P
1
P
2
Sensitivity (%) T
2
Sensitivity (%)
6 0.704 0.218
7 0.750 0.231
8 0.788 0.240
9 0.820 0.250
10 0.848 0.260
11 0.873 0.265
12 0.895 0.270
13 0.906 0.277
14 0.933 0.282
15 0.948 0.287
16 0.963 0.290
Tabulation showing percent changes in P
2
and T
2
needed to cause % change in
air compressor efficiency. Ideal gas equations are used.
664 Gas Turbine Engineering Handbook
G:/GTE/FINAL (26-10-01)/CHAPTER 19.3D ± 665 ± [634±691/58] 1.11.2001 2:38PM
Temperature Measurement
Temperature measurement is important to gas turbine performance.
Exhaust gas temperature should be monitored to avoid overheating of
turbine components. Most gas turbines are equipped with a series of ther-
mocouples in their exhausts. Measuring turbine inlet temperature directly is
very useful but, because of the turbine damage that results if a thermocouple
breaks and passes through the turbine blades, thermocouples are not
generally installed upstream of the turbine. Bearing oil temperature is
normally monitored at the discharge to ensure proper oil characteristics;
however, this temperature is not an accurate indication of bearing condi-
tions, since bearings may develop localized hot spots during operation. To
measure bearing temperature accurately, transducers should be located in
the bearings themselves. The temperature will indicate problems in either
journal or thrust-bearings prior to damage. In addition to turbine exhaust
temperatures, compressor inlet and discharge temperature measurement is
necessary to evaluate compressor performance.
For most points requiring temperature monitoring, either thermocouples
or resistive thermal detectors (RTDs) can be used. Each type of temperature
transducer has its own advantages and disadvantages, and both should be
considered when temperature is to be measured. Since there is considerable
confusion in this area, a short discussion of the two types of transducers is
necessary.
Thermocouples
The various types of thermocouples provide transducers suitable for
measuring temperatures from À330 to 5000
F(À201 to 2760
C). The useful
ranges for the various types are shown in Figure 19-12. Thermocouples
function by producing a voltage proportional to the temperature difference
between two junctions of dissimilar metals. By measuring this voltage, the
temperature difference can be determined. It is assumed that the temperature
is known at one of the junctions; therefore, the temperature at the other
junction can be determined. Since the thermocouples produce a voltage, no
external power supply is required to the test junction; however, for accurate
measurement, a reference junction is required. For a temperature monitor-
ing system, reference junctions must be placed at each thermocouple or
similar thermocouple wire installed from the thermocouple to the monitor
where there is a reference junction. Properly designed thermocouple systems
can be accurate to approximately Æ2
F(Æ1
C).
Control Systems and Instrumentation 665