Advanced Database Technology and Design phần 10 doc
Bạn đang xem bản rút gọn của tài liệu. Xem và tải ngay bản đầy đủ của tài liệu tại đây (397.44 KB, 49 trang )
•
Product quality focuses on the characteristics of the product itself.
The approach is to carry out inspections of the finished product,
look for defects, and correct them.
•
Process quality focuses on the characteristics of the process used to
build the product. The focus of process quality lies on defect preven-
tion rather than detection and aims to reduce reliance on mass
inspections as a way of achieving quality [8].
In the context of DBs, product quality relates to characteristics of the
data model and the data itself (the product), while process quality relates to
how data models are developed and how the data are collected and loaded
(the process). This chapter focuses on product quality.
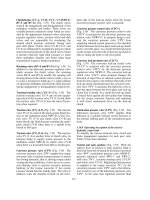
We refer to information quality in a wide sense as comprising DB sys-
tem quality and data presentation quality (see Figure 14.2). In fact, it is
important that data in the DB correctly reflect the real world, that is, the data
are accurate. It is also important for the data to be easy to understand. In DB
system quality, three different aspects could be considered: DBMS quality,
data model quality (both conceptual and logical), and data quality.
This chapter deals with data model quality and data quality. To assess
DBMS quality, we can use an international standard like IS 9126 [9], or
some of the existing product comparative studies (e.g., [10] for ODBMS
evaluation).
Unfortunately, until a few years ago, quality issues focused on software
quality [3, 9, 1114], disregarding DB quality [15]. Even in traditional DB
Database Quality 487
Information quality
Database quality Presentation quality
DBMS
quality
Data model
quality
Data
quality
Figure 14.2 Information and DB quality.
design, quality-related aspects have not been explicitly incorporated [16].
Although DB research and practice have not been focused traditionally on
quality-related subjects, many of the developed tools and techniques (integ-
rity constraints, normalization theory, transaction management) have influ-
enced data quality. It is time to consider information quality as a main goal
to achieve, instead of a subproduct of DB creation and development
processes.
Most of the works for the evaluation of both data quality and data
model quality propose only lists of criteria or desirable properties without
providing any quantitative measures. The development of the properties is
usually based upon experience in practice, intuitive analysis, and reviews of
relevant literature. Quality criteria are not enough on their own to ensure
quality in practice, because different people will generally have different
interpretations of the same concept. According to the total quality manage-
ment (TQM) literature, measurable criteria for assessing quality are necessary
to avoid arguments of style [17]. Measurement is also fundamental to
the application of statistical process control, one of the key techniques of
the TQM approach [8]. The objective should be to replace intuitive notions
of design quality with formal, quantitative measures to reduce subjectivity
and bias in the evaluation process. However, defining reliable and objective
measures of quality in software development is a difficult task.
This chapter is an overview of the main issues relating to the assessment
of DB quality. It addresses data model quality and also considers data (val-
ues) quality.
14.2 Data Model Quality
A data model is a collection of concepts that can be used to describe a set of
data and operations to manipulate the data. There are two types of data mod-
els: conceptual data models (e.g., E/R model), which are used in DB design,
and logical models (e.g., relational, hierarchy, and network models), which
are supported by DBMSs. Using conceptual models, one can build a descrip-
tion of reality that would be easy to understand and interpret. Logical mod-
els support data descriptions that can be processed by a computer through a
DBMS. In the design of DBs, we use conceptual models first to produce
a high-level description of the reality, then we translate the conceptual model
into a logical model.
Although the data modeling phase represents only a small portion
of the overall development effort, its impact on the final result is probably
488 Advanced Database Technology and Design
greater than that of any other phase [18]. The data model forms the foun-
dation for all later design work and is a major determinant of the quality of
the overall system design [19, 20]. Improving the quality of the data model,
therefore, is a major step toward improving the quality of the system being
developed.
The process of building quality data models begins with an under-
standing of the big picture of model quality and the role that data models
have in the development of ISs.
There are no generally accepted guidelines for evaluating the quality
of data models, and little agreement even among experts as to what makes
a good data model [21]. As a result, the quality of data models pro-
duced in practice is almost entirely dependent on the competence of the data
modeler.
When systems analysts and users inspect different data models from
the same universe of discourse, they often perceive that some models are, in
some sense, better than others, but they may have difficulty in explaining
why. Therefore an important concern is to clarify what is meant by a good
data model, a data model of high quality.
Quality in data modeling is frequently defined as a list of desirable
properties for a data model [2227]. By understanding each property and
planning your modeling approach to address each one, you can significantly
increase the likelihood that your data models will exhibit characteristics that
render them useful for IS design. The quality factors are usually based on
practical experience, intuitive analysis, and reviews of relevant literature.
Although such lists provide a useful starting point for understanding and
improving quality in data modeling, they are mostly unstructured, use
imprecise definitions, often overlap, often confuse properties of models with
language and method properties, and often have goals that are unrealistic or
even impossible to reach [28].
Expert data modelers intuitively know what makes a good data model,
but such knowledge can generally be acquired only through experience. For
data modeling to progress from a craft to an engineering discipline, the desir-
able qualities of data models need to be made explicit [22]. The conscious
listing (or bringing to the surface) of those qualities helps to identify areas on
which attention needs to be focused. This can act as a guide to improve the
model and explore alternatives. Not only is the definition of quality factors
important to evaluate data models, but we also have to consider other ele-
ments that allow any two data models, no matter how different they may be,
to be compared precisely, objectively, and comprehensively [29]. So, in this
chapter, we propose and describe the following elements: quality factors,
Database Quality 489
stakeholders, quality concepts, improvement strategies, quality metrics, and
weightings.
14.2.1 Quality Factors
In the literature related to quality in data modeling, there exist a lot of quality
factors definitions. We list here the more relevant ones:
•
Completeness. Completeness is the ability of the data model to meet
all user information and functional requirements.
•
Correctness. Correctness indicates whether the model conforms to
the rules of the data modeling technique in use.
•
Minimality. A data model is minimal when every aspect of the
requirements appears once in the data model. In general, it is better
to avoid redundancies.
• Normality. Normality comes from the theory of normalization asso-
ciated with the relational data model; it aims at keeping the data in a
clean, purified normal form.
• Flexibility. Flexibility is defined as the ease with which the data
model can be adapted to changes in requirements.
• Understandability. Understandability is defined as the ease with
which the concepts and structures in the data model can be under-
stood by users of the model.
•
Simplicity. Simplicity relates to the size and complexity of the data
model. Simplicity depends not on whether the terms in which
the model is expressed are well known or understandable but on the
number of different constructs required.
While it is important to separate the various dimensions of value from the
purposes of analysis, it is also important to bear in mind the interactions
among qualities. In general, some objectives will interfere or conflict with
each other; others will have common implications, or concur; and still others
will not interact at all.
14.2.2 Stakeholders
Stakeholders are people involved in building or using the data modelthere-
fore, they have an interest in its quality. Different stakeholders will generally
be interested in different quality factors.
490 Advanced Database Technology and Design
Different people will have different perspectives on the quality of a data
model. An application developer may view quality as ease of implementation,
whereas a user may view it as satisfaction of requirements. Both viewpoints
are valid, but they need not coincide. Part of the confusion about which is
the best model and how models should be evaluated is caused by differences
between such perspectives.
The design of effective systems depends on the participation and satis-
faction of all relevant stakeholders in the design process. An important con-
sideration, therefore, in developing a framework for evaluating data models is
to consider the needs of all stakeholders. This requires identification of the
stakeholders and then incorporation of their perceptions of value for a data
model into the framework.
The following people are the key stakeholders in the data modeling
process.
•
Users. Users are involved in the process of developing the data model
and verifying that it meets their requirements. Users are interested in
the data model to the extent that it will meet their current and
future requirements and that it represents value for money.
• DB designer. The DB designer is responsible for developing the data
model and is concerned with satisfying the needs of all stakeholders
while ensuring that the model conforms to rules of good data mod-
eling practice.
•
Application developer. The application developer is responsible for
implementing the data model once it is finished. Application devel-
opers will be primarily concerned with the fact that the model can
be implemented given time, budget, resource, and technology
constraints.
•
Data administrator. The data administrator is responsible for ensur-
ing that the data model is integrated with the rest of the organization
data. The data administrator is primarily concerned with ensuring
data shareability across the organization rather than the needs of spe-
cific applications.
All these perspectives are valid and must be taken into consideration during
the design process. The set of qualities defined as part of the framework
should be developed by coalescing the interests and requirements of the vari-
ous stakeholders involved. It is only from a combination of perspectives that
a true picture of data model quality can be established.
Database Quality 491
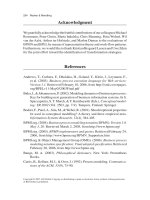
14.2.3 Quality Concepts
It is useful to classify quality according to Krogsties framework [30] (see
Figure 14.3).
Quality concepts are defined as follows:
•
Syntactic quality is the adherence of a data model to the syntax rules
of the modeling language.
•
Semantic quality is the degree of correspondence between the data
model and the universe of discourse.
•
Perceived semantic quality is the correspondence between stakehold-
ers knowledge and the stakeholders interpretation.
•
Pragmatic quality is the correspondence between a part of a data
model and the relevant stakeholders interpretation of it.
•
Social quality has the goal of feasible agreement among stakeholders,
where inconsistencies among various stakeholders interpretations
of the data model are solved. Relative agreement (stakeholders
interpretations may differ but remain consistent) is more realistic
492 Advanced Database Technology and Design
Data model
Modeling
language
Stakeholders'
interpretation
Syntactic
quality
Semantic
quality
Perceived
semantic
quality
Pragmatic
quality
Social
quality
AUTOR
AUTOR
INSTITUCION
INSTITUCION
LIBRO
LIBRO
Trata
Trata
TEMA
TEMA
Edita
Edita
EDITORIAL
EDITORIAL
SOCIO
SOCIO
Tiene
Tiene
EJEMPLAR
EJEMPLAR
Nombre_a
Nombre_i
Identificativo
Presta
Presta
Consta
Consta
(1,n) (0,n)
(0,n)
(0,n)
(0,n)
(0,n)
(0,n)
(0,n)
(0,n)
(1,n)
(1,n)(1,n)
(1,1)
(1,1)
N:M
N:M
N:M
N:M
N:M
1:N
1:1
Escribe
Trabaja
Nombre_t
Fecha_p
Fecha_s
Num_s
Cod_libro
Nombre_e
Stakeholders'
knowledge
Universe of
discourse
Figure 14.3 Quality concepts.
than absolute agreement (all stakeholders interpretations are the
same).
Each quality concept has different goals that must be satisfied. If some of
those goals are not attained, we can think about an improvement strategy.
14.2.4 Improvement Strategies
An improvement strategy is a process or activity that can be used to increase
the value of a data model with respect to one or more quality factors. Strate-
gies may involve the use of automated techniques as well as human judgment
and insight.
Rather than just simply identifying what is wrong with a model or
where it could be improved, we need to identify methods for improving
the model. Of course, it is not possible to reduce the task of improving data
models to a mechanical process, because that requires invention and insight,
but it is useful to identify general techniques that can help improve the qual-
ity of data models.
In general, an improvement strategy may improve a data model on
more than one dimension. However, because of the interactions between
qualities, increasing the value of a model on one dimension may decrease its
value on other dimensions.
14.2.5 Quality Metrics
Quality metrics define ways of evaluating particular quality factors in
numerical terms. Developing a set of qualities and metrics for data model
evaluation is a difficult task. Subjective notions of design quality are not
enough to ensure quality in practice, because different people will have
different interpretations of the same concept (e.g., understandability).
A metric is a way of measuring a quality factor in a consistent and
objective manner. It is necessary to establish metrics for assessing each quality
factor. Software engineers have proposed a plethora of metrics for software
products, processes, and resources [31, 32]. Unfortunately, almost all the
metrics proposed since McCabes cyclomatic number [33] until now have
focused on program characteristics, without paying special attention to DBs.
Metrics could be used to build prediction systems for DB projects [34],
to understand and improve software development and maintenance projects
[35], to maintain the quality of the systems [36], to highlight problematic
Database Quality 493
TEAMFLY
Team-Fly
®
areas [37], and to determine the best ways to help practitioners and research-
ers in their work [38].
It is necessary that metrics applied to a product be justified by a clear
theory [39]. Rigorous measurement of software attributes can provide sub-
stantial help in the evaluation and improvement of software products and
processes [40, 41]. Empirical validation is necessary, not only to prove the
metrics validity but also to provide some limits that can be useful to DB
designers. However, as DeChampeaux remarks, we must be conscious that
associating with numeric ranges the qualifications good and bad is the hard
part [37].
To illustrate the concept of quality metrics, this section shows some
metrics that measure the quality factor of simplicity, as applied to E/R mod-
els. All the metrics shown here are based on the concept of closed-ended met-
rics [42], since they are bounded in the interval [0,1] which allows data
modelers to compare different conceptual models on a numerical scale.
These metrics are based on complexity theory, which defines the complexity
of a system by the number of components in the system and the number of
relationships among the components. Because the aim is to simplify the E/R
model, the objective will be to minimize the value of these metrics.
•
The RvsE metric measures the relation that exists between the
number of relationships and the number of entities in an E/R
model. It is based on M
RPROP
metric proposed by Lethbridge [42].
We define this metric as follows:
RvsE
N
NN
R
RE
=
+
2
where N
R
is the number of relationships in the E/R model, N
E
is
the number of entities in the E/R model, and N
R
+ N
E
> 0.
When we calculate the number of relationships (N
R
), we also
consider the IS_A relationships. In this case, we take into account
one relationship for each child-parent pair in the IS_A relationship.
•
The DA metric is the number of derived attributes that exist in the
E/R model, divided by the maximum number of derived attributes
that may exist in an E/R model (all attributes in the E/R model
except one). An attribute is derived when its value can be calculated
or deduced from the values of other attributes. We define this metric
as follows:
494 Advanced Database Technology and Design
DA
N
N
DA
A
=
−1
where N
DA
is the number of derived attributes in the E/R model,
N
A
is the number of attributes in the E/R model, and N
A
> 1.
When we calculate the number of attributes in the E/R model
(N
A
), in the case of composite attributes we consider each of their
simple attributes.
•
The CA metric assesses the number of composite attributes com-
pared with the number of attributes in an E/R model. A composite
attribute is an attribute composed of a set of simple attributes. We
define this metric as follows:
CA
N
N
CA
A
=
where N
CA
is the number of composite attributes in the E/R model,
N
A
is the number of attributes in the E/R model, and N
A
> 0.
When we calculate the number of attributes in the E/R model
(N
A
), in the case of composite attributes we regard each of their
simple attributes.
•
The RR metric is the number of relationships that are redundant in
an E/R model, divided by the number of relationships in the E/R
model minus 1. Redundancy exists when one relationship R
1
between two entities has the same information content as a path of
relationships R
2
, R
3
, …, R
n
connecting exactly the same pairs of
entity instances as R
1
. Obviously, not all cycles of relationships are
sources of redundancy. Redundancy in cycles of relationships
depends on meaning [22]. We define this metric as follows:
RR
N
N
RR
R
=
=1
where N
RR
is the number of redundant relationships in the E/R
model, N
R
is the number of relationships in the E/R model, and
N
R
> 1.
When we calculate the number of relationship (N
R
), we also
consider the IS_A relationships. In this case, we consider one
relationship for each child-parent pair in the IS_A relationship.
Database Quality 495
•
The M:NRel metric measures the number of M:N relationships com-
pared with the number of relationships in an E/R model. We define
this metric as follows:
MN l
N
N
MNR
R
:Re
:
=
where N
M:NR
is the number of M:N relationships in the E/R
model, N
R
is the number of relationships in the E/R model, and
N
R
> 0.
When we calculate the number of relationships (N
R
), we also
consider the IS_A relationships. In this case, we think over one
relationship for each child-parent pair in the IS_A relationship.
•
The IS_ARel metric assesses the complexity of generalization/spe-
cialization hierarchies (IS_A) in one E/R model. It is based on the
M
ISA
metric defined by Lethbridge [42]. The IS_ARel metric com-
bines two factors to measure the complexity of the inheritance hier-
archy. The first factor is the fraction of entities that are leaves of the
inheritance hierarchy. That measure, called Fleaf, is calculated thus:
Fleaf
N
N
Leaf
E
=
where N
Leaf
is the number of leaves in one generalization or
specialization hierarchy, N
E
is the number of entities in each
generalization or specialization hierarchy, and N
E
> 0.
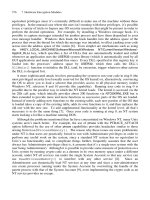
Figure 14.4 shows several inheritance hierarchies along with
their measures of Fleaf. Fleaf approaches 0,5 when the number of
leaves is half the number of entities, as shown in Figure 14.4(c) and
(d). It approaches 0 in the ridiculous case of a unary tree, as shown
in Figure 14.4(c), and it approaches 1 if every entity is a subtype of
the top entity, as shown in Figure 14.4(d). On its own, Fleaf has
the undesirable property that, for a very shallow hierarchy (e.g., just
two or three levels) with a high branching factor, it gives a
measurement that is unreasonably high, from a subjective
standpoint; see Figure 14.4(a). To correct that problem with Fleaf,
an additional factor is used in the calculation of the IS_ARel
metric: the average number of direct and indirect supertypes per
496 Advanced Database Technology and Design
nonroot entity, ALLSup (the root entity is not counted because it
cannot have parents).
The IS_ARel metric is calculated using the following formula:
IS A l Fleaf
Fleaf
ALLSup
_ Re =−
This metric assesses the complexity of each IS_A hierarchy. The
overall IS_ARel complexity is the average of all the IS_ARel
complexities in the E/R model.
Table 14.2 summarizes the meaning of the values of the proposed
closed-ended metrics. Columns indicate the interpretation of measurements
at the extremes of that range and in the middle.
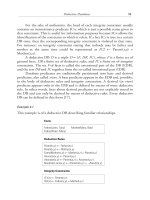
Now we will apply the outlined metrics to the example shown in
Figure 14.5, taken from [43].
Table 14.3 summarizes the values of the metrics calculated for the
example in Figure 14.5.
Database Quality 497
E2
E6E5
E4
E3
E1
Fleaf 0,83=
ALLSup 1
IS_ARel 0
=
=
(a) (b)
(c) (d)
E1
E6
E5
E4
E3
E2
Fleaf 0,16=
ALLSup 3
IS_ARel 0,11
=
=
E5
E4
E3
E2
E1
E6
Fleaf 0,15=
ALLSup 1,6
IS_ARel 0,19
=
=
E5
E4
E3
E2
E1
E6
Fleaf 0,28=
ALLSup 2,2
IS_ARel 0,28
=
=
Figure 14.4 Examples of IS_A relationships.
The Kiviat diagram shown in Figure 14.6 is a graphical representation
of the values of the metrics shown in Table 14.3 This diagram is useful
because it allows designers to evaluate the overall complexity of an E/R
schema at a glance. It also serves to compare different conceptual schemas
and then to improve their quality.
498 Advanced Database Technology and Design
Table 14.2
An Interpretation of Measurements
Metrics tends to 0 when… tends to 0,5 when… tends to 1 when…
RvsE No relationships or very
few relationships
2,5 relationships per
entity
Very many relationships per
entity
DA No derived attributes Half of attributes are
derived
All attributes except one are
derived
CA No composite
attributes
Half of attributes are
composite
All attributes are composite
RR No redundant
relationships
Half of relationships are
redundant
All relationships are redundant
(impossible in practice)
M:NRel No M:N relationships Half of relationships are
M:N
All relationships are M:N
IS_ARel Each subtype has about
one parent
All IS_A hierarchies are
binary trees
Very bushy tree: a complex
hierarchy with multiple
inheritance
Table 14.3
Values of the Metrics for the Example in Figure 14.5
Metrics Values
RvsE 0.5357
DA 0.0740
CA 0.1071
RR 0
M:NRel 0.0666
IS_ARel 0.2975
Database Quality 499
Person
Alumnus
Employee
IS_A
Student
SSN
Name
Sex
Birth_Date
Address
First_Name
Number
Street
City
Age
Last_Name
Faculty
Staff
IS_A
Student-
assistant
Degrees
MajorDegree
Year
Percent_Time
Major_Dept
Position
Rank
Teaching_Assistant
Research_Assistant
Project
Course
IS_A
Undergraduate_
Student
Graduate_
Student
Degree program
Class
IS_A
Salary
Department
Works_For
Location
Name
Number
Number_
Employees
Manages
1:N
Project
Controls
Number
Location
Name
1:1
1:N
M:N
IS_A
Entity Relationship
Simple
attribute
Composite
attribute
Multivaluated
attribute
IS_A relationship
Entity relationship symbols
Derived attribute
Works_For
Figure 14.5 An E/R schema.
14.2.6 Weighting
Weighting defines the relative importance of different quality factors in a
particular problem environment. It is impossible to say in absolute terms that
one data model is better than another, irrespective of context. Values can be
assessed only in the light of project goals and objectives. If the system under
development will be used as a basis for competing in the marketplace (e.g., a
product development system), then flexibility will be paramount. If the sys-
tem is used internally and the requirements are stable (e.g., a payroll system),
then flexibility will be less important. The concept of weightings helps to
define what is important and what is not important in the context of the
project.
Finding the best representation generally involves tradeoffs among
different qualities, and an understanding of project priorities is essential to
making those tradeoffs in a rational manner. Depending on users needs, the
importance of different qualities will vary greatly from one project to
another. Weightings provide the means to explicitly incorporate user priori-
ties into the evaluation process. An understanding of the relative importance
of different quality dimensions can highlight those areas where improvement
efforts will be most useful. The project team should come to a common
understanding of what is most important to the user as early as possible in
the modeling process. Ideally, the user sponsor should define the weightings
prior to any data modeling taking place. Analysts can then focus their efforts
on maximizing quality in the areas of highest value to the customer.
500 Advanced Database Technology and Design
0,5
1
RvsE
AvsE
M:NRel
CA
MVA
IS_ARel
DA
RR
SCO
N_aryRel
0
Figure 14.6 A Kiviat diagram.
14.3 Data Quality
DB quality has to deal not only with the quality of the DB models but also
with the quality of the data values. There are different relevant dimensions
for data quality values, as listed next.
•
Accuracy sometimes reflects the nearness of the data values to the val-
ues considered correct. Obviously, the problem in this dimension
is that correct values are not always known, making it difficult to
quantify accuracy.
•
Completeness refers to the portion of the values (of the real world)
that are present in the DB. DB null values reflect sometimes
unknown values.
•
Currency reflects the degree to which data are up to date. There is
an inevitable lag between when a data value changes and when it is
updated in the DB.
• Value consistency means that values do not contradict each other.
Consistency is a crucial factor for decision making.
All these and other dimensions (e.g., [44]) help to measure data quality.
Three different types of measures can be distinguished [45].
•
Subjective measures depend upon the subjective assessment of data
quality, for example, expressed using a questionnaire with a Likert-
type scale from 0 to 7, where 0 indicates not at all and 7 com-
pletely for each question as The data are correct.
•
Objective, application-independent measures, for example, in rela-
tional DB systems can measure the number of violations of referen-
tial integrity present in the DB.
•
Objective, application-dependent measures require domain expert par-
ticipation (the percentage of incorrect addresses in the DB).
Several aspects should be addressed by companies in order to achieve good
data quality and have good marks in these measures: management respon-
sibilities, operation and assurance costs, research and development, produc-
tion, distribution, personnel management, and legal functions [46]. This
section makes reference to only two of them: management and design issues.
Database Quality 501
14.3.1 Management Issues
Companies must, on the one hand, define a quality policy that establishes
the duties of each function to ensure data quality in all its dimensions. But
on the other hand, they must implement an information quality assessment
process.
Regarding the first issue, Redman [47] has proposed a policy covering
four types of roles that can be summed up in five points:
•
All the employees of the company have to assume that data, infor-
mation, and the business processes that create, store, process, and
use data are company properties. Data sharing must be restricted to
legal or privacy considerations.
•
The chief information officer (CIO) will be responsible for keeping
an updated data inventory and its availability and for informing oth-
ers about data quality.
• Data providers and creators both need to understand who uses data
and for what purpose. They can then implement data quality meas-
ures to ensure that users requirements are fulfilled, and implement
data process management.
• People who store and process data must provide architectures and
DBs that minimize unnecessary redundancy, save data from
damages or unauthorized access, and design new technologies to
promote data quality.
•
Users must work with data providersproviding feedback, ensuring
that data are interpreted correctly and used only for legitimate com-
pany purposes, and protecting clients and employees privacy rights.
The data quality policy must be developed by top management and be
aligned with the overall quality policy and system implemented in the
organization. The CIOs role will become increasingly important in the
assurance of the organizations information quality. Miller [48] poses four
interesting questions about information quality that must be answered by
the heads of information technology (IT):
•
Are yesterdays perceptions of our quality needs still valid?
•
How do quality needs translate into technology requirements?
•
Is our technology strategy consistent with our quality needs?
502 Advanced Database Technology and Design
•
Do internal information collection, dissemination, and verification
procedures measure up to quality requirements?
Data quality training and awareness programs must be carried out jointly
with the data quality policy. Personnel involvement is a prerequisite to qual-
ity program success.
In addition, an information quality assessment process must be imple-
mented. English [49] puts forward a methodology called TQdM (Total
Quality data Management), which allows the assessment of an organizations
information quality. The methodology consists of the following steps:
1. Identify an information group that has a significant impact in order
to give more added value.
2. Establish objectives and measures for information quality, for
example, assess the information timeliness and measure the span
that passes from when a datum is known until it is available for a
specific process.
3. Identify the information value and cost chain, which is an
extended business value chain focused on a data group. This chain
covers all the files, documents, DBs, business processes, programs,
and roles related to the data group.
4. Determine the files or processes to assess.
5. Identify the data validation sources to assess data accuracy.
6. Extract random samples of data, applying appropriate statistical
techniques.
7. Measure information quality to determine its reliability level and
discover its defaults.
8. Interpret and inform others about information quality.
A crucial aspect for carrying out this process is the definition of significant
metrics that allow for the analysis and improvement of quality. In [45], three
kinds of metrics are given: subjective (based on user opinion about
data); objective, application-independent (e.g., accuracy); and objective,
application-dependent (specific to a particular domain).
Companies must also measure the value of the information, both infor-
mation produced by operational systems and information produced by
decision-support systems. The way of measuring both kinds of information
varies considerably. In Due [50], three different approaches (normative,
Database Quality 503
TEAMFLY
Team-Fly
®
realistic, and subjective) to the measurement of decision support systems
information can be found.
14.3.2 Design Issues
Unfortunately, few proposals consider data quality to be a crucial factor in
the DB design process. Works like [17] and [51] are the exception in this
sense. The authors of these works provide a methodology that complements
traditional DB methodologies (e.g., [22]). At the first stage of this methodol-
ogy (see Figure 14.7), in addition to creating the conceptual schema using,
for example, an extended E/R model, we should identify quality require-
ments and candidate attributes. Thereafter, the quality parameter view
must be determined, associating a quality parameter with each conceptual
schema element (entity, relationship, …). For example, for an academic
mark, two parameters can be accuracy and timeliness. Next, subjective
parameters are objectified by the addition of tags to conceptual schema
attributes. For example, for the academic mark we can add the source of the
mark (to know its accuracy) and the date (to know its timeliness). Finally,
different quality views are integrated.
504 Advanced Database Technology and Design
Application requirements
Determine the view of data
quality requirements
Application view
quality attributes
Determine parameters
Determine indicators
Quality view integration
Parameter view
Quality view
Quality schema
Figure 14.7 Considering data quality in DB design.
These authors also propose to extend relational DBs with indicators,
allowing the assignment of objective and subjective parameters to the quality
of DB values [51]. For example, in Table 14.4, for each DB value, the source
and the date of the data are stored. The source credibility should be known
(e.g., in the case of the Department of Education, it could be high) to help
knowledge workers in making decisions.
14.4 Summary
If we really consider information to be the main organizational asset, one
of the primary duties of IT professionals must be ensuring its quality. Tradi-
tionally, the only indicator used to measure the quality of data models has
been normalization theory; Gray [52], for example, has proposed a normali-
zation ratio for conceptual schemas.
This chapter presented some elements for characterizing and ensuring
DB quality. Further research about quality in conceptual modeling can be
found in [23, 29, 31, 5358]. More research is necessary on this subject as
well as on the quality of the associated processes: data modeling, data pro-
curement and load, and data presentation.
For data modeling to progress from a craft to an engineering discipline,
formal quality criteria and metrics need to be explicitly defined [30]. We
affirm that in the next decade information quality will be an essential factor
for company success, in the same way as product and service have been in the
past. In this sense, measuring data and data model quality will become
increasingly important, and more metrics need to be researched. As in other
aspects of software engineering, proposing techniques, metrics, or procedures
is not enough; it is also necessary to put them under formal and empirical
validation to ensure their utility.
Database Quality 505
Table 14.4
Table Extended With Quality Indicators
Student Secondary School Final Mark Entrance Examination Mark
William Smith 8
<30/10/90, Education Ministry>
7
<30/7/95, UCLM Univ.>
Gene Hackman 9
<30/10/90, Education Ministry>
6
<10/9/96, UCLM Univ.>
……
References
[1] Van Vliet, J. C., Software Engineering: Principles and Practice, New York: Wiley, 1993.
[2] Zultner, R., QFD for Software: Satisfying Customers, American Programmer,
Feb. 1992.
[3] Gillies, A., Software Quality: Theory and Management, London, UK: Chapman &
Hall, 1993.
[4] Crosby, P., Quality Is Free, New York: Penguin Group, 1979.
[5] Juran, J. M., Quality Control Handbook, 3rd ed., New York: McGraw-Hill, 1974.
[6] ISO 8042, Quality Vocabulary, 1986.
[7] English, L., Information Quality Improvement: Principles, Methods, and Management
Seminar, 5th ed., Brentwood, TN: Information Impact International, 1996.
[8] Deming, W. E., Out of the Crisis, Cambridge, MA: MIT Center for Advanced Engi-
neering, 1986.
[9] ISO 9126, Software Product EvaluationQuality Characteristics and Guidelines for
Their Use, ISO/IEC Standard 9126, Geneva, Switzerland, 1998.
[10] Barry, D., The Object Database Handbook, New York: Wiley, 1996.
[11] Arthur, L., Improving Software Quality, New York: Wiley, 1993.
[12] Oskarsson, Ö., and R. Glass, An ISO 9000 Approach to Building Quality Software,
Upper Saddle River, NJ: Prentice-Hall, 1996.
[13] Jones, C., Software Quality: Analysis and Guidelines for Success, Boston, MA: Interna-
tional Thomson Computer Press, 1997.
[14] Ginac, F., Customer Oriented Software Quality Assurance, Upper Saddle River, NJ:
Prentice-Hall, 1998.
[15] Sneed, H. and O. Foshag, Measuring Legacy Database Structures, Proc. European
Software Measurement Conf. FESMA98, 1998, pp. 199210.
[16] Wang, R. Y., H. B. Kon, and S. E. Madnick, Data Quality Requirements Analysis
and Modeling, Proc. 9th Intl. Conf. on Data Engineering, Vienna, Austria, 1993,
pp. 670677.
[17] Zultner, R. E., The Deming Way: Total Quality Management for Software, Proc.
Total Quality Management for Software Conf., Washington, DC, Apr. 1992.
[18] Simsion, G. C., Creative Data Modelling, Proc. 10th Intl. Entity Relationship Conf.,
San Francisco, CA, 1991.
[19] Meyer, B., Object Oriented Software Construction, New York: Prentice-Hall, 1988.
[20] Sager, M., Data Centred Enterprise Modelling Methodologies: A Study of Practice
and Potential, Australian Computer J., Aug. 1988.
506 Advanced Database Technology and Design
[21] Moody, L., and G. Shanks, What Makes a Good Data Model? Evaluating the Qual-
ity of Entity Relationships Models, Proc. 13th Intl. Conf. on Conceptual Modelling
(E/R 94), Manchester, England, Dec. 1417, 1994, pp. 94111.
[22] Batini, C., S. Ceri, and S. Navathe, Conceptual Database Design: An Entity Relationship
Approach, Redwood City, CA: Benjamin/Cummings, 1992.
[23] Boman, M., et al., Conceptual Modelling, New York: Prentice-Hall, 1997.
[24] Reingruber, M., and W. Gregory, The Data Modeling Handbook: A Best-Practice
Approach To Building Quality Data Models, New York: Wiley, 1994.
[25] Roman, G., A Taxonomy of Current Issues in Requirements Engineering, Computer
IEEE, Apr. 1985, pp. 1422.
[26] Levitin, A., and T. Redman, Quality Dimensions of a Conceptual View, Informa-
tion Processing and Management, Vol. 31, 1994, pp. 8188.
[27] Simsion, G., Data Modeling Essentials, New York: Van Nostrand Reinhold, 1994.
[28] Lindland, O., G. Sindre, and A. Solvberg, Understanding Quality in Conceptual
Modelling, IEEE Software, Vol. 11, No. 2, 1994, pp. 4249.
[29] Moody, D., Metrics for Evaluating the Quality of Entity Relationship Models, Proc.
17th Intl. Conf. on Conceptual Modelling (E/R 98), Singapore, Nov. 1619, 1998,
pp. 213225.
[30] Krogstie, J., O. I. Lindland, and G. Sindre, Towards a Deeper Understanding of
Quality in Requirements Engineering, Proc. 7th Intl. Conf. on Advanced Information
Systems Engineering (CAISE), Jyväskylä, Finland, June 1995, pp. 8295.
[31] Melton, A., Software Measurement, London, UK: International Thomson Computer
Press, 1996.
[32] Fenton, N., and S. Pfleeger, Software Metrics: A Rigorous and Practical Approach, 2nd
ed., Boston, MA: PWS Publishers, 1997.
[33] McCabe, T., A Complexity Measure, IEEE Trans. on Software Engineering, Vol. 2,
No. 5, 1976, pp. 308320.
[34] MacDonell, S., M. Shepperd, and P. Sallis, Metrics for Database Systems: An
Empirical Study, Proc. 4th Intl. Software Metrics Symp.Metrics97, Albuquerque,
NM, 1997, pp. 99107.
[35] Briand, L., S. Morasca, and V. Basili, Property-Based Software Engineering Measure-
ment, IEEE Trans on Software Engineering, Vol. 22, No. 1, Jan. 1996.
[36] Graham, I., Migrating to Object Technology, Reading, MA: Addison-Wesley, 1995.
[37] DeChampeaux, D., Object-Oriented Development Process and Metrics, Upper Saddle
River, NJ: Prentice-Hall, 1997.
[38] Pfleeger, S., Assessing Software Measurement, IEEE Software, Vol. 14, No. 2,
Mar./Apr. 1997, pp. 2526.
Database Quality 507
[39] Meyer, B., The Role of Object-Oriented Metrics, IEEE Computer, Vol. 31, No. 11,
Nov. 1998, pp. 123125.
[40] Fenton, N., Software Measurement: A Necessary Scientific Basis, IEEE Trans. on
Software Engineering, Vol. 20, No. 3, 1994, pp. 199206.
[41] Morasca, S., and L. Briand, Towards a Theoretical Framework for Measuring Soft-
ware Attribute, Proc. 4th Intl., Software Metrics Symp., 1997, pp. 119126.
[42] Lethbridge, T., Metrics for Concept-Oriented Knowledge Bases, Intl. J. Software
Engineering and Knowledge Engineering, Vol. 8, No. 2, 1998, pp. 161188.
[43] Elmasri, R., and S. Navathe, Fundamentals of Database Systems, 2nd ed., Reading, MA:
Addison-Wesley, 1994.
[44] Wand, Y., and R. Wang, Anchoring Data Quality Dimensions in Ontological Foun-
dations, Comm. ACM, Vol. 39, No. 11, 1996, pp. 8695.
[45] Huang, K. -T., Y. Lee, and R. Wang, Quality Information and Knowledge, Upper Sad-
dle River, NJ: Prentice-Hall, 1999.
[46] Wang, R., V. Storey, and C. Firth, A Framework for Analysis of Data Quality
Research, IEEE Trans. on Knowledge and Data Engineering, Vol. 7, No. 4, 1995,
pp. 623637.
[47] Redman, T., Data Quality for the Information Age, Norwood, MA: Artech House,
1996.
[48] Miller, H., The Multiple Dimensions of Information Quality, Information Systems
Management, Spring 1996, pp. 7982.
[49] English, L., Improving Data Warehouse and Business Information Quality, New York:
Wiley, 1999.
[50] Due, R., The Value of Information, Information Systems Management, 1996,
pp. 6872.
[51] Wang, R., M. Reddy, and H. Kon, Toward Quality Data: An Attribute-Based
Approach, Decision Support Systems, Vol. 13, 1995, pp. 349372.
[52] Gray, R., et al., Design Metrics for Database Systems, BT Technology J., Vol. 9,
No. 4, 1991, pp. 6979.
[53] Eick, C., A Methodology for the Design and Transformation of Conceptual Sche-
mas, Proc. 17th Intl. Conf. on Very Large Data Bases, Barcelona, Spain, 1991.
[54] Pohl, K., The Three Dimensions of Requirements Engineering: A Framework and Its
Applications, Information Systems, Vol. 19, 1994, pp. 243258.
[55] Kesh, S., Evaluating the Quality of Entity Relationship Models, Information and
Software Technology, Vol. 37, No. 12, 1995, pp. 681689.
508 Advanced Database Technology and Design
[56] Moody, L., G. Shanks, and P. Darke, Improving the Quality of Entity Relationship
ModelsExperience in Research and Practice, Proc. 17th Intl. Conf. on Conceptual
Modelling (E/R 98), Singapore, Nov. 1619, 1998, pp. 255276.
[57] Shanks, G., and P. Darke, Quality in Conceptual Modelling: Linking Theory and
Practice, Proc. Pacific Asia Conf. on Information Systems (PACIS97), Brisbane, Austra-
lia, 1997, pp. 805814.
[58] Schuette, R., and T. Rotthowe, The Guidelines of ModelingAn Approach to
Enhance the Quality in Information Models, Proc. 17th Intl. Conf. on Conceptual
Modelling (E/R 98), Singapore, Nov. 1619, 1998, pp. 240254.
Selected Bibliography
Huang, K. -T., Y. W. Lee, and R. Y. Wang, Quality Information and Knowl-
edge, Upper Saddle River, NJ: Prentice-Hall, 1999.
This book can be divided in two different but related parts. The first part
deals with information quality; it explains how to manage information as a
product and how to measure and improve information quality. The second
part focuses on the creation and management of organizational knowledge.
Companies must address both of these critical issues if they are to survive and
prosper in the digital economy.
Reingruber, M. C., and W. W. Gregory, The Data Modeling Handbook: A
Best-Practice Approach To Building Quality Data Models, New York: Wiley,
1994.
In a clear and straightforward way, this book on building quality data
models offers rules and guidelines for building accurate, complete, and useful
data models. It also offers detailed guidance to establishing a continuous
quality-evaluation program that is easy to implement and follow.
Zuse, H., A Framework of Software Measurement, New York: Walter de
Gruyter, 1997.
This book on software measurement provides basic principles as well as
theoretical and practical guidelines for the use of numerous kinds of software
measures. It is written to enable scientists, teachers, practitioners, and stu-
dents to define the basic terminology of software measurement and to con-
tribute to theory building. It includes the main proposed metrics so far.
Database Quality 509
This Page Intentionally Left Blank
About the Authors
David A. Anstey is a custom solutions practice manager for the Aris Corpo-
ration. He is a 1982 graduate of the United States Military Academy, West
Point, New York. His 12 years of computer science experience include con-
sulting as well as designing and developing Oracle-based applications. His
current technological focus is on UML and e-business solutions. His e-mail
address is
Elisa Bertino is a professor of computer science in the Department of Com-
puter Science at the University of Milan. She is or has been on the editorial
boards of the following scientific journals: ACM Transactions on Information
and Systems Security, IEEE Transactions on Knowledge and Data Engineering,
Theory and Practice of Object Systems Journal, Journal of Computer Security,
Very Large Database Systems Journal, Parallel and Distributed Database, and
International Journal of Information Technology. She is currently serving as
program chair of ECOOP 2000. Her e-mail address is
Mokrane Bouzeghoub is a professor at the University of Versailles in France.
He is the director of the database group in the PRiSM laboratory. His
research interests are in database design, data integration, data warehouses,
workflows, and software engineering. He is the co-editor in chief of the Inter-
national Journal on Networking and Information Systems. He has published
different books on databases and object technology. His e-mail address is
511