Báo cáo lâm nghiệp: "Modelling canopy conductance and stand transpiration of an oak forest from sap flow measurements " docx
Bạn đang xem bản rút gọn của tài liệu. Xem và tải ngay bản đầy đủ của tài liệu tại đây (492.13 KB, 10 trang )
Original
article
Modelling
canopy
conductance
and
stand
transpiration
of
an
oak
forest
from
sap
flow
measurements
A
Granier,
N
Bréda
Équipe
bioclimatologie
et
écophysiologie,
unité
d’écophysiologie
forestière,
Centre
de
Nancy,
Inra,
54280
Champenoux,
France
(Received
13
January
1994;
accepted
31
October
1995)
Summary —
In
this
study,
transpiration
was
estimated
from
half-hourly
sap
flow
measurements
in
a
35-year-old
sessile
oak
stand
(Quercus
petraea)
from
1990
until
1993
under
various
soil
water
conditions.
The
canopy
conductance,
calculated
from
the
Penman-Monteith
equation,
was
first
analysed
in
rela-
tion
to
climatic
variables:
global
radiation
(R
g)
and
vapour
pressure
deficit
(VPD).
The
maximum
canopy
conductance
(g
cmax
)
was
modelled
with
a
nonlinear
multiple
regression
over a
period
of
non-
limiting
soil
water
content,
and
of
maximal
leaf
area
index
(LAI)
with
a
r2
∼
0.80.
Limitations
of
gc
due
to
soil
water
deficit
(relative
extractable
water
[REW])
and
canopy
development
(LAI)
were
then
taken
into
account
in
the
model
by
using
multiplicative
limiting
functions
of
REW
and
LAI.
A
general
canopy
conductance
model
was
then
proposed.
Finally,
this
relationship
was
re-introduced
in
the
Pen-
man-Monteith
equation
to
predict
dry
canopy
transpiration.
Simulated
transpiration
was
in
good
agree-
ment
with
sap
flow
measurements
during
the
year
following
the
calibration
(r
2=
0.92
in
the
control
plot,
0.86
in
the
dry
plot).
The
omega
decoupling
coefficient
was
close
to
0.1
on
a
seasonal
basis,
indicating
that
transpiration
was
highly
dependent
on
VPD.
canopy
conductance
/
transpiration
/
sap
flow
/
oak
stand
/
model
Résumé —
Modélisation
de
la
conductance
du
couvert
et
de
la
transpiration
du
peuplement
d’une
forêt
de
chênes
à
partir
de
mesures
de
flux
de
sève.
Dans
ce
travail,
la
transpiration
a
été
estimée
à
partir
de
mesures
semi-horaires
de
flux
de
sève
dans
un
peuplement
de
chênes
sessiles
(Quercus
petraea)
âgé
de
35
ans,
entre
1990
et
1993.
Différentes
conditions
hydriques
ont
été
étudiées.
La
conductance
du
couvert
(gc),
calculée
à
partir
de
l’équation
de
Penman-Monteith,
a
été
dans
une
première
étape
reliée
aux
facteurs
climatiques
rayonnement
global
(R
g)
et
déficit
de
saturation
de
l’air
(vpd).
La conductance
de
couvert
maximale
(g
cmax
)
a
été
modélisée
au
moyen
d’une
régression
non
linéaire
multiple
sur
une
période
où
l’eau
du
sol
n’était
pas
limitante,
et
où
l’indice
foliaire
(LAI)
était
maximal,
donnant
un
r2
de
l’ordre
de
0,80.
Les
limitations
de
gc
dues
au
déficit
hydrique
du
sol
(exprimé
par
le
contenu
en
eau
relatif
du
sol
REW)
et
au
développement
foliaire
(LAI)
ont
été
introduites
dans
le
modèle
au
moyen
de
fonctions
multiplicatives
du
REW
et
du
LAI.
Un
modèle
général
de
conductance
du
couvert
a
alors
été
proposé.
Enfin,
cette
relation
a
été
réintroduite
dans
l’équation
de
Penman-Mon-
teith,
pour
simuler
les
variations
horaires
de
la
transpiration.
Les
valeurs
simulées
ont
montré
un
bon
accord
avec
les
valeurs
mesurées
de
flux
de
sève
l’année suivant
celle
du
calibrage
(r
2=
0,92 pour le
traitement
témoin,
0,86
pour
le
sec).
Le
facteur
de
découplage
oméga
a
été
proche
de
0,1,
attestant
une
forte
dépendance
entre
la
transpiration
et
le
vpd.
modèle
/ conductance
du
couvert / chênaie
/ flux
de
sève
/ évapotranspiration
INTRODUCTION
Transpiration
of
a
forest
depends
on
inter-
actions
between
a
number
of
variables,
some
being
the
physical
characteristics
of
the
environment
and
some
the
biological
behaviour
of
the
plants.
Global
radiation
and
vapour
pressure
deficit
are
widely
demon-
strated
to
be
the
most
significant
climatic
variables
controlling
transpiration,
both
on
hourly
and
on
daily
scales.
On
the
other
hand,
stomatal
control
of
transpiration
is
well
characterised
at
the
leaf
level
and
dif-
ferences
in
stomatal
response
among
species
are
often
pointed
out
(Meinzer,
1993).
However,
regulation
of
water
vapour
loss
at
the
canopy
level
has,
up
to
now,
mainly
been
studied
in
coniferous
and
trop-
ical
forests.
Transpiration
of
dry
and
homogeneous
vegetation
canopies
is
classically
estimated
from
climatic
measurements
using
the
Pen-
man-Monteith
equation
(Monteith,
1973),
which
incorporates
the
influence
of
aerody-
namic
and
canopy
conductances.
The
for-
mer
depends
on
roughness
properties
of
the
canopy,
and
the
latter
is
considered
as
the
sum
of
the
stomatal
conductance
of
all
the
leaves,
according
to
the
’big-leaf’
hypoth-
esis.
When
stand
transpiration
is
measured
(sap
flow
or
eddy
correlation),
canopy
con-
ductance
can
be
calculated
by
the
reverse
form
of
the
Penman-Monteith
equation
(Stewart,
1988).
Derivation
of
canopy
con-
ductance
from
sap
flow
measurements
has
been
successfully
compared
to
both
eddy
correlation
measurements
(Granier
et
al,
1990,
1996)
and
field
measurements
of
stomatal
conductance
(Granier
and
Lous-
tau,
1994;
Lu et al,
1995).
We
used
this
procedure
to
develop
a
model
of
canopy
transpiration
of
a
temper-
ate
deciduous
oak
forest,
that
describes
the
dependence
of
transpiration
on
the
envi-
ronmental
driving
variables
(climate
and
soil
water
availability)
and
on
canopy
structure.
In
addition,
the
model
takes
into
account
dynamics
of
leaf
area
within
the
canopy
over
the
season.
STAND
AND
MEASUREMENTS
This
study
was
conducted
from
1990
to
1993
in
a
35-year-old
sessile
oak
stand
(Quercus petraea)
regenerated
from
seed.
Other
species
growing
in
the
understorey
were
removed
(mainly
Tilia
and
Carpinus)
in
order
to
maintain
a
monolayer
structure.
Mean
height
and
diameter
at
breast
height
were
14.8
m
and
8.6
cm,
respectively.
Ver-
tical
extension
of
the
crowns
was
limited
(3-4
m),
due
to
the
high
stand
density
(3
600
stem.ha
-1).
A
part
of
the
stand
was
thinned
in
1992,
while
a
group
of
17
trees
was
arti-
ficially
subjected
to
water
shortage
(see
Bréda
et al,
1993).
Interception
of
global
radiation
(linear
pyranometers,
Inra,
France)
was
monitored
from
bud
burst
to
fall,
so
that
canopy
clo-
sure
was
precisely
dated.
The
seasonal
pat-
tern
of
leaf
area
index
(LAI)
was
estimated
from
both
light
transmittance
of
diffuse
solar
radiation
and
periodic
LAI
measurements
(Demon
leaf
area
meter,
Assembled
Elec-
tronics,
Sydney,
Australia).
Year-to-year
variation
of
maximal
LAI,
as
estimated
from
litter
collections,
ranged
from
4.2
to
6.0
in
the
control,
and
3.3
in
the
thinned
plot.
Meteorological
variables
(wind
speed,
global
and
net
radiation,
air
temperature,
vapour
pressure
deficit
[VPD],
incident
rain-
fall)
were
monitored
2
m
above
the
canopy,
on
a
half-hourly
basis.
Aerodynamic
con-
ductance
(g
a)
was
calculated
from
wind
speed
measurements
from
Monteith’s
equa-
tion
(1965).
The
roughness
parameters
were
determined
from
empirical
functions
estab-
lished
on
coniferous
canopies
(Thom,
1972;
Jarvis
et al,
1976).
Tree
and
stand
transpiration
were
cal-
culated
from
half-hourly
sap
flow
measure-
ments
using
continuous
heated
radial
flowmeters
(Granier,
1987),
assuming
that
sap
flow
at
the
base
of
the
trunk
lagged
0.5
h
behind
canopy
transpiration.
The
nine
to
14
trees
measured
every
year
were
selected
to
be
representative
of
sapwood
and
crown
class
distribution
in
the
stand.
Canopy
conductance
was
evaluated
from
sap
flow
and
climatic
measurements
using
the
Penman-Monteith
equation
(Monteith,
1973),
and
assuming
that
vapour
flux
was
equal
to
sap
flux:
where:
TM:
maximum
transpiration
(mm.h
-1
)
e’(w):
rate
of
change
of
saturation
vapour
pressure
(Pa.C
-1
)
Rn:
net
radiation
above
stand
(W.m
-2
)
G:
rate
of
change
of
sensible
heat
in
the
biomass,
plus
heat
in
the
soil
(W.m
-2
)
p:
density
of
dry
air
(kg.m
-3
)
Cp:
specific
heat
of
dry
air
at
constant
pres-
sure
(J.kg
-1.C-1
)
VPD:
vapour
pressure
deficit
(Pa)
ga:
aerodynamic
conductance
(cm.s
-1
)
gc:
canopy
conductance
(cm.s
-1
)
λ:
latent
heat
of
vaporisation
of
water
(J.kg
-1
)
γ:
psychrometric
constant
(Pa.C
-1
)
In
this
study,
heat
flow
in
the
soil
was
measured
only
during
a
3
month
period
and
it
was
shown
to
be
negligible
(<
4%).
Rate
of
storage
of
heat
in
biomass
was
calculated
from
above-ground
estimated
biomass
and
from
hourly
changes
in
air
temperature
(Stewart,
1988).
Relative
extractable
water
(REW)
was
computed
from
soil
water
content
measured
weekly
with
a
neutron
probe
over
ten
200
cm
long
access
tubes;
soil
water
reserve
was
defined
as
the
difference
between
max-
imum
(field
capacity)
and
minimum
soil
water
content
observed
during
the
1989-1993
period
(see
Bréda
and
Granier,
1996,
for
a
complete
description
of
the
experiment).
All
these
parameters
were
monitored
from
bud
burst
to
fall,
from
1990
to
1993.
Sap
flow
and
climate
data
of
1990
were
used
to
calibrate
the
model
of
transpiration
and
data
of
the
following
years
for
its
validation.
RESULTS
AND
DISCUSSION
Effect
of
global
radiation
and
vapour
pressure
deficit
on
maximal
gc
The
canopy
conductance
(g
c)
was
first
anal-
ysed
in
relation
to
global
radiation
(Rg),
and
vapour
pressure
deficit
(VPD).
In
order
to
extract
drought
and
LAI
effects,
this
analysis
was
conducted
over
a
period
of
nonlimiting
soil
water
content
(manual
irrigation),
of
max-
imal leaf
area
index
and
in
dry
canopy
con-
ditions.
A
threshold
of
VPD
was
taken
as
1
hPa
to
eliminate
wettest
air
conditions
when
the
calculation
of
gc
was
too
impre-
cise.
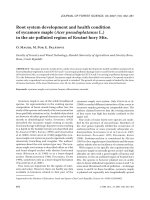
Figure
1
shows
that
canopy
conduc-
tance
was
strongly
reduced
when
VPD
increased:
50%
of
reduction
occurred
when
VPD
increased
from
10
to
20
hPa.
These
data
were
fitted
with
a
nonlinear
multiple
regression
programme
where
maximal
canopy
conductance
(g
cmax
)
was
depending
on
global
radiation
in
a
hyperbolic
way
and
on
VPD
in
a
logarithmic
one:
Hence,
canopy
conductance
is
an
increas-
ing
function
of
global
radiation
and
reaches
50%
of
its
maximum
for
a
global
radiation
of
82
W.m
-2
.
Ogink-Hendriks
(1995)
found
166
W.m
-2
in
a
Quercus
rubra
stand.
These
val-
ues
are
quite
low,
as
compared
with
values
obtained
on
coniferous
stands
(370
W.m
-2
in
Lu
et
al,
1995
for
a
Norway
spruce
forest;
498
W.m
-2
in
Granier
and
Loustau,
1994
for
a Maritime
pine
forest).
Effect
of
leaf
area
variations
on
gc
Canopy
conductance
variations
resulting
from
the
phenological
development
of
the
canopy
were
investigated
in
spring
1990.
During
this
period,
soil
water
content
was
close
to
field
capacity.
The
observed
val-
ues
of
gc
during
spring
were
lower
than
g
cmax
defined
in
equation
[2],
because
of
partial
leaf
expansion.
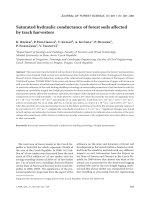
The
ratio
between
observed
and
maximal
values
of
gc
(daily
average
between
11
and
14
h
TU)
was
plot-
ted
against
LAI
from
d118
to
d161
(28
April
to
10
June)
in
figure
2.
A
logarithmic
function
f2
limiting
maximal g
c
was
fitted:
Effect
of
soil
water
deficit
on
gc
The
role
of
water
supply
in
controlling
canopy
conductance
was
investigated
from
observed
values
of
gc
in
both
control
and
dry
plots,
during
a
period
of
constant
and
maximal
LAI.
A
logarithmic
function
of
g
cmax
(f
3,
fig
2)
was
calibrated
using
daily
values
of
relative
extractable
water
(REW):
It
can
be
noted
that
gc
seemed
not
to
be
modified
at
the
beginning
of
soil
drying
(0.6
≤ REW ≤ 1).
Stewart
(1988)
proposed
a
multiplicative
model
of
canopy
conductance
as
the
prod-
uct
of
elementary
functions
of
radiation,
vapour
pressure
deficit,
air
temperature
and
soil
moisture.
In
our
work,
we
assumed
that
temperature
was
of
minor
importance
on
gc
as
compared
with
Rg
and
VPD.
Then
the
complete
canopy
conductance
model
may
be
written
as
follows:
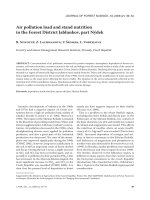
Model
of
transpiration
This
model
of
gc
was
then
re-introduced
in
the
Penman-Monteith
equation
to
predict
dry
canopy
transpiration.
Simulated
transpi-
ration
(fig
3)
was
in
good
agreement
with
sap
flow
measurements
during
the
year
fol-
lowing
the
calibration
(r
2
= 0.92
in
the
control
plot,
0.86
in
the
dry
plot).
Nevertheless,
dif-
ferences
between
sap
flow
and
model
were
observed
in
the
morning
and
in
the
evening,
probably
due
to
a
dehydration
in
the
morning
of
the
water
exchangeable
tissues
of
the
trees
(Jarvis,
1975),
followed
by
a
rehydra-
tion
in
the
evening;
the
best
fit
(r
2
=
0.92)
between
observed
and
predicted
values
was
obtained
by
introducing
a
1
h
time
lag.
During
the
following
2
years,
a
good
cor-
relation
between
observed
and
predicted
transpiration
was
also
found,
but
the
model
overestimated
transpiration,
in
both
the
con-
trol
and
the
dry
plot
(+21 %
in
1992,
+34%
in
1993).
This
means
that
a
factor
other
than
environmental
variables
and
LAI
had
affected
maximal
canopy
conductance.
A
possible
involvement
of
canopy
structure
modifications
is
hypothesized:
as
a
result
of
the
1991
spring
frost,
we
observed
in
the
following
years
a
more
clumped
foliage
dis-
tribution
which
could
lead
to
a
less
favourable
sun
exposure
of
the
leaves.
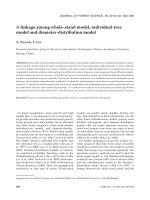
Dependence
of
canopy
conductance
on
leaf area
index
In
order
to
evaluate
the
effect
of
leaf
area
index
on
the
canopy
conductance
varia-
tions,
we
simulated
in
figure
4
the
response
to
increasing
incident
global
radiation.
A
theoretical
oak
canopy
of
LAI
=
6
was
par-
titioned
into
six
layers
of
LAI
=
1
each.
The
same
response
curve
of
canopy
conduc-
tance
to
radiation
was
applied
to
each
layer
(see
Appendix
and
fig
5).
From
the
extinction
profile
of
radiation
predicted
by
the
Beer
law,
using
a
k extinction
coefficient
of
0.42
(Bréda,
1994),
incident
radiation
reaching
each
layer
was
computed.
Then,
the
canopy
conductance
of
each
successive
layer
was
calculated,
assuming
the
same
value
of
VPD
for
each
layer.
Finally,
from
the
rela-
tionship
of
conductances
in
parallel,
the
sum
of
the
conductances
of
all
the
elementary
layers
was
found.
This
simulation
suggested
that
canopy
conductance
increased
quite
linearly
with
LAI
under
high
radiation
(>
500
W.m
-2
)
conditions.
Calculated
gc
for
vari-
ous
maximal
year-to-year
LAI
(under
non-
limiting
soil
water
conditions)
were
close
to
this
linear
response
(fig
6);
in
the
same
experiment,
Bréda
and
Granier
(1996)
also
found
a
linear
relationship
between
stand
transpiration
and
LAI
as
much
during
leaf
expansion
as
during
the
leaf
fall
period.
Coupling
of
transpiration
to
the
atmosphere
We
first
tested
the
sensitivity
of
the
model
to
ga
in
the
case
of
the
oak
stand
using
higher
(+50%)
and
lower
(-80%)
values
of
ga.
The
comparison
with
sap
flow
measurements
showed
only
small
differences
(<
5%)
between
observed
and
simulated
transpi-
ration,
because
ga
was
much
higher
than
gc:
the
ratio
ga
/g
c
varied
from
30
to
200.
The
oak
canopy
appeared
therefore
well
cou-
pled
to
the
atmosphere.
The
degree
of
decoupling
with
the
atmo-
sphere
(Jarvis
and
McNaughton,1986),
the
so-called
omega
coefficient
Q,
is
calculated
from
e’(w)
and
the
ratio
ga
/g
c.
It quantifies
the
dependence
of
transpiration
to
climate.
Calculated
Q
for
bright
days
(fig
7)
ranged
from
0
to
0.1,
VPD
being
the
main
driving
variable
of
canopy
transpiration,
which
was
strongly
limited
by
canopy
conductance.
A
comparison
of
daily
variations
of Q
was
made
with
other
forest
canopies:
Pinus
sylvestris
(Granier
et
al,
1996),
Picea
abies
(Lu,
1992)
and
tropical
rainforest
(Granier
et
al,
1995b).
Midday
value
of
Ω
ranged
from
0.05
to
0.1,
as
much
for
temperate
coniferous
and
broad-leaved
forests
as
for
tropical
rainforest.
Köstner
et
al
(1992)
found
a
similar
diurnal
pattern
of
Ω
in
a
Nothofagus
forest,
but
their
estimates
were
slightly
higher
than
ours
(morning
peak
=
0.38,
after-
noon
=
0.20).
Canopy
conductances
were
similar
in
both
oak
and
Nothofagus
stands,
so
that
differences
were
due
to
a
higher
aerodynamic
conductance
over
the
oak
for-
est.
Hence,
differences
in
Q
between
species
(fig
7)
may
be
related
to
both
aero-
dynamic
characteristics
of
the
canopies
(roughness)
and
of
the
air
mass.
Only
trop-
ical
rainforest
showed
during
the
morning
a
high
Q
value,
when
wind
speed
was
low,
as
also
reported
by
Meinzer
et
al
(1993).
Nevertheless,
care
must
be
taken
that
in
our
experiments
the
height
of
measurement
of
air
temperature
and
vapour
pressure
deficit
was
only
2
m
above
canopies,
ie,
not
at
the
top
of
the
boundary
layer.
CONCLUSION
A
mechanistic
model
has
been
developed
to
evaluate
stand
transpiration
from
the
anal-
ysis
of
interactions
between
stand
structure
and
microclimate.
This
model
provides
a
convenient
analytical
framework.
The
effects
of
leaf
area
on
canopy
conductance
and
hence
on
stand
transpiration
can
be
exam-
ined
in
relation
to
environmental
conditions
and
aerodynamic
characteristics
of
the
stands.
A
water
balance
model,
including
the
present
model
of
transpiration,
has
already
been
used
for
long-term
simulation
of
drought
and
its
influence
on
tree
growth
(Bréda,
1994).
APPENDIX
The
relationship
between
elementary
conduc-
tance
(for
one
layer
of
LAI=1)
and
global
radiation
(R
g)
reaching
this
level
was
assumed
to
be
of
the
form:
Different
response
curve
shapes
can
be
obtained
by
changing
the
value
of
the
parameter
t
t
=
1
corresponds
to
a
broken
line,
t
= 0.2
to
a
curvi-
linear
relationship,
and
t =
0.9
to
an
intermediate
curve
(see
fig
5).
These
three
cases
were
tested
for
LAI
increasing
from
1
to
6,
for
a
fixed
value
of
Rg
=
500
W.m
-2
.
The
case
of
Rg
=
100
W.m
-2
is
also
shown
in
figure
5.
REFERENCES
Bréda
N
(1994)
Analyse
du
fonctionnement
hydrique
des
chênes
sessile
(Quercus
petraea)
et
pédonculé
(Quercus
robur)
en
conditions
naturelles ;
effet
des
facteurs
du
milieu
et
de
I’eclaircie.
PhD
Thesis,
Uni-
versity
of
Nancy
I,
France,
59
p
+
annexes
Bréda
N,
Granier
A
(1996)
Intra-
and
interannual
varia-
tions
of
transpiration,
leaf
area
index
and
radial
growth
of
a
sessile
oak
stand.
Ann
Sci
For 53,
521-
536
Bréda
N,
Cochard
H,
Dreyer
E,
Granier
A (1993)
Water
transfer
in
a
mature
oak
stand
(Quercus
petraea):
seasonal
evolution
and
effects
of
a severe
drought.
Can
J
For
Res
23, 1136-1143
Granier
A (1987)
Evaluation
of
transpiration
in
a
Douglas-
fir
stand
by
means
of
sap
flow
measurements.
Tree
Physiol 3,
309-320
Granier A,
Loustau
D
(1994)
Measuring
and
modelling
the
transpiration
of
a
maritime
pine
canopy
from
sapflow
data.
Agric
For
Meteorol 71, 61-81
Granier
A,
Bobay
V,
Gash
JHC,
Gelpe
J,
Saugier
B,
Shuttleworth
WJ
(1990)
Vapour
flux
density
and
tran-
spiration
rate
comparisons
in
a
stand
of
Maritime
Pine
(Pinus
pinaster Ait)
in
Les
Landes
forest.
Agric
For
Meteorol 51,
309-319
Granier
A,
Huc
R,
Barigah
TT
(1995)
Transpiration
of
natural
rainforest
and
its
dependence
on
climatic
factors.
Agric
For
Meteorol 78,
19-29
Granier A,
Biron
P,
Köstner
B,
Gay
LW,
Najjar
G (1996)
Comparison
of
sap
flow
and
vapour
flow
at
stand
level
and
derivation
of
canopy
conductance
for
Scots
pine.
Theoret Apl
Climat
(in
press)
Jarvis
PG
(1975)
Water
transfer
in
plants.
In:
Heat
and
Mass
Transfer
in
the
Plant
Environment.
Part
1
(DA
de
Vries,
NG
Afgan,
eds),
Scripta
Book
Company,
Washington
DC,
USA,
369-374
Jarvis
PG,
McNaughton
KG
(1986)
Stomatal
control
of
transpiration:
scaling
up
from
leaf
to
region.
Adv
Ecol
Res
15, 1-49
Jarvis
PG,
James
GB,
Landsberg
JJ
(1976)
Coniferous
forest.
In:
Vegetation
and
the
Atmosphere
(JL
Mon-
teith,
ed),
Vol
II, Academic Press,
New
York,
171-240
Köstner
B,
Schulze
ED,
Kelliher
FM,
Hollinger
DY,
Byers
JN,
Hunt
JE,
McSeveny
TM,
Weir
PL
(1992)
Tran-
spiration
and
canopy
conductance
in
a
pristine
broad-
leaved
forest
of
Nothofagus:
an
analysis
of
xylem
sap
flow
and
eddy
correlation
measurements.
Oecologia 91,
350-359
Lu
P
(1992)
Ecophysiologie
et
reaction
à
la
sécheresse
de
trois
espèces
de
conifères
(Abies
alba
Miller,
Picea
abies
(L)
Karsten
et
Pinus
sylvestris
L) ;
effet
de
l’âge.
PhD
Thesis,
University
of
Nancy
I,
France,
116
p
Lu
P,
Biron
P,
Bréda
N,
Granier
A
(1995)
Water
rela-
tions
of
adult
Norway
spruce
trees
under
soil
drought:
water
potential,
stomatal
conductance
and
canopy
transpiration.
Ann
Sci
For 52,
117-129
Meinzer
FC
(1993)
Stomatal
control
of
transpiration.
Trends
Ecol
Evol 8,
289-294
Meinzer
FC,
Goldstein
G,
Holbrook
NM,
Jackson
P,
Cavelier
J
(1993)
Stomatal
and
environmental
con-
trol
of
transpiration
in
a
lowland
tropical
forest
tree.
Plant
Cell
Environ
16,
429-436
Monteith
JL
(1965)
Evaporation
and
environment.
Symp
Soc Exp Bot
19,
206-234
Monteith
JL
(1973)
Principles
of
Environmental
Physics.
Edward
Arnold,
London,
UK,
241
p
Ogink-Hendriks
MJ
(1995)
Modelling
surface
conduc-
tance
and
transpiration
of
an
oak
forest
in
the
Nether-
lands.
Agric
For
Meteorol 74,
99-118
Stewart
JB
(1988)
Modelling
surface
conductance
of
pine
forest.
Agric
For
Meteorol 43,
19-35
Thom
AS
(1972)
Momentum,
mass
and
heat
exchange
of
vegetation.
QJR
Meteorol
Soc
98,
124-134