Data Mining Concepts and Techniques phần 4 potx
Bạn đang xem bản rút gọn của tài liệu. Xem và tải ngay bản đầy đủ của tài liệu tại đây (1.22 MB, 78 trang )
206 Chapter 4 Data Cube Computation and Data Generalization
Step 2 collects statistics on the working relation. This requires scanning the relation
at most once. The cost for computing the minimum desired level and determining
the mapping pairs, (v, v
), for each attribute is dependent on the number of distinct
values for each attribute and is smaller than N, the number of tuples in the initial
relation.
Step 3 derives the prime relation, P. This is performed by inserting generalized tuples
into P. There are a total of N tuples in W and p tuples in P. For each tuple, t, in
W, we substitute its attribute values based on the derived mapping-pairs. This results
in a generalized tuple, t
. If variation (a) is adopted, each t
takes O(log p) to find
the location for count increment or tuple insertion. Thus the total time complexity
is O(N ×log p) for all of the generalized tuples. If variation (b) is adopted, each t
takes O(1) to find the tuple for count increment. Thus the overall time complexity is
O(N) for all of the generalized tuples.
Many data analysis tasks need to examine a good number of dimensions or attributes.
This may involve dynamically introducing and testing additional attributes rather than
just those specified in the mining query. Moreover, a user with little knowledge of the
truly relevant set of data may simply specify “in relevance to ∗” in the mining query,
which includes all of the attributes into the analysis. Therefore, an advanced concept
description mining process needs to perform attribute relevance analysis on large sets
of attributes to select the most relevant ones. Such analysis may employ correlation or
entropy measures, as described in Chapter 2 on data preprocessing.
4.3.3 Presentation of the Derived Generalization
“Attribute-oriented induction generates one or a set of generalized descriptions. How can
these descriptions be visualized?” The descriptions can be presented to the user in a num-
ber of different ways. Generalized descriptions resulting from attribute-oriented induc-
tion are most commonly displayed in the form of a generalized relation (or table).
Example 4.22
Generalized relation (table). Suppose that attribute-oriented induction was performed
on a sales relation of the AllElectronics database, resulting in the generalized description
of Table 4.14 for sales in 2004. The description is shown in the form of a generalized
relation. Table 4.13 of Example 4.21 is another example of a generalized relation.
Descriptions can also be visualized in the form of cross-tabulations, or crosstabs. In
a two-dimensional crosstab, each row represents a value from an attribute, and each col-
umn represents a value from another attribute. In an n-dimensional crosstab (for n > 2),
the columns may represent the values of more than one attribute, with subtotals shown
for attribute-value groupings. This representation is similar to spreadsheets. It is easy to
map directly from a data cube structure to a crosstab.
Example 4.23
Cross-tabulation. The generalized relation shown in Table 4.14 can be transformed into
the 3-D cross-tabulation shown in Table 4.15.
4.3 Attribute-Oriented Induction—An Alternative Method 207
Table 4.14 A generalized relation for the sales in 2004.
location item sales (in million dollars) count (in thousands)
Asia TV 15 300
Europe TV 12 250
North America TV 28 450
Asia computer 120 1000
Europe computer 150 1200
North
America computer 200 1800
Table 4.15 A crosstab for the sales in 2004.
item
TV computer both items
location sales count sales count sales count
Asia 15 300 120 1000 135 1300
Europe 12 250 150 1200 162 1450
North
America 28 450 200 1800 228 2250
all regions 45 1000 470 4000 525 5000
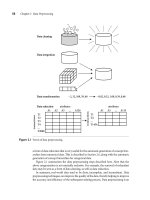
Generalized data can be presented graphically, using bar charts, pie charts, and curves.
Visualization with graphs is popular in data analysis. Such graphs and curves can
represent 2-D or 3-D data.
Example 4.24
Bar chart and pie chart. The sales data of the crosstab shown in Table 4.15 can be trans-
formed into the bar chart representation of Figure 4.20 and the pie chart representation
of Figure 4.21.
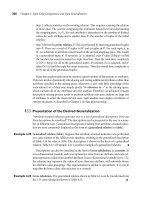
Finally, a 3-D generalized relation or crosstab can be represented by a 3-D data cube,
which is useful for browsing the data at different levels of generalization.
Example 4.25
Cube view. Consider thedata cube shown in Figure 4.22for thedimensions item, location,
and cost. Thisis the samekindof data cubethat we haveseen sofar, althoughit is presented
in a slightly different way. Here, the size of a cell (displayed as a tiny cube) represents the
count of the corresponding cell, while the brightness of the cell can be used to represent
another measure of the cell, such as sum(sales). Pivoting, drilling, and slicing-and-dicing
operations can be performed on the data cube browser by mouse clicking.
A generalized relation may also be represented in the form of logic rules. Typically,
each generalized tuple represents a rule disjunct. Because data in a large database usually
span a diverse range of distributions, a single generalized tuple is unlikely to cover, or
208 Chapter 4 Data Cube Computation and Data Generalization
250
200
150
100
50
0
TV
Sales
Computers
TV + Computers
Asia
Europe
North America
Figure 4.20 Bar chart representation of the sales in 2004.
North
America
(50.91%)
Asia
(27.27%)
Europe
(21.82%)
North
America
(42.56%)
Asia
(25.53%)
Europe
(31.91%)
TV Sales
Computer Sales
North
America
(43.43%)
Asia
(25.71%)
Europe
(30.86%)
TV ϩ Computer Sales
Figure 4.21 Pie chart representation of the sales in 2004.
represent, 100% of the initial working relation tuples, or cases. Thus, quantitative infor-
mation, such as the percentage of data tuples that satisfy the left- and right-hand side of
the rule, should be associated with each rule. A logic rule that is associated with quanti-
tative information is called a quantitative rule.
To define a quantitative characteristic rule, we introduce the t-weight as an interest-
ingness measure that describes the typicality of each disjunct in the rule, or of each tuple
4.3 Attribute-Oriented Induction—An Alternative Method 209
location
item
cost
23.00–799.00
799.00–3,916.00
3,916.00–25,677.00
Not specified
North America
Europe
Australia
Asia
Alarm system
CD player
Compact disc
Computer
Cordless phone
Mouse
Printer
Software
Speakers
TV
Figure 4.22 A 3-D cube view representation of the sales in 2004.
in the corresponding generalized relation. The measure is defined as follows. Let the class
of objects that is to be characterized (or described by the rule) be called the target class.
Let q
a
be a generalized tuple describing the target class. The t-weight for q
a
is the per-
centage of tuples of the target class from the initial working relation that are covered by
q
n
. Formally, we have
t
weight = count(q
a
)/Σ
n
i=1
count(q
a
), (4.1)
where n is the number of tuples for the target class in the generalized relation; q
1
, , q
n
are tuples for the target class in the generalized relation; and q
a
is in q
1
, , q
n
. Obviously,
the range for the t-weight is [0.0, 1.0] or [0%, 100%].
A quantitative characteristic rule can then be represented either (1) in logic form by
associating the corresponding t-weight value with each disjunct covering the target class,
or (2) in the relational table or crosstab form by changing the count values in these tables
for tuples of the target class to the corresponding t-weight values.
Each disjunct of a quantitative characteristic rule represents a condition. In general,
the disjunction of these conditions forms a necessary condition of the target class, since
the condition is derived based on all of the cases of the target class; that is, all tuples
of the target class must satisfy this condition. However, the rule may not be a sufficient
condition of the target class, since a tuple satisfying the same condition could belong to
another class. Therefore, the rule should be expressed in the form
∀X, target
class(X) ⇒ condition
1
(X)[t : w
1
] ∨···∨condition
m
(X)[t : w
m
]. (4.2)
210 Chapter 4 Data Cube Computation and Data Generalization
The rule indicates that if X is in the target
class, there is a probability of w
i
that X
satisfies condition
i
, where w
i
is the t-weight value for condition or disjunct i, and i is
in {1, , m}.
Example 4.26
Quantitative characteristic rule. The crosstab shown in Table 4.15 can be transformed
into logic rule form. Let the target class be the set of computer items. The corresponding
characteristic rule, in logic form, is
∀X, item(X) = “computer” ⇒
(location(X) = “Asia”) [t : 25.00%]∨(location(X) = “Europe”) [t : 30.00%] ∨
(location(X) = “North America”) [t : 45, 00%]
Notice that the first t-weight value of 25.00% is obtained by 1000, the value corres-
ponding to the count slot for “(Asia,computer)”, divided by 4000, the value correspond-
ing to the count slot for “(all
regions, computer)”. (That is, 4000 represents the total
number of computer items sold.) The t-weights of the other two disjuncts were simi-
larly derived. Quantitative characteristic rules for other target classes can be computed
in a similar fashion.
“How can the t-weight and interestingness measures in general be used by the data
mining system to display only the concept descriptions that it objectively evaluates as
interesting?” A threshold can be set for this purpose. For example, if the t-weight
of a generalized tuple is lower than the threshold, then the tuple is considered to
represent only a negligible portion of the database and can therefore be ignored
as uninteresting. Ignoring such negligible tuples does not mean that they should be
removed from the intermediate results (i.e., the prime generalized relation, or the data
cube, depending on the implementation) because they may contribute to subsequent
further exploration of the data by the user via interactive rolling up or drilling down
of other dimensions and levels of abstraction. Such a threshold may be referred to
as a significance threshold or support threshold, where the latter term is commonly
used in association rule mining.
4.3.4 Mining Class Comparisons: Discriminating between
Different Classes
In many applications, users may not be interested in having a single class (or concept)
described or characterized, but rather would prefer to mine a description that compares
or distinguishes oneclass (or concept) from other comparable classes (or concepts). Class
discrimination or comparison (hereafter referred to as class comparison) mines descrip-
tions that distinguish a target class from its contrasting classes. Notice that the target and
contrasting classes must be comparable in the sense that they share similar dimensions
and attributes. For example, the three classes, person, address, and item, are not compara-
ble. However, the sales in the last three years are comparable classes, and so are computer
science students versus physics students.
4.3 Attribute-Oriented Induction—An Alternative Method 211
Our discussions on class characterization in the previous sections handle multilevel
data summarization and characterization in a single class. The techniques developed
can be extended to handle class comparison across several comparable classes. For
example, the attribute generalization process described for class characterization can
be modified so that the generalization is performed synchronously among all the
classes compared. This allows the attributes in all of the classes to be generalized
to the same levels of abstraction. Suppose, for instance, that we are given the AllElec-
tronics data for sales in 2003 and sales in 2004 and would like to compare these two
classes. Consider the dimension location with abstractions at the city, province
or state,
and country levels. Each class of data should be generalized to the same location
level. That is, they are synchronously all generalized to either the city level, or the
province
or state level, or the country level. Ideally, this is more useful than comparing,
say, the sales in Vancouver in 2003 with the sales in the United States in 2004 (i.e.,
where each set of sales data is generalized to a different level). The users, however,
should have the option to overwrite such an automated, synchronous comparison
with their own choices, when preferred.
“How is class comparison performed?” In general, the procedure is as follows:
1. Data collection: The set of relevant data in the database is collected by query process-
ing and is partitioned respectively into a target class and one or a set of contrasting
class(es).
2. Dimension relevance analysis: If there are many dimensions, then dimension rele-
vance analysis should be performed on these classes to select only the highly relevant
dimensions for further analysis. Correlation or entropy-based measures can be used
for this step (Chapter 2).
3. Synchronous generalization: Generalization is performed on the target class to the
level controlled by a user- or expert-specified dimension threshold, which results in
a prime target class relation. The concepts in the contrasting class(es) are general-
ized to the same level as those in the prime target class relation, forming the prime
contrasting class(es) relation.
4. Presentation of the derived comparison: The resulting class comparison description
can be visualized in the form of tables, graphs, and rules. This presentation usually
includes a “contrasting” measure such as count% (percentage count) that reflects the
comparison between the target and contrasting classes. The user can adjust the com-
parison description by applying drill-down, roll-up, and other OLAP operations to
the target and contrasting classes, as desired.
The above discussion outlines a general algorithm for mining comparisons in data-
bases. In comparison with characterization, the above algorithm involves synchronous
generalization of the target class with the contrasting classes, so that classes are simulta-
neously compared at the same levels of abstraction.
The following example mines a class comparison describing the graduate students
and the undergraduate students at Big University.
212 Chapter 4 Data Cube Computation and Data Generalization
Example 4.27
Mining a class comparison. Suppose that you would like to compare the general
properties between the graduate students and the undergraduate students at Big Univer-
sity, given the attributes name, gender, major, birth
place, birth date, residence, phone#,
and gpa.
This data mining task can be expressed in DMQL as follows:
use Big
University DB
mine comparison as “grad
vs undergrad students”
in relevance to name, gender, major, birth place, birth date, residence,
phone#, gpa
for “graduate
students”
where status in “graduate”
versus “undergraduate
students”
where status in “undergraduate”
analyze count%
from student
Let’s see how this typical example of a data mining query for mining comparison
descriptions can be processed.
First, the query is transformed into two relational queries that collect two sets of
task-relevant data: one for the initial target class working relation, and the other for
the initial contrasting class working relation, as shown in Tables 4.16 and 4.17. This
can also be viewed as the construction of a data cube, where the status {graduate,
undergraduate} serves as one dimension, and the other attributes form the remaining
dimensions.
Table 4.16
Initial working relations: the target class (graduate students)
name gender major birth place birth date residence phone# gpa
Jim Woodman M CS Vancouver, BC, Canada 8-12-76 3511 Main St., Richmond 687-4598 3.67
Scott Lachance M CS Montreal, Que, Canada 28-7-75 345 1st Ave., Vancouver 253-9106 3.70
Laura Lee F Physics Seattle, WA, USA 25-8-70 125 Austin Ave., Burnaby 420-5232 3.83
··· ··· ··· ··· ··· ··· ··· ···
Table 4.17
Initial working relations: the contrasting class (undergraduate students)
name gender major birth place birth date residence phone# gpa
Bob Schumann M Chemistry Calgary, Alt, Canada 10-1-78 2642 Halifax St., Burnaby 294-4291 2.96
Amy Eau F Biology Golden, BC, Canada 30-3-76 463 Sunset Cres., Vancouver 681-5417 3.52
··· ··· ··· ··· ··· ··· ··· ···
4.3 Attribute-Oriented Induction—An Alternative Method 213
Second, dimension relevance analysis can be performed, when necessary, on the two
classes of data. After this analysis, irrelevant or weakly relevant dimensions, such as name,
gender, birth
place, residence, and phone#, are removed from the resulting classes. Only
the highly relevant attributes are included in the subsequent analysis.
Third, synchronous generalization is performed: Generalization is performed on the
target class to the levels controlled by user- or expert-specified dimension thresholds,
forming the prime target class relation. The contrasting class is generalized to the same
levels as those in the prime target class relation, forming the prime contrasting class(es)
relation, as presented in Tables 4.18 and 4.19. In comparison with undergraduate
students, graduate students tend to be older and have a higher GPA, in general.
Finally, the resulting class comparison is presented in the form of tables, graphs,
and/or rules. This visualization includes a contrasting measure (such as count%) that
compares between the target class and the contrasting class. For example, 5.02% of the
graduate students majoring in Science are between 26 and 30 years of age and have
a “good” GPA, while only 2.32% of undergraduates have these same characteristics.
Drilling and other OLAP operations may be performed on the target and contrasting
classes as deemed necessary by the user in order to adjust the abstraction levels of
the final description.
“How can class comparison descriptions be presented?” As with class characteriza-
tions, class comparisons can be presented to the user in various forms, including
Table 4.18 Prime generalized relation for the target class (graduate
students)
major age range gpa count%
Science 21 25 good 5.53%
Science 26 30 good 5.02%
Science over 30 very good 5.86%
··· ··· ··· ···
Business over
30 excellent 4.68%
Table 4.19 Prime generalized relation for the contrasting
class (undergraduate students)
major age range gpa count%
Science 16 20 fair 5.53%
Science 16 20 good 4.53%
··· ··· ··· ···
Science 26 30 good 2.32%
··· ··· ··· ···
Business over
30 excellent 0.68%
214 Chapter 4 Data Cube Computation and Data Generalization
generalized relations, crosstabs, bar charts, pie charts, curves, cubes, and rules. With
the exception of logic rules, these forms are used in the same way for characterization
as for comparison. In this section, we discuss the visualization of class comparisons
in the form of discriminant rules.
As is similar with characterization descriptions, the discriminative features of the tar-
get and contrasting classes of a comparison description can be described quantitatively
by a quantitative discriminant rule, which associates a statistical interestingness measure,
d-weight, with each generalized tuple in the description.
Let q
a
be a generalized tuple, andC
j
be the target class, where q
a
covers some tuples of
the target class. Note that it is possible that q
a
also covers some tuples of the contrasting
classes, particularly since we are dealing with a comparison description. The d-weight
for q
a
is the ratio of the number of tuples from the initial target class working relation
that are covered by q
a
to the total number of tuples in both the initial target class and
contrasting class working relations that are covered by q
a
. Formally, the d-weight of q
a
for the class C
j
is defined as
d
weight = count(q
a
∈C
j
)/Σ
m
i=1
count(q
a
∈C
i
), (4.3)
where m is the total number of the target and contrasting classes, C
j
is in {C
1
, , C
m
},
and count (q
a
∈C
i
) is the number of tuples of class C
i
that are covered by q
a
. The range
for the d-weight is [0.0, 1.0] (or [0%, 100%]).
A high d-weight in the target class indicates that the concept represented by the gen-
eralized tuple is primarily derived from the target class, whereas a low d-weight implies
that the concept is primarily derived from the contrasting classes. A threshold can be set
to control the display of interesting tuples based on the d-weight or other measures used,
as described in Section 4.3.3.
Example 4.28
Computing the d-weight measure. In Example 4.27, suppose that the count distribution
for the generalized tuple, major = “Science” AND age
range = “21 .25” AND
gpa = “good”, from Tables 4.18 and 4.19 is as shown in Table 20.
The d-weight for the given generalized tuple is 90/(90 + 210) = 30% with respect to
the target class, and 210/(90 + 210) = 70% with respect to the contrasting class. That is,
if a student majoring in Science is 21 to 25 years old and has a “good” gpa, then based on the
data, there is a 30% probability that she is a graduate student, versus a 70% probability that
Table 4.20 Count distribution between graduate and undergraduate
students for a generalized tuple.
status major age range gpa count
graduate Science 21 25 good 90
undergraduate Science 21 25 good 210
4.3 Attribute-Oriented Induction—An Alternative Method 215
she is an undergraduate student. Similarly, the d-weights for the other generalized tuples
in Tables 4.18 and 4.19 can be derived.
A quantitative discriminant rule for the target class of a given comparison description
is written in the form
∀X, target
class(X)⇐condition(X) [d:d weight], (4.4)
where the condition is formed by a generalized tuple of the description. This is different
from rules obtained in class characterization, where the arrow of implication is from left
to right.
Example 4.29
Quantitative discriminant rule. Based on the generalized tuple and count distribution in
Example 4.28, a quantitative discriminant rule for the target class graduate student can
be written as follows:
∀X, Status(X) = “graduate student”⇐
major(X) = “Science” ∧age range(X) = “21 25” (4.5)
∧ gpa(X) = “good”[d : 30%].
Notice that a discriminant rule provides a sufficient condition, but not a necessary one,
for an object (or tuple) to be in the target class. For example, Rule (4.6) implies that if X
satisfies the condition, then the probability that X is a graduate student is 30%. However,
it does not imply the probability that X meets the condition, given that X is a graduate
student. This is because although the tuples that meet the condition are in the target
class, other tuples that do not necessarily satisfy this condition may also be in the target
class, because the rule may not cover all of the examples of the target class in the database.
Therefore, the condition is sufficient, but not necessary.
4.3.5 Class Description: Presentation of Both Characterization
and Comparison
“Because class characterization and class comparison are two aspects forming a class descrip-
tion, can we present both in the same table or in the same rule?” Actually, as long as we
have a clear understanding of the meaning of the t-weight and d-weight measures and
can interpret them correctly, there is no additional difficulty in presenting both aspects
in the same table. Let’s examine an example of expressing both class characterization and
class comparison in the same crosstab.
Example 4.30
Crosstab for class characterization and class comparison. Let Table 4.21 be a crosstab
showing the total number (in thousands) of TVs and computers sold at AllElectronics
in 2004.
216 Chapter 4 Data Cube Computation and Data Generalization
Table 4.21 A crosstab for the total number (count) of TVs and
computers sold in thousands in 2004.
item
location TV computer both items
Europe 80 240 320
North America 120 560 680
both regions 200 800 1000
Table 4.22
The same crosstab as in Table 4.21, but here the t-weight and d-weight values associated
with each class are shown.
item
TV computer both items
location count t-weight d-weight count t-weight d-weight count t-weight d-weight
Europe 80 25% 40% 240 75% 30% 320 100% 32%
North America 120 17.65% 60% 560 82.35% 70% 680 100% 68%
both regions 200 20% 100% 800 80% 100% 1000 100% 100%
Let Europe be thetarget class andNorth America bethecontrasting class. The t-weights
and d-weights of thesales distribution between thetwo classes are presentedin Table 4.22.
According to the table, the t-weight of a generalized tuple or object (e.g., item = “TV”)
for a given class (e.g., the target class Europe) shows how typical the tuple is of the given
class (e.g., what proportion of these sales in Europe are for TVs?). The d-weight of a tuple
shows how distinctive the tuple is in the given (target or contrasting) class in comparison
with its rival class (e.g., how do the TV sales in Europe compare with those in North
America?).
For example, the t-weight for “(Europe, TV)” is 25% because the number of TVs sold
in Europe (80,000) represents only 25% of the European sales for both items (320,000).
The d-weight for “(Europe, TV)” is 40% because the number of TVs sold in Europe
(80,000) represents 40% of the number of TVs sold in both the target and the contrasting
classes of Europe and North America, respectively (which is 200,000).
Notice that the count measure in the crosstab of Table 4.22 obeys the general prop-
erty of a crosstab (i.e., the count values per row and per column, when totaled, match
the corresponding totals in the both
items and both regions slots, respectively). How-
ever, this property is not observed by the t-weight and d-weight measures, because
the semantic meaning of each of these measures is different from that of count, as
we explained in Example 4.30.
4.3 Attribute-Oriented Induction—An Alternative Method 217
“Can a quantitative characteristic rule and a quantitative discriminant rule be expressed
together in the form of one rule?” The answer is yes—a quantitative characteristic rule
and a quantitative discriminant rule for the same class can be combined to form a
quantitative description rule for the class, which displays the t-weights and d-weights
associated with the corresponding characteristic and discriminant rules. To see how
this is done, let’s quickly review how quantitative characteristic and discriminant rules
are expressed.
As discussed in Section 4.3.3, a quantitative characteristic rule provides a necessary
condition for the given target class since it presents a probability measurement for each
property that can occur in the target class. Such a rule is of the form
∀X, target
class(X)⇒condition
1
(X)[t : w
1
] ∨···∨condition
m
(X)[t : w
m
], (4.6)
where each condition represents a property of the target class. The rule indicates that
if X is in the target
class, the probability that X satisfies condition
i
is the value of the
t-weight, w
i
, where i is in {1, , m}.
As previously discussed in Section 4.3.4, a quantitative discriminant rule provides a
sufficient condition for the target class since it presents a quantitative measurement of
the properties that occur in the target class versus those that occur in the contrasting
classes. Such a rule is of the form
∀X, target
class(X)⇐condition
1
(X)[d : w
1
] ∧···∧condition
m
(X)[d : w
m
]. (4.7)
The rule indicates that if X satisfies condition
i
, there is a probability of w
i
(the
d-weight value) that X is in the target class, where i is in {1, , m}.
A quantitative characteristic rule and a quantitative discriminant rule for a given class
can be combined as follows to form a quantitative description rule: (1) For each con-
dition, show both the associated t-weight and d-weight, and (2) a bidirectional arrow
should be used between the given class and the conditions. That is, aquantitative descrip-
tion rule is of the form
∀X, target
class(X) ⇔ condition
1
(X)[t : w
1
, d : w
1
] (4.8)
θ···θ condition
m
(X)[t : w
m
, d : w
m
],
where θ represents a logical disjunction/conjuction. (That is, if we consider the rule as a
characteristic rule, the conditions are ORed to from a disjunct. Otherwise, if we consider
the rule as a discriminant rule, the conditions are ANDed to form a conjunct). The rule
indicates that for i from 1 to m, if X is in the target
class, there is a probability of w
i
that
X satisfies condition
i
; and if X satisfies condition
i
, there is a probability of w
i
that X is in
the target class.
Example 4.31
Quantitative description rule.It isstraightforward to transform thecrosstab of Table 4.22
in Example 4.30 into a class description in the form of quantitative description rules. For
example, the quantitative description rule for the target class, Europe, is
218 Chapter 4 Data Cube Computation and Data Generalization
∀X, location(X) = “Europe” ⇔
(item(X) = “TV”) [t : 25%,d : 40%] θ (item(X) = “computer”) (4.9)
[t : 75%,d : 30%].
For the sales of TVs and computers at AllElectronics in 2004, the rule states that if
the sale of one of these items occurred in Europe, then the probability of the item
being a TV is 25%, while that of being a computer is 75%. On the other hand, if
we compare the sales of these items in Europe and North America, then 40% of the
TVs were sold in Europe (and therefore we can deduce that 60% of the TVs were
sold in North America). Furthermore, regarding computer sales, 30% of these sales
took place in Europe.
4.4
Summary
Data generalization is a process that abstracts a large set of task-relevant data in
a database from a relatively low conceptual level to higher conceptual levels. Data
generalization approaches include data cube–based data aggregation and attribute-
oriented induction.
From a data analysis point of view, data generalization is a form of descriptive data
mining. Descriptive data mining describes data in a concise and summarative manner
and presents interesting general properties of the data. This is different from predic-
tive data mining, which analyzes data in order to construct one or a set of models, and
attempts to predict the behavior of new data sets. This chapter focused on methods
for descriptive data mining.
A data cube consists of a lattice of cuboids. Each cuboid corresponds to a different
degree of summarization of the given multidimensional data.
Full materialization refers to the computation of all of the cuboids in a data cube
lattice. Partial materialization refers to the selective computation of a subset of the
cuboid cells in the lattice. Iceberg cubes and shell fragments are examples of partial
materialization. An iceberg cube is a data cube that stores only those cube cells whose
aggregate value (e.g., count) is above some minimum support threshold. For shell
fragments of a data cube, only some cuboids involving a small number of dimen-
sions are computed. Queries on additional combinations of the dimensions can be
computed on the fly.
There are several efficient data cube computation methods. In this chapter, we dis-
cussed in depth four cube computation methods: (1) MultiWay array aggregation
for materializing full data cubes in sparse-array-based, bottom-up, shared compu-
tation; (2) BUC for computing iceberg cubes by exploring ordering and sorting
for efficient top-down computation; (3) Star-Cubing for integration of top-down
and bottom-up computation using a star-tree structure; and (4) high-dimensional
Exercises 219
OLAP by precomputing only the partitioned shell fragments (thus called minimal
cubing).
There are several methods for effective and efficient exploration of data cubes, includ-
ing discovery-driven cube exploration, multifeature data cubes, and constrained cube
gradient analysis. Discovery-driven exploration of data cubes uses precomputed mea-
sures and visual cuesto indicate data exceptions at all levels of aggregation, guidingthe
user in the data analysis process. Multifeature cubes compute complex queries involv-
ing multiple dependent aggregates at multiple granularity. Constrained cubegradient
analysis explores significant changes in measures in a multidimensional space, based
on a given set of probe cells, where changes in sector characteristics are expressed in
terms of dimensions of the cube and are limited to specialization (drill-down), gener-
alization (roll-up), and mutation (a change in one of the cube’s dimensions).
Concept description is the most basic form of descriptive data mining. It describes
a given set of task-relevant data in a concise and summarative manner, presenting
interesting general properties of the data. Concept (or class) description consists of
characterization and comparison (or discrimination). The former summarizes and
describes a collection of data, called the target class, whereas the latter summarizes
and distinguishes one collection of data, called the target class, from other collec-
tion(s) of data, collectively called the contrasting class(es).
Concept characterization can be implemented using data cube (OLAP-based)
approaches and the attribute-oriented induction approach. These are attribute- or
dimension-based generalization approaches. The attribute-oriented induction
approach consists of the following techniques: data focusing, data generalization by
attribute removal or attribute generalization, count and aggregate value accumulation,
attribute generalization control, and generalization data visualization.
Concept comparison can be performed using the attribute-oriented induction or
data cube approaches in a manner similar to concept characterization. Generalized
tuples from the target and contrasting classes can be quantitatively compared and
contrasted.
Characterization and comparison descriptions (which form a concept description)
can both be presented in the same generalized relation, crosstab, or quantitative
rule form, although they are displayed with different interestingness measures. These
measures include the t-weight (for tuple typicality) and d-weight (for tuple
discriminability).
Exercises
4.1 Assume a base cuboid of 10 dimensions contains only three base cells: (1) (a
1
, d
2
, d
3
, d
4
,
, d
9
, d
10
), (2) (d
1
,b
2
, d
3
, d
4
, , d
9
, d
10
), and (3) (d
1
, d
2
, c
3
, d
4
, , d
9
, d
10
), where
a
1
= d
1
, b
2
= d
2
, and c
3
= d
3
. The measure of the cube is count.
220 Chapter 4 Data Cube Computation and Data Generalization
(a) How many nonempty cuboids will a full data cube contain?
(b) How many nonempty aggregate (i.e., nonbase) cells will a full cube contain?
(c) How many nonempty aggregate cells will an iceberg cube contain if the condition of
the iceberg cube is “count ≥ 2”?
(d) A cell, c, is a closed cell if there exists no cell, d, such that d is a specialization of
cell c (i.e., d is obtained by replacing a ∗ in c by a non-∗ value) and d has the same
measure value as c. A closed cube is a data cube consisting of only closed cells. How
many closed cells are in the full cube?
4.2 There are several typical cubecomputationmethods, suchas Multiwayarray computation
(MultiWay)[ZDN97],BUC(bottom-upcomputation)[BR99],andStar-Cubing[XHLW03].
Briefly describe these three methods (i.e., use one or two lines to outline the key points),
and compare their feasibility and performance under the following conditions:
(a) Computing a dense full cube of low dimensionality (e.g., less than 8 dimensions)
(b) Computing an iceberg cube of around 10 dimensions with a highly skewed data
distribution
(c) Computing a sparse iceberg cube of high dimensionality (e.g., over 100 dimensions)
4.3 [Contributed by Chen Chen] Suppose a data cube, C, has D dimensions, and the base
cuboid contains k distinct tuples.
(a) Present a formula to calculate the minimum number of cells that the cube, C, may
contain.
(b) Present a formula to calculate the maximum number of cells that C may contain.
(c) Answer parts (a) and (b) above as if the count in each cube cell must be no less than
a threshold, v.
(d) Answer parts (a) and (b) above as if only closed cells are considered (with the mini-
mum count threshold, v).
4.4 Suppose that a base cuboid has three dimensions, A, B, C, with the following number
of cells: |A| = 1, 000, 000, |B| = 100, and |C| = 1000. Suppose that each dimension is
evenly partitioned into 10 portions for chunking.
(a) Assuming each dimension has only one level, draw the complete lattice of the cube.
(b) If each cube cell stores one measure with 4 bytes, what is the total size of the
computed cube if the cube is dense?
(c) State the order for computing the chunks in the cube that requires the least amount
of space, and compute the total amount of main memory space required for com-
puting the 2-D planes.
4.5 Often, the aggregate measure value of many cells in a large data cuboid is zero, resulting
in a huge, yet sparse, multidimensional matrix.
Exercises 221
(a) Design an implementation method that can elegantly overcome this sparse matrix
problem. Note that you need to explain your data structures in detail and discuss the
space needed, as well as how to retrieve data from your structures.
(b) Modify your design in (a) to handle incremental data updates. Give the reasoning
behind your new design.
4.6 When computing a cube of high dimensionality, we encounter the inherent curse of
dimensionality problem: there exists a huge number of subsets of combinations of
dimensions.
(a) Suppose that there are only two base cells, {(a
1
, a
2
, a
3
, , a
100
), (a
1
, a
2
, b
3
, ,
b
100
)}, in a 100-dimensional base cuboid. Compute the number of nonempty aggre-
gate cells. Comment on the storage space and time required to compute these cells.
(b) Suppose we are to compute an iceberg cube from the above. If the minimum support
count in the iceberg condition is two, how many aggregate cells will there be in the
iceberg cube? Show the cells.
(c) Introducing iceberg cubes will lessen the burden of computing trivial aggregate cells
in a data cube. However, even with iceberg cubes, we could still end up having to
compute a large number of trivial uninteresting cells (i.e., with small counts). Sup-
pose that a database has 20 tuples that map to (or cover) the two following base cells
in a100-dimensional base cuboid, each witha cell count of 10: {(a
1
, a
2
, a
3
, , a
100
) :
10, (a
1
, a
2
, b
3
, , b
100
) : 10}.
i. Let the minimum support be 10. How many distinct aggregate cells will there
be like the following: {(a
1
, a
2
, a
3
, a
4
, , a
99
, ∗) : 10, , (a
1
, a
2
, ∗, a
4
, , a
99
,
a
100
) : 10, , (a
1
, a
2
, a
3
, ∗, , ∗, ∗) : 10}?
ii. If we ignore all the aggregate cells that can be obtained by replacing some con-
stants with ∗’s while keeping the same measure value, how many distinct cells
are left? What are the cells?
4.7 Propose an algorithm that computes closed iceberg cubes efficiently.
4.8 Suppose that we would like to compute an iceberg cube for the dimensions, A, B, C, D,
where we wish to materialize all cells that satisfy a minimum support count of at least
v, and where cardinality(A) <cardinality(B) <cardinality(C) <cardinality(D). Show the
BUC processing tree (which shows the order in which the BUC algorithm explores the
lattice of a data cube, starting from all) for the construction of the above iceberg cube.
4.9 Discuss how you might extend the Star-Cubing algorithm to compute iceberg cubes
where the iceberg condition tests for an avg that is no bigger than some value, v.
4.10 A flight data warehouse for a travel agent consists of six dimensions: traveler, depar-
ture (city), departure
time, arrival, arrival time, and flight; and two measures: count, and
avg
fare, where avg fare stores the concrete fare at the lowest level but average fare at
other levels.
(a) Suppose the cube is fully materialized. Starting with the base cuboid [traveller,
departure, departure
time, arrival, arrival time, flight], what specific OLAP operations
222 Chapter 4 Data Cube Computation and Data Generalization
(e.g., roll-up flight to airline) should one perform in order to list the average fare per
month for each business traveler who flies American Airlines (AA) from L.A. in the
year 2004?
(b) Suppose we want to compute a data cube where the condition is that the minimum
number of records is 10 and the average fare is over $500. Outline an efficient cube
computation method (based on common sense about flight data distribution).
4.11 (Implementation project) There are four typical data cube computation methods:
MultiWay [ZDN97], BUC [BR99], H-cubing [HPDW01], and Star-Cubing [XHLW03].
(a) Implement any one of these cube computation algorithms and describe your
implementation, experimentation, and performance. Find another student who has
implemented a different algorithm on the same platform (e.g., C++ on Linux) and
compare your algorithm performance with his/hers.
Input:
i. An n-dimensional basecuboid table (for n < 20), which is essentially arelational
table with n attributes
ii. An iceberg condition: count (C) ≥ k where k is a positive integer as a parameter
Output:
i. The set of computed cuboids that satisfy the iceberg condition, in the order of
your output generation
ii. Summary of the set of cuboids in the form of “cuboid ID: the number of
nonempty cells”, sorted in alphabetical order of cuboids, e.g., A:155, AB: 120,
ABC: 22, ABCD: 4, ABCE: 6, ABD: 36, where the number after “:” represents the
number of nonempty cells. (this is used to quickly check the correctness of your
results)
(b) Based on your implementation, discuss the following:
i. What challenging computation problems are encountered as the number of
dimensions grows large?
ii. How can iceberg cubing solve the problems of part (a) for some data sets (and
characterize such data sets)?
iii. Give one simple example to show that sometimes iceberg cubes cannot provide
a good solution.
(c) Instead of computing a data cube of high dimensionality, we may choose to mate-
rialize the cuboids that have only a small number of dimension combinations. For
example, for a 30-dimensional data cube, we may only compute the 5-dimensional
cuboids for every possible 5-dimensional combination. The resulting cuboids form
a shell cube. Discuss how easy or hard it is to modify your cube computation
algorithm to facilitate such computation.
4.12 Consider the following multifeature cube query: Grouping by all subsets of {item, region,
month}, find the minimum shelf life in 2004 for each group and the fraction of the total
sales due to tuples whose price is less than $100 and whose shelf life is between 1.25 and
1.5 of the minimum shelf life.
Bibliographic Notes 223
(a) Draw the multifeature cube graph for the query.
(b) Express the query in extended SQL.
(c) Is this a distributive multifeature cube? Why or why not?
4.13 For class characterization, what are the major differences between a data cube–based
implementation and a relational implementation such as attribute-oriented induction?
Discuss which method is most efficient and under what conditions this is so.
4.14 Suppose that the following table is derived by attribute-oriented induction.
class birth place count
USA 180
Programmer
others 120
USA 20
DBA
others 80
(a) Transform the table into a crosstab showing the associated t-weights and d-weights.
(b) Map the class Programmer into a (bidirectional) quantitative descriptive rule, for
example,
∀X, Programmer(X) ⇔ (birth place(X) = “USA” ∧ )
[t : x%,d : y%] θ ( )[t : w%,d : z%].
4.15 Discuss why relevance analysis is beneficial and how it can be performed and integrated
into the characterization process. Compare the result of two induction methods: (1) with
relevance analysis and (2) without relevance analysis.
4.16 Given a generalized relation, R, derived from a database, DB, suppose that a set, DB,
of tuples needs to be deleted from DB. Outline an incremental updating procedure for
applying the necessary deletions to R.
4.17 Outline a data cube–based incremental algorithm for mining class comparisons.
Bibliographic Notes
Gray, Chauduri, Bosworth, et al. [GCB
+
97] proposed the data cube as a relational
aggregation operator generalizing group-by, crosstabs, and subtotals. Harinarayan,
Rajaraman, and Ullman [HRU96] proposed a greedy algorithm for the partial mate-
rialization of cuboids in the computation of a data cube. Sarawagi and Stonebraker
[SS94] developed a chunk-based computation technique for the efficient organization
of large multidimensional arrays. Agarwal, Agrawal, Deshpande, et al. [AAD
+
96] pro-
posed several methods for the efficient computation of multidimensional aggregates
for ROLAP servers. The chunk-based MultiWay array aggregation method for data
224 Chapter 4 Data Cube Computation and Data Generalization
cube computation in MOLAP was proposed in Zhao, Deshpande, and Naughton
[ZDN97]. Ross and Srivastava [RS97] developed a method for computing sparse
data cubes. Iceberg queries were first described in Fang, Shivakumar, Garcia-Molina,
et al. [FSGM
+
98]. BUC, a scalable method that computes iceberg cubes from the
apex cuboid, downward, was introduced by Beyer and Ramakrishnan [BR99]. Han,
Pei, Dong, and Wang [HPDW01] introduced an H-cubing method for computing
iceberg cubes with complex measures using an H-tree structure. The Star-cubing
method for computing iceberg cubes with a dynamic star-tree structure was intro-
duced by Xin, Han, Li, and Wah [XHLW03]. MMCubing, an efficient iceberg cube
computation method that factorizes the lattice space, was developed by Shao, Han,
and Xin [SHX04]. The shell-fragment-based minimal cubing approach for efficient
high-dimensional OLAP introduced in this chapter was proposed by Li, Han, and
Gonzalez [LHG04].
Aside from computing iceberg cubes, another way to reduce data cube computation
is to materialize condensed, dwarf, or quotient cubes, which are variants of closed cubes.
Wang, Feng, Lu, and Yu proposed computing a reduced data cube, called a condensed
cube [WLFY02]. Sismanis, Deligiannakis, Roussopoulos, and Kotids proposed comput-
ing a compressed data cube, called a dwarf cube. Lakshmanan, Pei, and Han proposed
a quotient cube structure to summarize the semantics of a data cube [LPH02], which
was further extended to a qc-tree structure by Lakshmanan, Pei, and Zhao [LPZ03]. Xin,
Han, Shao, and Liu [Xin+06] developed C-Cubing (i.e., Closed-Cubing), an aggregation-
based approach that performs efficient closed-cube computation using a new algebraic
measure called closedness.
There are also various studies on the computation of compressed data cubes by app-
roximation, such as quasi-cubes by Barbara and Sullivan [BS97a], wavelet cubes by Vit-
ter, Wang, and Iyer [VWI98], compressed cubes for query approximation on continuous
dimensions by Shanmugasundaram, Fayyad, and Bradley [SFB99], and using log-linear
models to compress data cubes by Barbara and Wu [BW00]. Computation of stream
data “cubes” for multidimensional regression analysis has been studied by Chen, Dong,
Han, et al. [CDH
+
02].
For works regarding the selection of materialized cuboids for efficient OLAP
query processing, see Chaudhuri and Dayal [CD97], Harinarayan, Rajaraman, and
Ullman [HRU96], Sristava, Dar, Jagadish, and Levy [SDJL96], Gupta [Gup97], Baralis,
Paraboschi, and Teniente [BPT97], and Shukla, Deshpande, and Naughton [SDN98].
Methods for cube size estimation can be found in Deshpande, Naughton, Ramasamy,
et al. [DNR
+
97], Ross and Srivastava [RS97], and Beyer and Ramakrishnan [BR99].
Agrawal, Gupta, and Sarawagi [AGS97] proposed operations for modeling multidimen-
sional databases.
The discovery-driven exploration of OLAP data cubes was proposed by Sarawagi,
Agrawal, and Megiddo [SAM98]. Further studies on the integration of OLAP with data
mining capabilities include the proposal of DIFF and RELAX operators for intelligent
exploration of multidimensional OLAP data by Sarawagi and Sathe [SS00, SS01]. The
construction of multifeature data cubes is described in Ross, Srivastava, and Chatzianto-
niou [RSC98]. Methods for answering queries quickly by on-line aggregation are
Bibliographic Notes 225
described in Hellerstein, Haas, and Wang [HHW97] and Hellerstein, Avnur, Chou,
et al. [HAC
+
99]. A cube-gradient analysis problem, called cubegrade, was first proposed
by Imielinski, Khachiyan, and Abdulghani [IKA02]. An efficient method for multidi-
mensional constrained gradient analysis in data cubes was studied by Dong, Han, Lam,
et al. [DHL
+
01].
Generalization and concept description methods have been studied in the statistics
literature long before the onset of computers. Good summaries of statistical descriptive
data mining methods include Cleveland [Cle93] and Devore [Dev95]. Generalization-
based induction techniques, such as learning from examples, were proposed and
studied in the machine learning literature before data mining became active. A theory
and methodology of inductive learning was proposed by Michalski [Mic83]. The
learning-from-examples method was proposed by Michalski [Mic83]. Version space was
proposed by Mitchell [Mit77, Mit82]. The method of factoring the version space was
presented by Subramanian and Feigenbaum [SF86b]. Overviews of machine learning
techniques can be found in Dietterich and Michalski [DM83], Michalski, Carbonell, and
Mitchell [MCM86], and Mitchell [Mit97].
Database-oriented methods for concept description explore scalable and efficient
techniques for describing large sets of data. The attribute-oriented induction method
described in this chapter was first proposed by Cai, Cercone, and Han [CCH91] and
further extended by Han, Cai, and Cercone [HCC93], Han and Fu [HF96], Carter and
Hamilton [CH98], and Han, Nishio, Kawano, and Wang [HNKW98].
5
Mining Frequent Patterns,
Associations, and Correlations
Frequent patterns are patterns (such as itemsets, subsequences, or substructures) that appear in
a data set frequently. For example, a set of items, such as milk and bread, that appear
frequently together in a transaction data set is a frequent itemset. A subsequence, such as
buying first a PC, then a digital camera, and then a memory card, if it occurs frequently
in a shopping history database, is a (frequent) sequential pattern. A substructure can refer
to different structural forms, such as subgraphs, subtrees, or sublattices, which may be
combined with itemsets or subsequences. If a substructure occurs frequently, it is called
a (frequent) structured pattern. Finding such frequent patterns plays an essential role in
mining associations, correlations, and many other interesting relationships among data.
Moreover, it helps in data classification, clustering, and other data mining tasks as well.
Thus, frequent pattern mining has become an important data mining task and a focused
theme in data mining research.
In this chapter, we introduce the concepts of frequent patterns, associations, and cor-
relations, and study how they can be mined efficiently. The topic of frequent pattern
mining is indeed rich. This chapter is dedicated to methods of frequent itemset mining.
We delve into the following questions: How can we find frequent itemsets from large
amounts of data, where the data are either transactional or relational? How can we mine
association rules in multilevel and multidimensional space? Which association rules are
the most interesting? How can we help or guide the mining procedure to discover inter-
esting associations or correlations? How can we take advantage of user preferences or
constraints to speed up the mining process? The techniques learned in this chapter may
also be extended for more advanced forms of frequent pattern mining, such as from
sequential and structured data sets, as we will study in later chapters.
5.1
Basic Concepts and a Road Map
Frequent pattern mining searches for recurring relationships in a given data set. This
section introduces the basic concepts of frequent pattern mining for the discovery of
interesting associations and correlations between itemsets in transactional and relational
227
228 Chapter 5 Mining Frequent Patterns, Associations, and Correlations
databases. We begin in Section 5.1.1 by presenting an example of market basket analysis,
the earliest form of frequent pattern mining for association rules. The basic concepts
of mining frequent patterns and associations are given in Section 5.1.2. Section 5.1.3
presents a road map to the different kinds of frequent patterns, association rules, and
correlation rules that can be mined.
5.1.1 Market Basket Analysis: A Motivating Example
Frequent itemset mining leads to the discovery of associations and correlations among
items in large transactional or relational data sets. With massive amounts of data
continuously being collected and stored, many industries are becoming interested in
mining such patterns from their databases. The discovery of interesting correlation
relationships among huge amounts of business transaction records can help in many
business decision-making processes, such as catalog design, cross-marketing, and cus-
tomer shopping behavior analysis.
A typical example of frequent itemset mining is market basket analysis. This process
analyzes customer buying habits by finding associations between the different items that
customers place in their “shopping baskets” (Figure 5.1). The discovery of such associa-
tions can help retailers develop marketing strategies by gaining insight into which items
are frequently purchased together by customers. For instance, if customers are buying
Which items are frequently
purchased together by my customers?
milk
cereal
bread
milk
bread
butter
milk bread
sugar eggs
Customer 1
Market Analyst
Customer 2
sugar
eggs
Customer n
Customer 3
Shopping Baskets
Figure 5.1 Market basket analysis.
5.1 Basic Concepts and a Road Map 229
milk, how likely are they to also buy bread (and what kind of bread) on the same trip
to the supermarket? Such information can lead to increased sales by helping retailers do
selective marketing and plan their shelf space.
Let’s look at an example of how market basket analysis can be useful.
Example 5.1
Market basket analysis. Suppose, as manager of an AllElectronics branch, you would
like to learn more about the buying habits of your customers. Specifically, you wonder,
“Which groups or sets of items are customers likely to purchase on a given trip to the store?”
To answer your question, market basket analysis may be performed on the retail data of
customer transactions at your store. You can then use the results to plan marketing or
advertising strategies, or in the design of a new catalog. For instance, market basket anal-
ysis may help you design different store layouts. In one strategy, items that are frequently
purchased together can be placed in proximity in order to further encourage the sale
of such items together. If customers who purchase computers also tend to buy antivirus
software at the same time, then placing the hardware display close to the software display
may help increase the sales of both items. In an alternative strategy, placing hardware and
software at opposite ends of the store may entice customers who purchase such items to
pick up other items along the way. For instance, after deciding on an expensive computer,
a customer may observe security systems for sale while heading toward the software dis-
play to purchase antivirus software and may decide to purchase a home security system
as well. Market basket analysis can also help retailers plan which items to put on sale
at reduced prices. If customers tend to purchase computers and printers together, then
having a sale on printers may encourage the sale of printers as well as computers.
If we think of the universe as the set of items available at the store, then each item
has a Boolean variable representing the presence or absence of that item. Each basket
can then be represented by a Boolean vector of values assigned to these variables.
The Boolean vectors can be analyzed for buying patterns that reflect items that are
frequently associated or purchased together. These patterns can be represented in the
form of association rules. For example, the information that customers who purchase
computers also tend to buy antivirus software at the same time is represented in
Association Rule (5.1) below:
computer ⇒ antivirus
software [support = 2%,confidence = 60%] (5.1)
Rule support and confidence are two measures of rule interestingness. They respec-
tively reflect the usefulness and certainty of discovered rules. A support of 2% for Associ-
ation Rule (5.1) means that 2% of all the transactions under analysis show that computer
and antivirus software are purchased together. A confidence of 60% means that 60% of
the customers who purchased a computer also bought the software. Typically, associa-
tion rules are considered interesting if they satisfy both a minimum support threshold
and a minimum confidence threshold. Such thresholds can be set by users or domain
experts. Additional analysis can be performed to uncover interesting statistical correla-
tions between associated items.
230 Chapter 5 Mining Frequent Patterns, Associations, and Correlations
5.1.2 Frequent Itemsets, Closed Itemsets, and Association Rules
Let = {I
1
, I
2
, , I
m
}be a set of items. Let D, the task-relevant data, be a set of database
transactions where each transaction T is a set of items such that T ⊆ . Each transaction
is associated with an identifier, called TID. Let A be a set of items. A transaction T is
said to contain A if and only if A ⊆ T . An association rule is an implication of the form
A ⇒B, where A ⊂ , B ⊂ , and A∩B = φ. The rule A ⇒B holds in the transaction set D
with support s, where s is the percentage of transactions in D that contain A∪B (i.e., the
union of sets A and B, or say, both A and B). This is taken to be the probability, P(A∪B).
1
The rule A ⇒ B has confidence c in the transaction set D, where c is the percentage of
transactions in D containing A that also contain B. This is taken to be the conditional
probability, P(B|A). That is,
support(A⇒B) = P(A ∪B) (5.2)
confidence(A⇒B) = P(B|A). (5.3)
Rules that satisfy both a minimum support threshold (min
sup) and a minimum confi-
dence threshold (min
conf) are called strong. By convention, we write support and con-
fidence values so as to occur between 0% and 100%, rather than 0 to 1.0.
A set of items is referred to as an itemset.
2
An itemset that contains k items is a
k-itemset. The set {computer, antivirus
software} is a 2-itemset. The occurrence
frequency of an itemset is the number of transactions that contain the itemset. This is
also known, simply, as the frequency, support count, or count of the itemset. Note that
the itemset support defined in Equation (5.2) is sometimes referred to as relative support,
whereas the occurrence frequency is called the absolute support. If the relative support
of an itemset I satisfies a prespecified minimum support threshold (i.e., the absolute
support of I satisfies the corresponding minimum support count threshold), then I is a
frequent itemset.
3
The set of frequent k-itemsets is commonly denoted by L
k
.
4
From Equation (5.3), we have
confidence(A⇒B) = P(B|A) =
support(A ∪B)
support(A)
=
support count(A∪B)
support count(A)
. (5.4)
Equation (5.4) shows that the confidence of rule A⇒B can be easily derived from the
support counts of A and A∪B. That is, once the support counts of A, B, and A ∪B are
1
Notice that the notation P(A ∪B) indicates the probability that a transaction contains the union of set
A and set B (i.e., it contains every item in A and in B). This should not be confused with P(A or B),
which indicates the probability that a transaction contains either A or B.
2
In the data mining research literature, “itemset” is more commonly used than “item set.”
3
In early work, itemsets satisfying minimum support were referred to as large. This term, however, is
somewhat confusing as it has connotations to the number of items in an itemset rather than the fre-
quency of occurrence of the set. Hence, we use the more recent term frequent.
4
Although the term frequent is preferred over large, for historical reasons frequent k-itemsets are still
denoted as L
k
.