Báo cáo sinh học: "Evaluating antibiotics for use in medicine using a poloxamer biofilm model" potx
Bạn đang xem bản rút gọn của tài liệu. Xem và tải ngay bản đầy đủ của tài liệu tại đây (358.38 KB, 10 trang )
BioMed Central
Page 1 of 10
(page number not for citation purposes)
Annals of Clinical Microbiology and
Antimicrobials
Open Access
Research
Evaluating antibiotics for use in medicine using a poloxamer biofilm
model
Abi L Clutterbuck
1,3
, Christine A Cochrane
2,3
, Jayne Dolman
3
and
Steven L Percival*
3
Address:
1
University of Wales, Institute of Rural Studies, Aberystwyth, Ceredigion, Wales, SY23 3AL, UK,
2
University of Liverpool, Department of
Veterinary Clinical Science, Division of Equine Studies, Leahurst, Neston, South Wirral, CH64 7TE, UK and
3
ConvaTec Wound Therapeutics™,
GDC, First Avenue, Deeside Industrial Park, Deeside, CH5 2NU, UK
Email: Abi L Clutterbuck - ; Christine A Cochrane - ;
Jayne Dolman - ; Steven L Percival* -
* Corresponding author
Abstract
Background: Wound infections, due to biofilms, are a constant problem because of their
recalcitrant nature towards antibiotics. Appropriate antibiotic selection for the treatment of these
biofilm infections is important. The traditional in vitro disc diffusion method for antibiotic selection
uses bacterial cultures grown on agar plates. However, the form of bacterial growth on agar is not
representative of how bacteria grow in wounds and other tissue sites as here bacteria grow
naturally in a biofilm. The aim of this research was to test a more appropriate method for testing
antimicrobial efficacy on biofilms and compare with the standard methods used for antibiotic
sensitivity testing.
Methods: Outer Membrane Protein analysis was performed on E.coli, Staphylococcus aureus,
Pseudomonas aeruginosa, Proteus mirabilis and Acinetobacter juni when grown on Mueller Hinton
agar ('quasi-biofilm state') and 30% Poloxamer hydrogel ('true- biofilm state). Susceptibility to
antibiotics on 28 clinical isolates was determined using the modified Kirby Bauer disc diffusion
method, on agar and 30% Poloxamer.
Results: Similar outer membrane proteins [OMPs] were identified in bacteria grown in a biofilm
state and on a 30% poloxamer hydrogel, which were very different to the OMPs identified in
bacteria grown on Mueller-Hinton agar and broth. There was a significant difference between the
means of the clearance zones around the antibiotic discs on standard agar and poloxamer gels [P
< 0.05]. The zones of clearance were generally smaller for poloxamer-grown bacteria than those
grown on standard agar. Diffusion distances of various antibiotics through agar and 30% poloxamer
showed no significant difference [P > 0.05].
Conclusion: The findings of this experiment suggest that poloxamer gel could be used as an
appropriate medium on which to conduct biofilm antibiotic susceptibility tests as it enables bacteria
to be grown in a state representative of the infected surface from which the culture was taken.
Published: 15 February 2007
Annals of Clinical Microbiology and Antimicrobials 2007, 6:2 doi:10.1186/1476-0711-6-2
Received: 13 December 2006
Accepted: 15 February 2007
This article is available from: />© 2007 Clutterbuck et al; licensee BioMed Central Ltd.
This is an Open Access article distributed under the terms of the Creative Commons Attribution License ( />),
which permits unrestricted use, distribution, and reproduction in any medium, provided the original work is properly cited.
Annals of Clinical Microbiology and Antimicrobials 2007, 6:2 />Page 2 of 10
(page number not for citation purposes)
Background
In natural environments, bacteria frequently grow in
structured communities called biofilms. Biofilms are
defined as bacterial populations adherent to each other
and/or surfaces encased within a three dimensional
matrix of extracellular polymeric substances [EPS] [1].
Biofilms can constitute a major problem to human health
with many clinicians citing them as the cause of a variety
of chronic bacterial infections [2]. Bacterial cells are pro-
tected by growing in a biofilm and although antibodies
produced in response to biofilm antigens may eliminate
the planktonic cells shed from the biofilm, they cannot
reach the sessile cells within the biofilm and may damage
surrounding tissue instead [3]. Similarly, antibiotic ther-
apy often fails to eradicate biofilms, suppressing only the
symptoms of infection by killing the planktonic cells [4].
Consequently, infections in animals and humans may
persist for years with recurring symptoms after each
period of antibiotic treatment until the colonised surface
is surgically removed.
Whether in humans or animals, the antibiotic resistance
of biofilms has a significant impact on health including
increased morbidity and mortality [5]. The prolonged
treatment of diseases and infections causes increased
health costs and serious implications for both human and
animal welfare. Currently, antibiotic selection is based on
an antibiotic sensitivity test using the Kirby-Bauer disc dif-
fusion method, developed in 1966 by Bauer and others
[6]. Other methods have since been developed but the
disc diffusion technique was adopted by the National
Committee for Clinical Laboratory Standards [NCCLS] in
1975 and is still used today as the basis for disc diffusion
standards [7].
Although the disc diffusion method of antimicrobial sen-
sitivity testing has been described as a reliable, easy and
inexpensive method of evaluating antimicrobial efficacy
[8], recent research has indicated that the results from the
disc diffusion test are open to interpretive error and that it
is only useful as a preliminary screen for susceptibility
testing [9]. Costerton et al. [3] stated that culturing bacte-
ria for use in the susceptibility test transforms a biofilm
forming pathogen into a planktonic lab-adapted strain.
Thus, the problem with the standard antibiotic suscepti-
bility test is that bacterial growth on agar is not represent-
ative of how bacteria grow naturally in tissue sites.
Consequently, the current method of antibiotic selection
assesses bacterial sensitivity in an unrealistic state.
In this present study poloxamer F127, a di-block copoly-
mer of polyoxyethylene and polyoxypropylene, was used
as a medium on which bacteria could be grown as a bio-
film phenotype and express the characteristics more
appropriate to the 'real world'. An initial experiment was
undertaken to determine the molecular weight of the
outer membrane proteins of P. aeruginosa grown on stand-
ard agar, poloxamer gel and in a biofilm on a microtitre
plate to confirm whether bacteria express a biofilm phe-
notype on poloxamer as was found by Gilbert et al. [10].
The second experiment then involved antibiotic sensitiv-
ity testing on standard agar and poloxamer gel to compare
results for a range of bacterial species.
In this present study two approaches were used to study
the effectiveness of antimicrobial dressings on microor-
ganisms. Firstly a wide range of aerobic bacteria and yeasts
were tested using a standard agar assay [Kirby Bauer disc
diffusion method [6] and a second method used a
poloxamer technique to encourage the same strains of
microorganisms to exhibit a more clinically relevant bio-
film phenotype. Gilbert and others determined that P. aer-
uginosa cells grown on poloxamer hydrogel ('true' biofilm
form) express outer membrane proteins between 78 and
87 kDa, which are not evident in cells grown on standard
nutrient agar ('planktonic/quasi-sessile state') [10]. Con-
sequently poloxamer gel cultures mimic many of the
properties of biofilm-grown Pseudomonas aeruginosa [10].
This indicates that there is a phenotypic difference
between P. aeruginosa cells grown on poloxamer hydrogel
and nutrient agar, with only poloxamer grown cells
resembling biofilm cells. It was found from Wirtanen's
study [11] that bacteria which are grown in poloxamer
have biofilm properties and associated enhanced biocide
resistance [11]. Gilbert and colleagues suggested that bac-
teria grown in poloxamer hydrogels could be exposed to
biocides to provide a reproducible method for testing the
antimicrobial efficacy of biocides against biofilm bacteria
[10]. Evidence of biofilm growth in the poloxamer model
was also confirmed using confocal laser microscopy [12].
Sincock and other found that using microscopy, bacteria
within poloxamer hydrogels grew to high densities,
formed microcolonies and exhibited a biofilm pheno-
type. The poloxamer hydrogels have also been used to
study biofilms of Streptococcus mutans in plaque [13], to
look at homoserine lactones and biocide efficacy in bio-
films [14] and also to study biofilms and coaggregation in
the freshwater bacteria Blastomonas natataria and Micrococ-
cus luteus [15].
In the current study we have utilised and adapted the sci-
ence of Wirtanen's biofilm model [11] to provide a more
clinically relevant method to test the effectiveness of anti-
microbial dressings on biofilm microorganisms. The aim
of this research was to test a more clinically relevant bio-
film model for assessing the efficacy of antimicrobial
agents against microorganisms of clinical and veterinary
importance.
Annals of Clinical Microbiology and Antimicrobials 2007, 6:2 />Page 3 of 10
(page number not for citation purposes)
Methods
Source of bacterial isolates and identification
All isolates used in this study were isolated from routine
clinical specimens submitted to the University of Liver-
pool Veterinary Teaching Hospital, Leahurst, Wirral, UK.
All isolates were identified morphologically and bio-
chemically by standard laboratory procedure.
Outer membrane protein assay
Chemicals
Mueller-Hinton broth (MHB – Laboratory M, Bury, UK)
and Mueller-Hinton agar (MHA – Laboratory M, Bury,
UK) were used throughout. Poloxamer F127 was obtained
from Univar (Essex, UK). All other chemicals and reagents
were obtained from BDH (Poole, UK), Bio Rad (Hemel
Hempstead, UK) or Sigma (Poole, UK).
Poloxamer hydrogels (biofilm phenotype induction)
Poloxamer F127 was incorporated into MHB at a concen-
tration of up to 30% which was then refrigerated over-
night (4°C). The dissolved poloxamer was then
autoclaved and returned to the fridge. The liquefied
poloxamer was then poured into Petri dishes in 20 ml vol-
umes. Dishes were incubated overnight at 35°C before
inoculation.
Biofilm cultures
Biofilm cultures of all bacteria were prepared by inoculat-
ing a 96 well microtitre plate (Nunclon
®
, Scientific Labo-
ratory Supplies, Manchester, UK) with MHB containing a
mid-log phase culture. A Nunc-TSP pin-lid (SLS, Manches-
ter, UK) with 96 pegs was then placed onto the plastic
microtitre plate so that the pins inserted into each well of
the plate, which provided a surface for bacterial attach-
ment. The wells, containing MHB, were inoculated with
approximately 10
8
of the test bacteria (based upon McFar-
lane standards) and placed onto a rocker at 37°C. The
pegs were colonized then for 24 h. After 24 hours the bio-
film was determined by breaking several pegs from vari-
ous points on the lid. The removed pegs were placed in
microfuge tubes, washed in sterile saline (to remove
planktonic cells) and biofilm cells were then harvested by
sonicating in an ultrasonic water bath for 5 minutes at an
amplitude of 50 Hz.
Preparation and analysis of cell envelopes
The preparation and analysis of cell envelopes were con-
ducted according to the methods of Gilbert et al., [10]. In
brief, cell suspensions harvested from MH broth cultures,
poloxamer hydrogels and biofilm cultures were centri-
fuged at 10 000 g for 10 minutes at 15°C (Biofuge 13R,
Heraus Sepatech, Fisher Scientific, Loughborough, UK).
The resultant pellets were resuspended in 500 μl sterile
physiological saline and placed in 1.5 ml Eppendorf tubes
and sonicated in the water bath for 1 minute at 4°C. N-
laurylsarcosine (10% w/v) was added to give a final con-
centration of 2% w/v. The samples were resonicated for 30
seconds and centrifuged (10 000 g, 1 hour) at 4°C. Pellets
were resuspended in Laemmli sample buffer (Bio Rad,
Hemel Hempstead, UK) and mercaptoethanol, 5% w/v,
and heated for 5 minutes at 100°C. Sodium dodecylsul-
fate polyacrylamide gel electrophoresis (SDS-PAGE) was
conducted with a 15% gel and molecular weight stand-
ards (2.5–200 kDa, Invitrogen, Paisley, UK), using sample
volumes containing 10 μg protein. Gels were then stained
with Coomassie Brilliant Blue G250 (BDH, Poole, UK) for
2 hours and then destained for 45 minutes. Molecular
weights were analysed using the Gene Snap computer
package (SynGene Bio-Imaging System, Cambridge, UK).
Antimicrobial suceptibility test
Organisms
Twenty-eight bacterial organisms were evaluated in this
study and included; Acinetobacter sp, Actinobacillus equuli,
Aeromonas hydrophilia, Bacillus sp, Bordetella bronchiseptica,
Corynebacterium sp., Enterobacter cloacae, Enterococcus faec-
alis, Escherichia coli, Klebsiella sp, Listeria sp, Micrococcus sp,
Morganella morganii, Nocardia asteroides, Proteus sp, Pseu-
domonas aeruginosa, Rhodococcus equi and Staphylococcus sp.
Also, three standard bacterial strains were used, namely:
Escherichia coli NCIMB 12210, Pseudomonas aeruginosa
NCIMB 12469 and Staphylococcus aureus NCIMB 12702.
Antibiotic suceptibility testing
Susceptibilities to various antibiotics were determined by
modified Kirby-Bauer disk diffusion methods according
to the Clinical Laboratory Standards Institute [16] on
both agar and 30% Poloxamer hydrogels. In brief, colo-
nies from an overnight culture of a bacterial isolate were
suspended in sterile physiological saline until the density
of the test suspension matched the turbidity standard
which was the equivalent of a bacterial concentration of
3.0 × 10
8
/ml (McFarland Standard, BioMérieux, Marcy
l'Étoile, France). MH agar and poloxamer gel plates were
inoculated with 1 ml of bacterial suspension. The suspen-
sion was spread over the surface of the agar plates using a
sterile 1 ml syringe and swilled around the surface of the
poloxamer gel plates to ensure complete coverage. Plates
were left for 5 minutes before excess fluid was removed
using a sterile pipette. Sterile forceps were used to place
the antimicrobial discs on the plates. The antimicrobial
discs were then placed on both a MH agar and poloxamer
gel plate, in duplicate for each bacteria. Plates were
repeated in duplicate for each bacterial organism. Discs
were evenly spaced approximately 15 mm from the edge
of the plate. Each disc was gently pressed to ensure even
contact with the surface of the medium. After overnight
incubation at 35°C, plates were removed from the incu-
bator. The diameter of the zone of clearance around each
antimicrobial disc was measured with callipers, together
Annals of Clinical Microbiology and Antimicrobials 2007, 6:2 />Page 4 of 10
(page number not for citation purposes)
with additional light enhancement, and recorded in mil-
limetres. For discs with high efficacy for which the zone
could not be measured, Non- Measurable (NM) was
recorded. As the poloxamer gel formation is temperature
dependent (liquid below 15°C), and readily reversible,
whilst recording zones of inhibition the temperature of
the Petri dishes were kept at constant at 25°C.
The following antibiotic impregnated discs were used:
amoxicillin/clavulanic acid (30 μg), ampicillin/sulbactam
(20 μg and 30 μg), ciprofloxacin (5 μg), clindamycin (10
μg), erythromycin (15 μg and 30 μg), imipenem (10 μg),;
levofloxacin (5 μg), meropenem (10 μg), penicillin G (5
u); all from Oxoid (Oxoid Ltd; Basingstoke, Hampshire,
England).
Antibiotic diffusion investigation
This investigation was carried out in order to compare the
diffusion rates of different antibiotics through MH agar
and 30% Poloxamer gel (biofilm model). Different anti-
biotics with different molecular weights (MW) were cho-
sen for this study. These included Ciprofloxacin (5 μg –
MW 331.34), Doxycycline Hydrochloride (15 μg – MW
512.94), Gentamicin (15 μg – MW 653.21), Levofloxacin
(5 μg – MW 361.37) and Meropenem (10 μg – MW
356.37). In separate experiments an antibiotic disk was
placed in the centre of a Petri dish containing MHA or
30% poloxamer. Three 13 mm sterile filter paper disks
(Whatman, UK) were placed next to the antibiotic disks in
every Petri dish at various distances away from the antibi-
otic disk. The concept behind this is that over a 24 hour
period the known antibiotic will diffuse through the agar
or poloxamer gel and become impregnated into the filter
disks placed at known distances from the central antibi-
otic disk. The newly impregnated filter disks was then be
removed and their efficacy against a named organism, in
this case E.coli, would be investigated using a zone of inhi-
bition test (ZOI), according to NCCLS guidelines [16] on
agar. Where a zone of clearing was detected around the
newly impregnanted disc it would indicate that the antibi-
otic has diffused to that distance. This was repeated in
triplicate.
Results
Outer membrane protein test
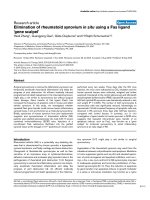
Comparison of the outer membrane proteins of P. aerugi-
nosa grown on poloxamer gel, Mueller-Hinton agar and
the pin lid of the plastic microtitre plate (biofilm state)
showed that the cells grown on poloxamer gel resembled
the biofilm phenotype. The biofilm and poloxamer grown
cells both expressed a protein at 87 kDa, a protein at 112
kDa and a protein at between 71–72 KDa which were not
present in the MH agar grown cells (Figure 1). There were
three proteins of similar weight around 57 kDa, 61 kDa
and 64 kDa that were found in the P. aeruginosa cells from
all three growth media. Also a 200 kDa protein was iden-
tified in the planktonic mode of growth and not in the
biofilm grown bacteria.
SDS-PAGE gels of Pseudomonas aeruginosa after overnight incubation at 35°CFigure 1
SDS-PAGE gels of Pseudomonas aeruginosa after overnight incubation at 35°C. Molecular weight standards are
shown in track 1. The following tracks 2, 3 and 4 reveal the proteins from the planktonic culture grown on Mueller Hinton
agar, the poloxamer hydrogels made from Mueller Hinton broth and the biofilm culture from the microtitre plate respectively.
Annals of Clinical Microbiology and Antimicrobials 2007, 6:2 />Page 5 of 10
(page number not for citation purposes)
For Staphylococcus aureus outer membrane proteins with
weights of 103–104 kDa and 42–43 kDa were identified
on 30% poloxomer. This corresponded to OMPs found
from Staphylococcus aureus grown in the biofilm state but
differed considerably from the OMPs identified in MH
agar or MH broth.
The OMPs with weights of between 102 and 104 kDa and
19 kDa were identified from Escherichia coli grown on
30% poloxamer. These OMPs corresponded with OMPs
found in E.coli growing in the biofilm state. As was the
case with Staphylococcus aureus these OMPs differed con-
siderably with the MH agar and MH broth grown bacteria.
For Proteus mirabilis OMPs at 289 and 205 kDa were iden-
tified when it was grown on 30% poloxamer. These were
not evident in the planktonic state.
With Acinetobacter juni OMPs at 265 kDa, between 113
kDa and 115 kDa and between 60 and 61 kDa were iden-
tified on cells grown on 30% poloxamer. These OMPs cor-
responded to those grown in the biofilm state only and as
above differed considerable from the planktonically
grown cells.
Antimicrobial resistance test
The results for the means of the zones of clearance around
the antibiotics for the Gram positive and Gram negative
bacteria on both MH agar and poloxamer gel are shown in
tables 1 and 2. Five bacteria (Corynebacterium pseudotuber-
culosis, Corynebacterium renale, Micrococcus sp, Staphyloco-
cus citreus and Staphylococcus hominis) were excluded from
analysis because the zones of clearance were measurable
on poloxamer gel but were too big to be measured on agar
with a number of antibiotics.
Amongst the 14 Gram negative bacterial species grown on
MHA plates, ciprofloxacin was the most effective antibi-
otic, whereas, in the equivalent poloxamer gel grown
organisms ciprofloxacin and meropenem were the most
effective antibiotics. Of the 12 Gram positive bacteria
tested, imipenem proved to be the most effective antibi-
otic against both the MH agar and poloxamer gel grown
organisms, however it was the most effective in more of
the organisms grown on poloxamer gel than those grown
on MH agar (91.7% verses 58.3% respectively).
Although the same antibiotics were most effective in both
the MH agar and poloxamer gel-grown Gram negative and
Gram positive bacterial groups, antibiotic susceptibilities
were often different between the two growth media. For
example the bacterium Nocardia asteroides was most sus-
ceptible to levofloxacin when grown on MH agar, with an
average 38.4 mm mean zone of clearance, however, when
grown on poloxamer gel imipenem was the most effective
antibiotic producing a 27.53 mm mean clearance zone.
As well as differences between the antibiotics for individ-
ual bacterial organisms, the efficacy of the same antibiotic
also differed between the two growth media. This was
most notable with the antibiotic penicillin G. Out of the
14 Gram negative organisms tested, penicillin G was the
least effective antibiotic on both MH agar and poloxamer
gel grown organisms (57.1 % and 64.3% respectively).
However, only one of the organisms grown on MH agar
displayed total resistance to penicillin G, in contrast to
nine of the poloxamer grown organisms. Similarly,
amongst the 12 Gram positive species, penicillin G was
the least effective in 50% of organisms on both MH agar
and poloxamer gel but whereas only one organism dis-
played resistance on MH agar, three organisms on
poloxamer gel were completely unaffected by penicillin
G. Therefore, whereas bacteria grown on MH agar often
displayed some zone of clearance around penicillin G,
poloxamer gel grown organisms often showed no clear-
ance zone at all. For example, penicillin G was the least
effective antibiotic against Bacillus cereus on both MH agar
and poloxamer gel whereas the antibiotic was completely
ineffective on the poloxamer gel grown culture, it pro-
duced an average 7.07 mm clearance zone on the MH agar
plate.
Aeromonas hydrophila had larger zones of ampicillin-sul-
bactam and amoxicillin-clavulanic acid on poloxamer
gels than MH agar. This was also true for Bacillus licheni-
formis when exposed to clindamycin. The significance of
this result is under investigation.
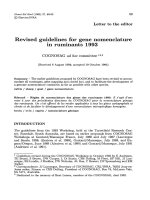
Antibiotic diffusion investigation
The average diffusion distances for each of the antibiotics
through each of the two media, poloxamer gel and agar
are shown in Figure 2. Clearly the diffusion rates through
agar and 30% poloxamer were not significantly different
(p < 0.05) for the antibiotics studied. In all cases the anti-
biotic had diffused a similar distance and shown to
inhibit the growth of E.coli on agar plates.
Discussion
The treatment of infections with topical or systemic anti-
biotics is becoming increasingly problematic due to the
existence of biofilms [17,18]. Antibiotic sensitivity testing
by traditional methods on agar are used to diagnose the
best antibiotic to treat an infection. However, the choice
and concentration of antibiotic are often unsuccessful at
clearing the infection [19]. This is due to the fact that bac-
teria growing in a biofilm state are very recalcitrant to anti-
biotic treatment.
Annals of Clinical Microbiology and Antimicrobials 2007, 6:2 />Page 6 of 10
(page number not for citation purposes)
Table 1: Mean [± standard error] zones of clearance (mm) around all the antibiotics for Gram negative bacteria [NM – Not measured
ANTIBIOTIC
BACTERIA Test Method
[mm]
Amoxycillin/
Clavulanic acid
Ampicillin/
Sulbactam
Ampicillin/
Sulbactam
Ciprofloxacin Clindamycin Erythromycin Erythromycin Imipenem Levofloxacin Meropenem Penicillin G
30 μg 20 μg 30 μg 5 μg 10 μg 15 μg 30 μg 10 μg 5 μg 10 μg 5 IU
Acinetobacter sp Agar 12.80 ± 1.47 15.33 ± 0.67 15.40 ± 0.81 28.27 ± 0.37 9.53 ± 1.27 15.33 ± 0.75 25.27 ± 0.24 33.67 ± 2.03 27.33 ± 0.94 26.53 ± 0.33 8.93 ± 0.07
Poloxamer 12.13 ± 0.18 13.07 ± 0.07 13.27 ± 0.18 17.00 ± 0.31 8.20 ± 0.00 9.73 ± 0.35 10.80 ± 0.00 18.80 ± 0.40 17.00 ± 0.00 18.27 ± 0.07 0.00 ± 0.00
Actinobacillus equuli Agar 25.87 ± 0.59 28.27 ± 0.37 29.40 ± 0.60 26.73 ± 0.27 23.40 ± 0.20 20.93 ± 0.59 25.20 ± 0.20 35.47 ± 0.18 27.80 ± 0.20 31.33 ± 0.77 14.87 ± 0.35
Poloxamer 22.40 ± 0.31 22.80 ± 0.40 23.67 ± 0.18 22.47 ± 0.24 11.27 ± 0.18 8.00 ± 0.12 11.33 ± 0.27 25.53 ± 0.18 23.13 ± 0.24 26.87 ± 0.13 18.20 ± 0.12
Aeromonas hydrophilia Agar 14.07 ± 0.27 0.00 ± 0.00 7.40 ± 0.00 38.60 ± 0.20 7.53 ± 0.13 21.13 ± 0.13 24.07 ± 1.01 17.40 ± 0.12 36.40 ± 0.00 21.53 ± 0.07 7.20 ± 0.00
Poloxamer 15.87 ± 0.24 7.73 ± 0.13 7.73 ± 0.18 27.80 ± 0.31 9.87 ± 0.13 15.53 ± 0.24 16.80 ± 0.20 16.47 ± 0.27 27.13 ± 0.07 18.00 ± 0.23 0.00 ± 0.00
Bordetella bronchiseptica Agar 31.80 ± 0.20 17.73 ± 0.07 23.40 ± 0.31 32.00 ± 0.31 9.27 ± 0.27 23.93 ± 0.87 26.20 ± 0.23 33.60 ± 0.12 31.87 ± 0.07 46.47 ± 0.24 9.73 ± 0.18
Poloxamer 22.67 ± 0.57 14.60 ± 0.20 16.67 ± 0.13 26.20 ± 0.53 8.67 ± 0.07 14.47 ± 0.29 15.87 ± 0.07 24.27 ± 0.55 25.67 ± 0.24 29.73 ± 0.07 0.00 ± 0.00
Enterobacter cloacae Agar 10.00 ± 0.12 17.80 ± 0.00 19.27 ± 0.13 32.53 ± 0.29 16.33 ± 0.41 11.40 ± 0.35 11.67 ± 0.07 21.27 ± 0.13 27.20 ± 0.12 33.47 ± 0.71 7.40 ± 0.00
Poloxamer 9.73 ± 0.18 11.00 ± 0.20 12.20 ± 0.12 21.73 ± 0.13 9.53 ± 0.18 9.40 ± 0.20 10.40 ± 0.12 18.53 ± 0.35 20.40 ± 0.23 22.33 ± 0.13 0.00 ± 0.00
Escherichia coli 0117 Agar 22.67 ± 0.94 23.40 ± 0.23 24.40 ± 0.42 35.13 ± 0.47 28.20 ± 0.23 27.40 ± 1.11 27.67 ± 0.13 28.87 ± 0.24 36.00 ± 0.42 33.60 ± 0.42 10.27 ± 0.44
Poloxamer 14.93 ± 0.13 15.40 ± 0.31 15.80 ± 0.12 24.07 ± 0.07 9.20 ± 0.23 10.13 ± 0.18 11.87 ± 0.13 18.87 ± 0.29 23.47 ± 0.81 19.40 ± 0.35 0.73 ± 0.73
Escherichia coli 08 Agar 25.00 ± 0.00 22.27 ± 0.47 24.40 ± 1.60 37.93 ± 0.18 18.27 ± 0.27 18.93 ± 0.53 18.80 ± 0.53 30.13 ± 0.64 35.53 ± 0.37 35.47 ± 0.96 7.73 ± 0.35
Poloxamer 15.20 ± 0.20 16.00 ± 0.12 16.33 ± 0.13 25.40 ± 0.40 7.80 ± 0.31 10.03 ± 0.54 11.80 ± 1.21 20.53 ± 0.18 25.27 ± 0.37 22.20 ± 0.40 0.00 ± 0.00
Escherichia coli 0157 Agar 24.13 ± 0.33 24.73 ± 0.74 26.13 ± 0.41 38.13 ± 0.07 8.80 ± 0.53 17.40 ± 0.31 15.00 ± 0.12 27.67 ± 0.13 34.53 ± 0.13 33.73 ± 0.18 8.07 ± 0.27
Poloxamer 16.13 ± 0.13 16.33 ± 0.18 17.80 ± 0.20 24.20 ± 0.23 10.27 ± 0.24 10.33 ± 0.18 11.47 ± 0.07 21.07 ± 0.13 21.80 ± 0.12 21.80 ± 0.20 0.00 ± 0.00
E.coli NCIMB12210 Agar 21.80 ± 0.12 21.60 ± 0.00 22.20 ± 0.00 38.20 ± 0.12 9.80 ± 0.23 12.73 ± 0.07 13.60 ± 0.20 30.13 ± 0.07 36.27 ± 0.13 37.93 ± 0.18 NM
Poloxamer 15.80 ± 0.12 16.47 ± 0.18 17.13 ± 0.24 26.40 ± 0.12 8.40 ± 0.00 11.60 ± 0.23 11.87 ± 0.07 19.93 ± 0.07 23.73 ± 0.27 20.60 ± 0.12NM
Klebsiella sp Agar 26.67 ± 0.35 21.33 ± 0.13 23.33 ± 0.41 34.27 ± 0.13 7.47 ± 0.18 11.87 ± 0.35 18.07 ± 0.07 28.40 ± 0.50 32.40 ± 0.31 31.07 ± 0.48 7.53 ± 0.33
Poloxamer 14.60 ± 0.20 13.80 ± 0.12 14.87 ± 0.07 24.27 ± 0.27 7.20 ± 0.00 9.80 ± 0.42 11.93 ± 0.35 18.20 ± 0.31 23.13 ± 0.85 18.87 ± 0.18 0.00 ± 0.00
Morganella morganii Agar 7.67 ± 0.07 15.33 ± 0.07 16.93 ± 0.13 25.20 ± 0.42 12.47 ± 0.18 8.07 ± 0.87 8.40 ± 0.60 19.00 ± 0.23 20.47 ± 0.18 30.33 ± 0.68 7.20 ± 0.00
Poloxamer 9.00 ± 0.20 11.40 ± 0.31 12.60 ± 0.20 17.07 ± 0.44 7.27 ± 0.07 0.00 ± 0.00 7.20 ± 0.00 17.80 ± 0.12 16.53 ± 0.27 23.27 ± 0.18 0.00 ± 0.00
Proteus vulgaris Agar 24.33 ± 0.33 21.47 ± 0.75 25.60 ± 0.70 41.27 ± 0.64 0.00 ± 0.00 0.00 ± 0.00 8.73 ± 0.64 22.80 ± 1.31 36.33 ± 0.70 12.53 ± 0.27 17.87 ± 1.10
Poloxamer 17.33 ± 0.24 17.20 ± 0.60 19.00 ± 0.20 22.87 ± 1.95 11.07 ± 1.27 9.47 ± 0.33 11.47 ± 0.07 15.47 ± 0.35 24.27 ± 0.37 20.93 ± 0.24 13.47 ± 0.27
Pseudomonas aeruginosa Agar 0.00 ± 0.00 0.00 ± 0.00 0.00 ± 0.00 36.47 ± 0.81 0.00 ± 0.00 13.73 ± 0.53 14.60 ± 1.03 22.60 ± 1.40 27.53 ± 0.87 33.00 ± 0.69 0.00 ± 0.00
Poloxamer 0.00 ± 0.00 0.00 ± 0.00 0.00 ± 0.00 20.87 ± 0.07 0.00 ± 0.00 7.20 ± 0.00 7.80 ± 0.12 16.67 ± 0.35 17.03 ± 0.50 22.20 ± 0.20 0.00 ± 0.00
P. aeruginosa NCIMB 12469 Agar NM NM NM 28.87 ± 0.07 NM 7.20 ± 0.00 7.40 ± 0.00 19.73 ± 0.41 21.60 ± 0.12 28.27 ± 0.24 NM
Poloxamer NM NM NM 20.73 ± 0.07 NM 6.87 ± 0.07 7.80 ± 0.12 17.40 ± 0.00 17.40 ± 0.00 22.33 ± 0.24 NM
Annals of Clinical Microbiology and Antimicrobials 2007, 6:2 />Page 7 of 10
(page number not for citation purposes)
Table 2: Mean [± standard error] zones of clearance (mm) around all the antibiotics for Gram positive bacteria [NM – Not measured
ANTIBIOTIC
BACTERIA Test
Method
[mm]
Amoxycillin/
Clavulanic acid
Ampicillin/
Sulbactam
Ampicillin/
Sulbactam
Ciprofloxacin Clindamycin Erythromycin Erythromycin Imipenem Levofloxacin Meropenem Penicillin G
30 μg 20 μg 30 μg 5 μg 10 μg 15 μg 30 μg 10 μg 5 μg 10 μg 5 IU
Bacillus cereus Agar 13.87 ± 0.24 13.20 ± 0.00 14.93 ± 0.24 25.47 ± 0.07 25.73 ± 0.18 28.80 ± 0.23 30.07 ± 0.13 33.00 ± 0.64 24.87 ± 0.18 31.27 ± 0.68 7.07 ± 0.07
Poloxamer 11.60 ± 0.00 11.80 ± 0.00 12.33 ± 0.13 17.13 ± 0.33 15.40 ± 0.23 16.73 ± 0.18 18.13 ± 0.07 22.40 ± 1.11 18.00 ± 0.12 22.33 ± 0.18 0.00 ± 0.00
Bacillus licheniformis Agar 25.87 ± 0.24 23.47 ± 0.66 25.73 ± 0.13 34.67 ± 0.84 0.00 ± 0.00 30.80 ± 0.20 31.27 ± 0.55 39.27 ± 0.18 33.33 ± 0.18 41.53 ± 0.07 0.00 ± 0.00
Poloxamer 18.13 ± 0.13 17.40 ± 0.00 18.20 ± 0.20 22.70 ± 0.32 8.73 ± 0.13 16.33 ± 0.07 17.53 ± 0.07 27.40 ± 0.12 21.60 ± 0.23 23.47 ± 0.18 9.40 ± 0.20
Corynebacterium pseudotuberculosis Agar NM NM NM NM NM NM NM NM NM NM NM
Poloxamer 29.87 ± 0.13 27.33 ± 0.29 28.93 ± 0.47 31.53 ± 0.59 18.13 ± 0.18 25.87 ± 0.48 26.40 ± 0.64 35.33 ± 0.55 28.93 ± 1.23 30.13 ± 0.64 22.73 ± 0.29
Corynebacterium renale Agar NM NM NM NM NM NM NM NM NM NM NM
Poloxamer 32.47 ± 0.75 31.20 ± 0.23 31.00 ± 0.69 20.20 ± 0.12 19.07 ± 0.35 22.33 ± 0.18 24.00 ± 0.00 35.53 ± 0.13 19.40 ± 0.00 30.47 ± 0.27 25.40 ± 0.31
Enterococcus faecalis Agar 31.67 ± 0.13 27.07 ± 0.13 29.20 ± 0.00 20.87 ± 0.07 12.00 ± 0.20 24.53 ± 0.18 25.53 ± 0.24 29.67 ± 0.47 22.13 ± 0.24 23.27 ± 0.27 20.13 ± 0.64
Poloxamer 16.80 ± 0.20 17.13 ± 0.24 18.60 ± 0.12 13.53 ± 0.18 8.20 ± 0.12 10.00 ± 0.20 10.47 ± 0.18 19.27 ± 0.18 13.13 ± 0.18 15.73 ± 0.13 12.27 ± 0.13
Listeria ivanovii Agar 11.07 ± 0.27 7.20 ± 0.00 7.73 ± 0.07 36.07 ± 0.29 7.27 ± 0.07 9.87 ± 0.07 11.80 ± 0.83 36.60 ± 0.69 28.27 ± 0.47 25.40 ± 0.40 7.40 ± 0.12
Poloxamer 8.67 ± 0.13 7.20 ± 0.00 7.20 ± 0.00 22.07 ± 0.41 7.20 ± 0.00 8.73 ± 0.07 8.67 ± 0.07 22.67 ± 0.07 20.73 ± 0.13 19.47 ± 0.41 0.00 ± 0.00
Listeria monocytogenes Agar 22.87 ± 0.27 30.33 ± 0.75 32.60 ± 0.20 27.87 ± 0.24 24.87 ± 0.71 26.33 ± 1.98 28.00 ± 2.01 31.53 ± 0.85 26.00 ± 0.31 32.13 ± 0.97 25.07 ± 0.24
Poloxamer 18.27 ± 0.66 16.67 ± 0.90 21.27 ± 0.37 13.07 ± 1.05 11.27 ± 0.77 15.60 ± 0.31 13.93 ± 0.13 20.13 ± 0.33 13.40 ± 0.31 13.00 ± 6.51 11.80 ± 1.11
Micrococcus sp Agar NM NM NM NM NM NM NM NM NM NM NM
Poloxamer 34.40 ± 0.31 33.80 ± 0.20 34.33 ± 0.18 17.27 ± 0.68 22.80 ± 0.50 21.40 ± 0.20 22.80 ± 0.12 33.27 ± 0.77 16.60 ± 0.12 28.13 ± 0.13 24.33 ± 0.13
Nocardia asteroides Agar 31.40 ± 0.90 14.03 ± 1.32 16.87 ± 0.70 37.33 ± 0.41 13.13 ± 0.33 14.27 ± 0.37 14.73 ± 0.13 35.13 ± 0.59 38.40 ± 0.61 21.87 ± 0.18 8.33 ± 0.44
Poloxamer 23.60 ± 0.31 11.47 ± 0.07 12.40 ± 0.20 25.60 ± 0.12 13.33 ± 0.68 8.93 ± 0.13 10.33 ± 0.13 27.53 ± 0.18 25.07 ± 0.13 19.47 ± 0.07 0.00 ± 0.00
Staphylococcus aureus Agar 23.73 ± 0.18 18.47 ± 0.55 20.73 ± 0.18 27.13 ± 0.18 30.40 ± 0.95 27.13 ± 1.49 27.07 ± 1.11 33.00 ± 0.64 27.13 ± 0.07 25.67 ± 0.24 14.00 ± 0.76
Poloxamer 17.73 ± 0.07 13.60 ± 0.31 14.07 ± 0.13 18.60 ± 0.20 14.93 ± 0.37 15.13 ± 0.59 14.73 ± 0.18 23.73 ± 2.03 18.40 ± 0.53 18.80 ± 2.62 5.53 ± 2.78
Staphylococcus aureus NCIMB 12702 Agar 25.87 ± 0.07 24.80 ± 0.12 28.40 ± 0.12 22.60 ± 0.23 27.47 ± 0.27 21.87 ± 0.07 21.60 ± 0.12 32.27 ± 0.18 26.60 ± 0.20 36.47 ± 0.24 31.00 ± 0.00
Poloxamer 22.33 ± 0.07 22.73 ± 0.07 17.07 ± 6.73 19.20 ± 0.00 16.53 ± 0.07 15.47 ± 0.24 15.53 ± 0.18 29.87 ± 0.07 19.60 ± 0.12 25.73 ± 0.07 20.27 ± 0.27
Staphylococcus citreus Agar NM NM NM NM NM NM NM NM NM NM NM
Poloxamer 24.80 ± 0.00 23.80 ± 0.12 23.73 ± 0.79 17.80 ± 0.35 18.40 ± 0.12 19.93 ± 0.33 21.07 ± 0.07 30.80 ± 0.12 18.00 ± 0.12 26.93 ± 0.13 18.60 ± 0.00
Staphylococcus epidermis Agar 33.07 ± 1.39 34.20 ± 0.53 35.27 ± 0.07 30.60 ± 0.70 30.80 ± 0.23 30.47 ± 1.17 34.00 ± 0.00 39.47 ± 0.27 30.60 ± 0.31 36.20 ± 0.92 33.67 ± 0.66
Poloxamer 24.53 ± 0.13 24.93 ± 0.07 25.53 ± 0.07 19.93 ± 0.18 15.60 ± 0.83 15.47 ± 0.33 16.07 ± 0.18 28.53 ± 0.68 21.67 ± 0.35 25.13 ± 0.77 19.67 ± 0.35
Staphylococcus hominis Agar NM NM NM NM NM NM NM NM NM NM NNM
Poloxamer 27.27 ± 0.29 26.87 ± 0.53 27.40 ± 0.20 16.33 ± 0.77 10.87 ± 0.33 18.53 ± 0.37 20.23 ± 0.15 30.87 ± 0.07 17.53 ± 0.13 26.80 ± 0.81 21.53 ± 0.47
Staphylococcus hyicus Agar 34.47 ± 0.53 37.20 ± 0.12 38.60 ± 0.40 30.93 ± 0.13 28.33 ± 0.57 27.27 ± 0.07 28.60 ± 0.61 41.87 ± 0.13 29.00 ± 0.20 37.60 ± 0.00 38.00 ± 0.40
Poloxamer 25.73 ± 0.07 25.80 ± 0.35 26.73 ± 0.24 21.67 ± 0.18 16.93 ± 0.07 14.40 ± 0.20 15.93 ± 0.07 31.60 ± 0.20 20.67 ± 0.13 27.00 ± 0.20 23.47 ± 0.13
Staphylococcus intermedius Agar 33.00 ± 0.12 25.87 ± 0.07 25.33 ± 0.47 35.00 ± 0.40 28.00 ± 0.20 30.20 ± 0.42 27.40 ± 0.12 40.13 ± 0.41 32.20 ± 0.46 35.13 ± 0.41 9.13 ± 0.07
Annals of Clinical Microbiology and Antimicrobials 2007, 6:2 />Page 8 of 10
(page number not for citation purposes)
Gilbert et al. [10] suggested the use of poloxamer as a sub-
stitute for antimicrobial susceptibility testing and hypoth-
esized that bacteria would grow in a biofilm state in
poloxamer as opposed to a lab adapted 'planktonic' state.
In their study OMPs from poloxamer grown and biofilm
grown Pseudomonas aeruginosa had a number of identical
OMPs which were not found in the bacteria when it was
grown on agar and in broth (planktonic state). Within our
study were have also discovered two outer membrane pro-
teins in Pseudomonas aeruginosa at 87 kDa and 112 kDa in
the biofilm and poloxamer grown state. These were not
present in the MH agar grown cells which suggests that the
protein profile of Pseudomonoas aeruginosa biofilm cells
are different to that of MH agar grown 'planktonic/quasi-
sessile' cells. The data generated in this paper supports the
findings of Gilbert et al. [10], who found that poloxamer
and biofilm grown Pseudomonas aeruginosa cells expressed
outer membrane proteins between 78 and 87 kDa, which
were not evident in MH agar grown cells. An additional
protein between 71 and 72 kDa was found in the biofilm
and poloxamer grown cells that was not found in the agar
grown cells. This protein may represent the protein OprC
[70 kDa] that was found in biofilm cells by Gilbert et al.,
[10]. This protein was not evident in the planktonic cells
and imply that there is a phenotypic difference between P.
aeruginosa cells grown on poloxamer gel and MH agar,
with poloxamer gel grown cells resembling biofilm cells.
Overall for all the bacteria studied in this paper unique
OMPs were identified when the bacteria were grown on
poloxamer and in the biofilm state, that were not evident
when the bacteria were grown on MH agar or in MH
broth. OMPs were also identified from bacteria grown in
MH agar and broth that were not found on poloxamer
and bofilm grown bacteria. This suggests that bacterial
cells display a biofilm phenotype in the presence of
poloxamer. Consequently, this suggests that the sessile
bacteria when grown on poloxamer express OMPs which
are biofilm specific.
Having identified phenotypic similarities between
poloxamer and biofilm grown cells an antimicrobial sus-
ceptibility test was conducted on a range of bacterial
organisms grown in parallel on MH agar and poloxamer
gel, in order to determine if a difference existed between
the two different growth media. It was found that there
was a significant difference [P < 0.05] between the growth
diameters of the zones of inhibition on MH agar and
poloxamer gel. The zones were generally smaller when the
bacteria were grown on poloxamer gel and the antibiotic
The average diffusion distances of various antibiotics through standard agar and 30% Poloxamer gelsFigure 2
The average diffusion distances of various antibiotics through standard agar and 30% Poloxamer gels.
0
5
10
15
20
25
30
35
40
Ciprofloxacin
(MW 331.34)
Enrofloxacin (MW
359.39)
Levofloxacin (MW
361.37)
Meropenem (MW
469.54)
Doxycycline
Hydrochloride
(MW 512.94)
Amikacin (MW
621.63)
Gentamicin (MW
653.21)
Diffusion distance (mm)
Agar
Ploxamer (30%)
Annals of Clinical Microbiology and Antimicrobials 2007, 6:2 />Page 9 of 10
(page number not for citation purposes)
efficacy often differed between the two different media.
For example, imipenem was the most efficient antibiotic
against MH agar grown Actinobacillus equuli [35.4 mm
mean diameter inhibition zone], whereas meropenem
was the most effective antibiotic against the poloxamer gel
grown form of the bacterium producing a 26.87 mm
mean zone of inhibition. Not only was there a difference
in the extent of antibiotic efficacy on both MH agar and
poloxamer gel between antibiotics but the degree of effi-
cacy also differed for the same antibiotic. Notably this was
demonstrated in the case of penicillin G where organisms
tested showed susceptibility when grown on MH agar but
complete resistance when grown on poloxamer gel. It is
also important to note that in this study the zones sizes
are not comparable between the different antibiotics par-
ticularly as the methods employed are not quantitative,
although gross differences can be concluded.
The differences in results relating to the two types of
media calls into question the applicability of the tradi-
tional Kirby Bauer antibiotic susceptibility test which has
been used widely in microbiology laboratories over the
last forty years or so. Incorrect antibiotic concentrations
can increase antibiotic resistance mutation rates in bacte-
ria [20]. Generally, the use of ineffective antibiotics,
whether due to class or dosage, to treat bacterial infec-
tions, will apply selection pressure to a population which
will favour resistant strains. With the increasing threat of
epidemic resistant organisms such as Methicillin Resistant
Staphylococcus aureus (MRSA) the need for appropriate
antibiotic selection is currently of prime importance to
both clinical and veterinary science [21,22].
Conclusion
Overall, this study has shown that the efficacy of antibiot-
ics is reduced when bacteria are grown in the presence of
poloxamer gel, as a biofilm phenotype. It has already been
established that biofilm bacteria are resistant to antibiot-
ics [23], however current susceptibility tests only use agar
media that encourage bacteria to grow more within a
'planktonic/quasi-sessile' state than as a 'true' biofilm
phenotype. The findings of this study suggest that
poloxamer gel could be considered as an alternative
medium on which to conduct antibiotic susceptibility
tests as it enables bacteria to be grown in a biofilm state
more representative of a biological surface infection (e.g.
chronic infected wound). However, further studies are
necessary to substantiate this claim particularly a quanti-
tative version of this technology to aid clinicians and
microbiologists to make informed decisions regarding
prevention and treatment of serious biofilm infections.
Competing interests
SLP and JD are employees of ConvaTec Wound Therapeu-
tics™.
Authors' contributions
ALC and JD performed experimental work. ALC, CC and
SLP designed the study, collected and analysed the data
and drafted the manuscript. All authors read and
approved the final manuscript
Acknowledgements
We would like to thank ConvaTec Wound Therapeutics™ for funding this
research. We would also like to thank the University of Liverpool, Depart-
ment of Veterinary Clinical Science, Division of Equine Studies for the use
of their facilities and bacterial organisms.
References
1. Costerton JW: Overview of microbial biofilms. J Ind Microbiol
1995, 15:137-140.
2. Parsek MR, Fuqua C: Biofilms 2003: Emerging themes and chal-
lenges in studies of surface- associated microbial life. J Bacte-
riol 2004, 186:4427-4440.
3. Costerton JW, Veeh R, Shirtliff M, Pasmore M, Post C, Ehrlich G: The
application of biofilm science to the study and control of
chronic bacterial infections. J Clin Inves 2003, 112:1466-1477.
4. Stewart PS, Costerton JW: Antibiotic resistance of bacteria in
biofilms. Lancet 2001, 358:135-138.
5. Livermore DM: Bacterial resistance: Origins, epidemiology,
and impact. Clin Inf Dis 2003, 36(1):S11-S23.
6. Bauer AW, Kirby WMM, Sherris JC, Turck M: Antibiotic suscepti-
bility testing by a standardized single disc method. Am J Clin
Pathol 1966, 45:493-496.
7. Wheat PF: History and development of antimicrobial suscep-
tibility testing methodology. J Antimicrob Chemother 2001, 48:1-4.
8. Gaudreau C, Gilbert H: Comparison of disc diffusion and agar
dilution methods for antibiotic susceptibility testing of
Campylobacter jejuni subsp. jejuni and Campylobacter coli. J
Antimicrob Chemother 1997, 39:707-712.
9. Manoharan A, Pai R, Shankar V, Thomas K, Lalitha MK: Comparison
of disc diffusion and E test methods with agar dilution for
antimicrobial susceptibility testing of Haemophilus influen-
zae. Indian J Med Res 2003, 117:81-87.
10. Gilbert P, Jones MV, Allison DG, Heys S, Maira T, Wood P: The use
of poloxamer hydrogels for the assessment of biofilm suscep-
tibility towards biocide treatments. J Appl Microbiol 1998,
85:985-990.
11. Wirtanen G, Salo S, Allison DG, Mattila-Sandholm T, Gilbert P: Per-
formance evaluation of disinfectant formulations using
poloxamer-hydrogel biofilm-constructs. J Appl Microbiol 1998,
85(6):965-71.
12. Sincock SA, Rajwa B, Robinson PJ: Characteristics and dynamics
of bacterial populations with poloxamer hydrogel biofilm
constructs. Abstract International Society for Analytical Cytology XX
International Congress, May 20–25, 2000, Le Corum, Montpellier, France
6451.
13. Kim MM, Park HK, Kim SN, Kim HD, Kim YH, Rang MJ, Ahn HJ,
Hwang JK: Effect of a new antibacterial agent, xanthorrhizol
on the viability of plaque biofilm. Poster IADR/AADR/CADR 80th,
San Diego, March 6–9th 2002 3883.
14. MacLehose HG, Gilbert P, Allison DG: Biofilms, homoserine lac-
tones and biocide susceptibility. Journal of Antimicrobial Chemo-
therapy 2004, 53:180-184.
15. Rickard AH, Gilbert P, Handley PS: Influence of growth environ-
ment on coaggregation between freshwater biofilm bacte-
ria. J of Applied Microbiology 2004, 96:1367-1373.
16. National Committee for Clinical Laboratory Standards: Methods for
dilution antimicrobial susceptibility testing for bacteria that
grow aerobically. Approved standard M7-A5. National Committee for
Clinical Laboratory Standards, Wayne, Pa 5 2000.
17. Percival SL, Bowler PG: Biofilms and their potential role in
wound healing. Wounds 2004, 16:234-240.
18. Percival SL, Rogers AA: The significance and role of biofilms in
chronic wounds. Biofilms: Persistence and ubiquity. Biofilms: Persistence
and Ubiquity, The Biofilm Club 7th Meeting of the Biofilm Club, Gregynog
Hall, Powys 7–9th September 2005 2005:171-178.
Publish with BioMed Central and every
scientist can read your work free of charge
"BioMed Central will be the most significant development for
disseminating the results of biomedical research in our lifetime."
Sir Paul Nurse, Cancer Research UK
Your research papers will be:
available free of charge to the entire biomedical community
peer reviewed and published immediately upon acceptance
cited in PubMed and archived on PubMed Central
yours — you keep the copyright
Submit your manuscript here:
/>BioMedcentral
Annals of Clinical Microbiology and Antimicrobials 2007, 6:2 />Page 10 of 10
(page number not for citation purposes)
19. Ceri H, Olson ME, Stremick C, Read RR, Morck D, Buret A: The
Calgary biofilm device:new technology fro rapid determina-
tion of antibiotic susceptibilities of bacterial biofilms. J Clin
Microbiol 1999, 37(6):1771-76.
20. Martinez JL, Baquero F: Mutation frequencies and antibiotic
resistance. Antimicrob Agents Chemother 2000, 44:1771-1777.
21. Johnson AP, Aucken H, Cavendish S, Ganner M, Wale MCJ, Warner
M, Livermore DM, Cookson BD: Dominance of EMRSA-15 and -
16 among MRSA causing nosocomial bacteremia in the UK:
analysis of isolates from the European Antimicrobial Resist-
ance Surveillance System [EARSS]. J Antimicrob Chemother
2001, 48:143-144.
22. Lloyd DH: Chemotherapy; yesterday, today and tomorrow.
Vet Dermatol 1998, 9:73-74.
23. Costerton JW, Stewart PS, Greenberg EP: Bacterial biofilms: A
common cause of bacterial infections. Science 1999,
284:1318-1322.