Báo cáo khoa học: "Effect of edging and docking methods on volume and grade recoveries in the simulated production of flitches" pps
Bạn đang xem bản rút gọn của tài liệu. Xem và tải ngay bản đầy đủ của tài liệu tại đây (522.41 KB, 8 trang )
Original
article
Effect
of
edging
and
docking
methods
on
volume
and
grade
recoveries
in
the
simulated
production
of
flitches
CL
Todoroki
NZ
Forest
Research
Institute,
Rotorua,
New
Zealand
(Received
1 st
September
1993;
accepted
9
September
1993)
Summary —
This
paper
describes
edging
procedures
that
have
been
adapted
for
use
in
the
pruned
log
sawing
simulation
system,
AUTOSAW,
developed
at
the
Forest
Research
Institute,
New
Zealand.
Automated
sawing
simulations
were
performed
on
a
sample
of
20
pruned
logs
using
a
standardised
sawpattern.
These
simulations
produced
a
total
of
483
flitches
of
which
221
flitches
required
edging/docking
operations
to
be
applied.
Methods
were
developed
to
maximise
volume
and
grade
recoveries.
Each
method
was
examined
3
times,
varying
the
maximum
number
of
edged
pieces
(from
each
flitch)
from
1
to
3
(simulating
2
to
4
saws).
An
increase
in
total
volume
of
approximately
28%
was
obtained
when
the
maximum
number
of
edged
pieces
was
increased
from
1
to
2,
and
a
further
4%
increase
in
volume
when
increased
from
2
to
3.
edging
/
docking
/
volume
optimisation
/
grade
optimisation
Résumé —
Effets
des
méthodes
de
délignage
et
de
rognage
sur
les
rendements
en
volume
et
en
classe
de
qualité
dans
la
production
de
plots
obtenus
par
simulation.
L’article
décrit les
procédures
de
délignage
qui
ont
été
adaptées
pour
leur
emploi
dans
AUTOSAW,
un
système
de
simulation
de
sciage
de
grumes
élaguées
développé
à
l’Institut
de
recherches
forestières
de
Nouvelle-Zélande.
Des
simulations
automatisées
de
sciage
ont
été
réalisées
sur
un
échantillon
de
20
grumes
élaguées
en
utilisant
un
plan
de
débit
standard.
Ces
simulations
ont
produit
un
total
de
483
plots
dont
221
pour
lesquels
des
opérations
de
délignage
et
de
rognage
ont
été
requises.
Les
méthodes
ont
été
développées
afin
de
maximiser
les
rendements
en
volume
et
en
classe
de
qualité.
Chaque
méthode
a
été
examinée
3
fois
en
faisant
varier
de
1
à 3
le
nombre
maximum
de
pièces
délignées
dans
chaque
plot
(simulation
de
2
à
4
scies
de
reprise).
Une
augmentation
d’environ
28%
a
été
obtenue
pour
le
volume
total
quand
le
nombre
maximum
de
pièces
délignées
passait
de
1
à
2 ;
quand
ce
nombre
maximum
passait
de
2
à
3,
une
augmentation
supplémentaire
de
4%
a
été
obtenue.
délignage / rognage / optimisation
du
volume / optimisation
du
classement
INTRODUCTION
In
a
sawmill,
primary
breakdown
involves
cutting
logs
into
flitches
at
the
main
saw.
These
flitches
are
in
turn
cut
horizontally
into
edged
pieces
after
which
the
rough
end
sections
are
cut
off,
docked,
to
complete
the
secondary
breakdown
process.
Cutting
flitches into
edged
pieces
involves
super-imposing
edger
sawlines
on
a
flitch
such
that
the
target
widths
can
be
cut.
With
each
edge
cut
an
amount
equal
to
the
edger
sawkerf
is
lost
in
the
form
of
sawdust.
All
edged
pieces
must
be
feasible
with
respect
to
a
minimum
grading
length
criteria
and
to
a
maximum
wane
tolerance
level.
To
achieve
this,
docking
sawlines
are
super-
imposed
on
the
edged
piece.
A
solution
is
sought
in
which
the
total
recovery
is
maxi-
mised.
For
the
purposes
of
this
paper
recov-
ery
is
measured
in
terms
of
nominal
volume
and
grade.
As
the
thickness
of
each
edged
piece
is
assumed
to
be
constant
the
problem
can
be
stated
as
follows:
0, otherwise
g
ijk
≥
0
where:
N:
number
of
target
widths;
M:
number
of
edged
pieces
which
may
be
produced
from
each
flitch
(thus
there
may
be
M+1
edger sawlines);
D:
maximum
number
of
docked
pieces
per
flitch
D
=
1
+
(F
zmax
-
F
zmin
)
D/V/
min
(see
explanation
of
terms
below);
K:
width
of
the
edger
sawkerf;
WA
i:
actual
dimension
of
target
width
i;
WN
i:
nominal
dimension
of
target
width
i;
Pj:
position
of
edger
sawline
j;
x
ij
:
equals
1
if
a
piece
of
width
WA
i
is
cut
such
that
the
lower
edge
of
the
piece
is
at
edger
sawline
position
pj,
0
otherwise;
g
ijk
:
coefficient
which
reflects
grade
of
piece
with
actual
width
WA
i
and
length
Z
j,k+1
-
z
j,k
cut
from
position
pj
of
edger
sawline
when
problem
is
to
maximise
grade
recoveries.
For
maximisation
of
volume
recoveries
g
ijk
=
1
for all
i,j,k;
F
ymin
,F
ymax
:
minimum
and
maximum
y co-
ordinates
of
flitch;
F
zmax
,F
zmin
:
minimum
and
maximum
z
co-
ordinates
of
flitch;
l
min
:
minimum
grading
length;
z
j,k
:
z coordinate
of
k
th
docking
sawline
and
j
th
:
edger
sawline;
δ:
maximum
wane
tolerance
level;
a
jk
:
equals
1
if
the
board
is
bounded
by
jth
edger
sawline
and
kth
docking
sawline
(see
explanation
below)
is
feasible
with
respect
to
the
minimum
grading
length
criteria
and
maximum
wane
tolerance
level,
and
is
0
otherwise;
U
jk
(z,y),L
jk
(z,y):
upper
and
lower
coordinates
respectively
of
board
face
bounded
by
jth
edger
sawline
and
kth
docking
sawline;
ymax
j,k
:
maximum
ycoordinate
of
L
j,k
(z,y);
ymin
j,k
:
minimum
ycoordinate
of
U
j,k
(z,y).
Recall
that
the
edger
and
docking
saw-
lines
are
super-imposed
on
a
flitch.
Thus
the jth
edger
sawline
and
kth
docking
saw-
lines
define
a
rectangle
with
coordinates:
(z
j,k
,
pj)
(z
j,k+1
,
pj)
(z
j,k+1
,
p
j+1
- K)
(z
j,k
,
p
j+1
-
K).
Thus
the
shape
of
the
board
cut
is
a
polygon
which
lies
on
or
within
this
rectangle.
Con-
sequently
for
every
zs:
z
j,k
<
zs
<
z
j,k+1
there
are
exactly
2
y
coordinates
ys,
yt
corre-
sponding
to
the
upper
and
lower
edges
of
the
board.
Let
U
jk
(z,y)
consist
of
those
co-
ordinates
(z
s
,y
s)
where
ys
≥ y
t,
zs
=z
t
which
define
the
upper
edge
of
the
board
and
let
L
jk
(z,y)
consist
of
the
coordinates
zt
,y
t
where
yt
< y
s,
zs
=
zt
which
define
the
lower
edge
of
the
board.
Now
the
worst
wane
on
the
upper
edge
of
the
board
(ie
worst
deviation
from
p
j+1
-
K)
is
due
to
the
minimum
value
of
y in
U
jk
(z,y)
ie
ymin
jk
and
the
worst
wane
on
the
lower
edge
of
the
board
is
due
to
the
maxi-
mum
value
of
y
in
L
jk
(z,y),
ie
ymax
j,k
.
Edging
and
docking
operations
have
been
identified
as
potential
sources
of
recov-
ery
improvement
in
sawmills
(Hamlin,
1983).
Improved
recoveries
not
only
contribute
to
an
increase
in
value
but
also
to
better
utili-
sation
of
wood
and
hence
to
improved
util-
isation
of
a
valuable
resource.
Although
edger
’optimisers’
are
com-
mercially
available
their
high
cost
(between
$750 000
and
$1.5
million)
is
a
major
draw-
back.
These
’optimisers’
can
achieve
85-95%
of
the
theoretical
maximum
recov-
erable
amount
of
timber
for
each
flitch
whilst
the
average
edger
operator
achieves
about
65-75%
(Doyle,
1989).
Documentation
of
the
procedures
used
by
commercial
edgers
does
not
appear
to
be
readily
available.
Regalado
et al (1992)
describe
a
proce-
dure
that
maximises
timber
value
from
a
given
flitch.
In
the
following
extract,
the
term
’trimming’
is
equivalent
to
’docking’;
and
’cutting-line
combinations’
refers
to
the
com-
binations
of
edging
and
docking
lines.
"
The
method
was
to:
1)
iteratively
gen-
erate
combinations
of
edging
and
trimming
lines;
2)
evaluate
grade
and
volume
yielded
by
each
edging
and
trimming
line
combina-
tion;
and
3)
select the
combination
of
edging
and
trimming
lines
that
maximised
lumber
value.
"
The
procedure
was
restricted
to
pro-
ducing
one
edged
piece
or
"
ripping
to
produce
2
lumber
pieces
was
allowed
in
cases
where
these
operations
were
thought
to
possibly
improve
lumber
value
beyond
that
obtainable
from
the
iterative
variation
of
cutting
lines.
Cutting
line
combinations
were
generated
by
varying
the
coordinates
of
each
edging
and
trimming
line
between
predetermined limits." These
limits,
by
the
authors’
own
admission,
involved
some
degree
of
subjectivity.
Lewis
(1985)
uses
a
different
procedure
by
which
a
reference
line
is
established
and
the
flitches
edged
parallel
to
this
line.
Two
edging
methods
are
used.
The
first
method
was
full-length
edging
which
"
simulates
cutting
the
widest
full-length
piece
of
lum-
ber possible
as
an
edger
operator
might
do.
If
a
model
cannot
find
a
full-length
piece,
it
re-establishes
the
reference
line,
and
will
try
to fit
a
2-foot
shorter piece
somewhere
in
the
flitch.
This
process
continues
until
a
piece
is
found.
Where
possible,
the
model
will
remanufacture
the
remainder of the
flitch
into
a
piece
of lumber.
"The
second
method,
trim-back
edging,
"
simulates
an
auto-
mated
optimizing
edger
where
only
combi-
nations
based
on
the
widest
piece
are
cut."
This
method
also
produces
1
or
2
edged
pieces
per flitch.
The
edging
procedures
presented
pro-
duce
1,
2,
or
3
edged
pieces
per
flitch.
A
description
of
these
procedures
follows.
MATERIALS
AND
METHODS
Two
heuristic
procedures
for
the
edging/docking
of
flitches
were
examined.
The
first
is
a
’brute-
force’
iterative
procedure
which
obtains
optimal
(or
near
optimal)
volume
(or
grade)
recoveries
and,
as
such,
provides
a
benchmark
for
comparison
purposes.
The
second
is
a
heuristic
procedure
that
utilises
the
known
geometry
of
each
flitch
to
obtain
a ’good’ solution
quickly.
The
objective
of
both
procedures
is
to
edge
and
dock each
flitch
so
as
to
maximise
volume
(or
grade)
recovery.
Both
procedures,
under
both
objective
func-
tions,
were
implemented
in
the
pruned
log
sawing
simulator
AUTOSAW
(Todoroki,
1990),
(com-
piled
with
Turbo
Pascal
and
running
on
a
33
MHz
80486
processor)
giving
4
different
edging
meth-
ods.
A
sample
of
20
logs
were
then
processed
in
the simulator
using
a
standardised
sawpattern
(Park,
1989).
This
gave
a
total
of
483
flitches
of
which
221
flitches
required
edging/docking
oper-
ations
to
be
applied
(182
flitches
were
’cant’
flitches,
rectangular
flitches
obtained
from
the
inner
part
of
the
log,
and
80
flitches
were
’wing’
flitches,
the
first
cut
on
each
face
of
the
log).
Each
method
was
tested
3
times,
varying
the
maximum
number
of
edged
pieces,
M,
from
1
to
3
(simulating
edgers
with
2-4
saws
and/or
allow-
ing
for
a
splitting
saw
option).
The
following
values
were
used
for
all
tests:
The
coefficient
for
the
grade
weights
g
ij
is
1.0
when
the
problem
is
to
maximise
volume
and
1.0,
0.833,
0.667,
0.500,
0.333,
0.167
for
grades
c,
x,
s,
f,
k,
p,
respectively,
when
the
problem
is
that
of
maximising
grade
recovery.
The
grades
are
defined
in
Appendix
1 and
are
based
on
New
Zealand
timber
grading
rules
(Sanz,
1987).
Brute
force
iterative
procedure
A
brute
force
procedure
was
developed
in
order
to
obtain
optimal
(or
near
optimal)
recoveries
from
each
of
the
flitches.
This
procedure
involved
the
following
steps:
1)
recursively
generate
all
feasible
combinations
of
the
given
widths;
2)
permute
each
of
the
generated
feasible
com-
binations;
3)
for
each
permutation,
super-impose
a
refer-
ence
line
on
the
flitch
at
regular
intervals,
and
determine
the
recovery
associated
with
each
interval;
4)
select
the
permutation
which
allows
greatest
recovery.
A
feasible
combination
is
one
for
which
the
total
width
of
that
combination
(including
allowances
for
edger
sawkerfs)
is
no
greater
than
the
widest
bounds
of
the
flitch.
Each
feasible
combination
is
permuted
using
the
HeapPermute
algorithm
due
to
Heap
(1963)
and
outlined
in
Appendix 2.
It
is
necessary
to
per-
mute
the
combinations
since
different
cuts
would
results.
An
example
is
given
below.
Example
Let
M = 3,
N = 2 with
WA
1
= 50 mm,
WA
2
= 75
mm
and
the
flitch
width
=
200
mm.
The
follow-
ing
combinations
are
then
generated,
where
the
first
number
is
the
coefficient
of
the
first
width
(50
mm)
and
the
second
width
(75
mm):
Since
M=
3,
then
combinations
(3,2) (3,1)
(2,2)
are
infeasible.
(0,0)
is
also
infeasible
since
there
must
be
at
least
one
cut.
In
addition,
(1,2)
is
also
infeasible
as
this
would
exceed
the
flitch
width
(since
edger
sawkerfs
must
also
be
included).
The
combination
(2,1)
represents
two
50
mm
cuts
and
one
75
mm
cut.
Since
the
order
of
cut-
ting
can
make
a
considerable
difference,
the
per-
mutations
of
this
combination
are
also
required,
ie
(50,
50,
75), (50,
75,
50),
and
(75,
50,
50).
The
interval
chosen
for
the
reference
line
incre-
ments
was
0.5
mm,
starting
from
the
lowermost
edge
of
the
flitch.
Although,
theoretically,
this
does
not
actually
guarantee
that
the
optimal
solution
will
be
found,
it
is
beyond
the
accuracy
of
any
mill
equipment
currently
available,
and
in
addition,
all
measurements
were
made
to
the
nearest
milli-
metre
so
for
all
practical
purposes
the
solution
generated
can
be
treated
as
being
optimal.
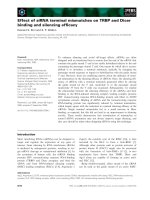
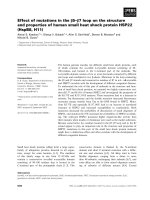
Geometric
procedure
A
different
approach,
similar
to
that
of
Lewis
(1985),
was
developed
with
flitches
being
edged
parallel
to
reference
lines.
These
are
positioned:
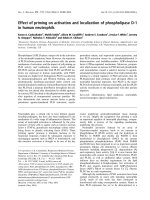
1)
at
the
lower
wane
edge
of
the
flitch
with
edging
occurring
above
this
line
(fig
1a);
2)
at
the
upper
wane
edge
of
the
flitch
with
edg-
ing
occurring
below
this
line
(fig
1 b);
3)
mid-way
between
the
2
wane
edges
of
the
piece
with
edging
being
centred
around
this
line.
For
the
case
of
volume
maximisation,
the
com-
bination
of
pieces
that
gives
the
largest
total
nom-
inal
volume
is
selected.
For
grade
maximisation,
an
initial
solution
is
obtained
using
the
above
method
with
weighted
volumes.
In
addition,
if
the
flitch,
or
some
part
of
the
flitch,
lies
within
the
defect
core
then
further
reference
lines
are
es-
tablished.
These
lines
are
determined
by
the
extent
of
the
defects
and
are
positioned:
4)
at
the
bottom
of
the
lowermost
defect
with
edging
occurring
above
this line
(fig
1c);
5)
at
the
top
of
the
uppermost
defect
with
edg-
ing
occurring
below
this
line
(fig
1d);
6)
mid-way
between
the
uppermost
and
lower-
most
defect
extremes
with
edging
centred
around
this
line.
Of
the
221
flitches,
52
contained
defects.
As
the
remaining
169
flitches
are
defect-free
edging
for
grade
recovery
produces
the
same
result
as
the
edging
for
volume
recovery.
Thus
only
the
grade
recoveries
of
these
52
flitches
may
differ,
so
grade
comparisons
are
restricted
to
these
flitches.
RESULTS
Table
I shows
the
total
processing
times
(rounded
to
the
nearest
minute)
for
the
20
logs,
for
each
edging
method.
The
volumes
of
the
221
flitches
that
had
been
edged/docked
using
the
brute
force
and
heuristic
procedures
were
calculated
for
each
of
M
=
1,
2,
3.
The
total
volumes
attributed
to
these
flitches
for
each
of
the
logs
were
then
calculated
and
are
shown
in
table
II.
An
increase
in
volume
of
approx-
imately
28%
(μ
=
28,
σ
=
13)
was
obtained
when
the
maximum
number
of
edged
pieces
was
increased
from
1
to
2,
and
a
further
4%
increase
in
volume
(μ
=
4,
σ
=
2)
when
increased
from
2
to
3.
The
percentage
volume
(geometric
heuristic/brute
force)%
was
calculated
for
each
of
the
221
flitches
and
the
result
rounded
to
the
nearest
integer.
The
num-
ber
of
occurrences
at
each
percentage
are
shown
in
table
III.
Table
IV
summarizes
these
results,
showing
the
number
and
per-
centage
of
fliches
which
obtained
at
least
95
and
90%,
respectively,
of
the
’optimal’
volume
for
each
of
M =
1,
2
and
3.
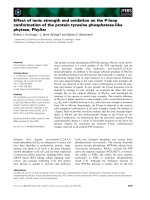
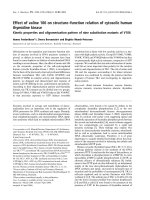
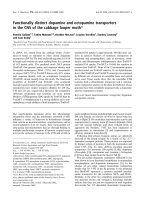
Figure
2
shows
a
comparison
of
the
grade
recoveries
for
the
52
flitches
con-
taining
defects,
for
the
heuristic
(H),
and
brute
force
(BG)
procedures.
The
grade
recoveries
of
the
same
52
flitches
obtained
when
maximising
volume
using
the
brute
force
procedure
(BV)
are
also
given.
DISCUSSION
The
computational
results
demonstrate
that
the
geometric
heuristic
procedure
obtained
good
results
when
compared
with
the
brute
force
procedures
for
both
volume
and
grade
maximisation
problems.
The
geometric
heuristic
procedures
pro-
vide
rapid
processing
times
and
as
such
would
be
acceptable
to
existing
sawmills,
whereas
the
brute
force
procedures
were
very
slow,
and
would
be
impractical
for
real-
time
situations.
The
28%
increase
in
vol-
ume
observed
when
Mwas
increased
from
1
to
2
seems
to
indicate
that
an
edger
with
only
2
saws
(ie
M
= 1)
produces
much
reduced
volume
recoveries.
The
recover-
ies
were
notably
poor
for
larger
logs
(see
Appendix
3
for
some
log
characteristics)
and
can
be
attributed
to
the
fact
that
the
largest
’target’
size
sawn
was
250
mm.
This
represents
a
mismatch
between
the
logs
and
the
selected
target
sizes
resulting
in
much
wood
being
wasted.
However,
in
prac-
tice,
further
processing
could
recover
some
of
this
wastage
(which
is
equivalent
to
incre-
menting
M).
As
can
be
seen
in
table
III,
the
geometric
heuristic
procedure
obtained
a
better
result
than
the
brute
force
heuristic
on
2
occasions
for
case
M
=
1
and
once
for
each
of
M
=
2,
3
(these
were
actually
due
to
the
same
flitch,
and
with
only
one
edged
piece
being
taken
in
each,
since
a
solution
for
M =
1
is
also
a
solution
for
M =
2,
and
so
on).
This
shows
that
the
even
with
a
step
increment
of
0.5
mm,
the
optimal
solution
is
not
guaran-
teed.
Figure
2
compared
the
grade
recover-
ies
of
the
52
flitches
containing
defects.
As
was
to
be
expected,
better
grade
distribu-
tions
were
obtained
for
both
the
geometric
heuristic
procedures
and
the
brute
force
procedure
when
the
objective
was
to
max-
imise
grade
recoveries.
However,
the
com-
paratively
poor
results
obtained
from
the
brute force
edging
procedure
when
the
objective
was
to
optimise
volume
recover-
ies
should
be
noted
with
some
concern.
For
flitches
with
defects
this
procedure
is
inappropriate.
However,
very
few ’optimis-
ing’ edger
machines
that
are
currently
avail-
able
have
grade
input
capabilities
hence
many
mills
will
be
under-achieving
in
terms
of
recovered
timber
grades
(and
hence
the
value
of
the
resultant
timber
will
also
be
reduced).
REFERENCES
Doyle
J
(1989)
Optimising
edgers
bring
benefits
in
conversion.
NZ For Ind
28-29
Hamlin
F
(1983)
Mill
Experience
with
edger
opti-
mization.
Proceedings
from
a
series
of
regional
seminars
on
microelectronics
in
the
wood
products
industry.
Today’s
generation
in
Sawmilling.
Forintek
Canada
Corp,
Special
Publication
No
SP
12
ISSN
0824-2119
Heap
BR
(1963)
Permutations
by
interchanges.
Comput
J 6,
293-294
Lewis
DW
(1985)
Best
opening
face
system
for
sweepy,
eccentric
logs:
A
user’s
guide.
Gen
Tech
Rep
FPL-49,
Madison,
WI,
USDA,
For-
est
Service,
Forest
Products
Laboratory
Park
JC
(1989)
Applications
of
the
SEESAW
sim-
ulator
and
pruned
log
index
to
pruned
resource
evaluations -
a case
study.
N
ZJ
For
Sci 18,
68-82
Regalado
C,
Kline
D,
Araman
P
(1992)
Optimum
edging
and
trimming
of
hardwood
lumber.
For
Prod J 42, 8-14
Sanz
(1987)
NZS
8631.
1987
Timber
grading
rules.
Standards
Association
of
New
Zealand
Todoroki
CL
(1990)
Autosaw
system
for
sawing
simulation.
N Z J For Sci 20,
332-348