Báo cáo khoa học: "Water relations of adult Norway spruce (Picea abies (L) Karst) under soil drought in the Vosges mountains: water potential, stomatal conductance and transpiration" ppsx
Bạn đang xem bản rút gọn của tài liệu. Xem và tải ngay bản đầy đủ của tài liệu tại đây (702.05 KB, 13 trang )
Original
article
Water
relations
of
adult
Norway
spruce
(Picea
abies
(L)
Karst)
under
soil
drought
in
the
Vosges
mountains:
water
potential,
stomatal
conductance
and
transpiration
P Lu
P
Biron
N
Bréda
A
Granier
1
INRA,
laboratoire
d’écophysiologie
et
bioclimatologie,
54280
Champenoux;
2
CEREG,
ULP,
3,
rue
de
l’Argonne,
67000
Strasbourg
cedex,
France
(Received
27
February
1994;
accepted
26
July
1994)
Summary —
The
effects
of
soil
water
depletion
on
sap
flow,
twig
water
potential,
stomatal
and
canopy
conductance
were
analysed
in
2
plots
of
a
30-year-old
stand
of
Norway
spruce.
One
was
subjected
to
an
imposed
drought;
the
other
was
watered
by
irrigation.
Predawn
water
potential
in
trees
from
the
dry
plot
decreased
to
-1.2
MPa.
In
the
watered
plot,
a
low
between-tree
variability
of
sap
flux
density
was
observed,
with
maximum
values
of
1.2-1.9
dm
3
·dm
-2·h-1
,
corresponding
to
about
0.5
mm·h
-1
.
In
the
dry
plot,
sap
flux
density
showed
a
higher
variability,
and
decreased
during
the
summer
to
a
mini-
mum
midday
value
of
0.05
dm
3
·dm
-2·h-1
.
Tree
transpiration
and
stomatal
conductance
showed
a
strong
reduction
in
association
with
drought
development,
during
which
the
predawn
water
potential
decreased
from
-0.4
to
-0.6
MPa.
Canopy
conductance
was
calculated
from
the
reverse
of
the
Penman-Monteith
equation
assuming
that
vapour
flux
over
the
stand
was
equal
to
the
estimated
stand
sap
flow.
Effects
of
climatic
factors
and
drought
on
canopy
conductance
variations
were
taken
into
account
in
a
multi-variable
transpiration
model.
transpiration
/ stomatal
conductance
/ canopy
conductance
/ water
potential
/ drought
/ sap
flow
/
Picea
abies
*
Correspondence
and
reprints.
Abbreviations:
Ψ
f:
twig
water
potential
(MPa);Ψ
pd
,
Ψ
m:
predawn
and
diurnal
minimal
twig
water
poten-
tial
(MPa),
respectively;
Fd:
xylem
sap
flux
density
(dm
3
·dm
-2·h-1);
F:
total
xylem
sap
flow
(dm
3
·h-1);
SA:
sapwood
area
(dm
2
);
Tw,
Td:
transpiration
of
watered
and
dry
plot
(mm·h
-1
,
mm·d
-1),
respec-
tively;
TM:
maximal
plot
transpiration
(mm·h
-1
,
mm·d
-1);
gs:
stomatal
conductance
(cm·s
-1);
gc:
canopy
conductance
to
water
vapour
(cm·s
-1);
VPD:
vapour
pressure
deficit
(Pa,
hPa);
Rg:
global
radiation
(W·m-2).
Résumé —
Relations
hydriques
chez
l’épicéa
commun
(Picea
abies
(L)
Karst)
soumis
à
une
sécheresse
édaphique
dans
les
Vosges :
potentiel
hydrique,
conductance
stomatique
et
trans-
piration.
Les
effets
du
dessèchement
du
sol
sur
le
flux
de
sève,
le
potentiel
hydrique
des
rameaux,
la
conductance
stomatique
et
du
couvert
ont
été
analysés
dans
2
placeaux
d’un
peuplement
d’épicéas
âgés
de
30
ans.
L’un
des
placeaux
a
été
soumis
à
une
sécheresse
par
couverture
du
sol,
le
second
ayant
été
irrigué.
Le
potentiel
hydrique
de
base
des
arbres
du
placeau
sec
est
descendu jusqu
à -1,2
MPa.
Dans
le
placeau
irrigué,
une
faible
variabilité
de
la
densité
de
flux
de
sève
a
été
observée
entre
les
arbres
mesu-
rés,
les
maxima
étant
de
l’ordre
de
1,2
à
1,9
dm
3
·dm
-2·h-1
,
ce
qui
correspondait
à
environ
0,5
mm·h
-1
.
Dans
le
placeau
desséché,
la
densité
de
flux
de
sève
a
diminué
tout
au
long
de
l’été
jusqu’à
atteindre
au
minimum
0, 05
dm
3
·dm
-2·h-1
pour
certains
arbres,
la
variabilité
entre
arbres
étant
beaucoup
plus
impor-
tante
que
chez
les
arbres
arrosés.
La
transpiration
ainsi
que
la
conductance
stomatique
ont
fortement
diminué
avec
la
sécheresse,
la
plus
grande
part
de
cette
réduction
ayant
été
observée
lorsque
le
poten-
tiel
hydrique
de
base
est
passé
de
-0,4
à
-0,6
MPa.
La
conductance
du
couvert,
calculée
en
inversant
la
formule
de
Penman-Monteith,
a
été
modélisée
au
moyen
d’un
modèle
multi-variable
prenant
en
compte
les
facteurs
climatiques
et
la
sécheresse
édaphique.
transpiration
/ conductance
stomatique
/ conductance
de
couvert / potentiel
hydrique
/ séche-
resse
/ flux
de
sève
/ Picea
abies
INTRODUCTION
Norway
spruce
is
one
of
the
most
important
coniferous
forest
species
used
for
timber
pro-
duction
in
Europe.
Extensive
ecophysiologi-
cal
studies
have
been
done
on
seedlings
and
saplings
of
this
species.
In
contrast,
only
lim-
ited
ecophysiological
investigations
have
been
reported
on
adult
spruce
under
field
conditions
(Schulze
et al,
1985;
Werk
et al,
1988;
Granier and
Claustres,
1989;
Schulze
et al,
1989;
Cienciala
et al,
1992),
and
these
studies
did
not
report
the
long-term
effects
of
limiting
soil
water
conditions.
During
the
1980s,
a
new
phenomenon
of
spruce
forest
decline
occurred
in
Europe,
especially
in
its
western
part.
Den-
dochronological
and
biogeochemical
inves-
tigations
in
the
Vosges
massif
(eastern
France)
suggested
that
the
decline
of
spruce
in
eastern
France
and
western
Germany
might
be
mainly
related
to
repeated
severe
drought
events
that
had
occurred
since
the
mid-1970s
in
these
regions
(Lévy
and
Becker,
1987;
Probst
et al,
1990).
Further
research
on
spruce
decline
therefore
requires
more
knowledge
of
the
ecophysio-
logical
behaviour
of
mountain
spruce
under
long-term
soil
drought.
In
a
forest
ecosystem,
transpiration
is
one
of
the
major
water
fluxes;
its
measurement
or
estimation
is
of
great
importance
for
forest
ecologists
and
hydrologists.
In
a
conifer
for-
est,
as
demonstrated
by
Tan
et
al
(1978)
and
Jarvis
and
McNaughton
(1986),
tran-
spiration
is
mainly
controlled
by
vapour
pres-
sure
deficit
(VPD)
and
stomatal
conductance.
At
the
stand
level,
canopy
conductance
is
considered
to
be
the
integration
of
all
the
stomatal
(including
the
boundary
layer)
con-
ductances
in
the
canopy.
If
transpiration
and
climatic
variables
are
known
over
the
same
time-scale,
canopy
conductance
can
be
derived
from
the
Penman-Monteith
equa-
tion
(Monteith,
1973).
However,
with
this
approach,
the
key
problem
is
to
determine
stand
transpiration.
In
this
study,
we
esti-
mate
canopy
transpiration
from
the
mea-
surement
of
xylem
sap
flow
with
a
method
suitable
for
adult
forest
trees.
In
1990,
in
the
framework
of
the
French
Forest
Decline
Research
Program
(DEFORPA),
extensive
ecophysiological
investigations
were
undertaken
in
a
Picea
abies
stand
at
the
Aubure
catchment
area
in
the
Vosges
with
the
following
objectives:
1)
to
examine
forest
canopy
transpiration
and
stomatal
behaviour
under
long-term
soil
water
deficit,
as
well
as
the
sensitivity
of
spruce
to
soil
drought
(for
this
point,
a
com-
parison
of
mountain-
and
plain-growing
Nor-
way
spruces
was
carried
out);
2)
to
anal-
yse
and
model
the
seasonal
variation
of
canopy
conductance
under
water
constraint;
and
3)
to
characterise
the
alteration
of
hydraulic
conductance
on
the
soil-leaf
path-
way
and
monitor
the
occurrence
of
xylem
cavitation
under
intensive
drought.
This
paper
reports
results
from
the
investigation
into
the
first
two
points;
the
hydraulic
func-
tioning
of
spruce
will
be
reported
in
a
forth-
coming
paper.
METHODS
Study
site
The
study
site
was
located
on
the
southern
slope
of
the
Aubure
catchment
area
at
a
mean
elevation
of
1
050
m.
This
catchment
is
situated
on
the
eastern
side
of
the
Vosges
mountains,
France
(7°15’E,
48°12’N)
and
lies
on
a
base-poor
gran-
ite
bedrock.
Annual
rainfall
is
about
1
500
mm
and
the
annual
average
air
temperature
is
6°C
(Viville
et al,
1987).
A
detailed
description
of
the
catchment
can
be
found
in
Probst
et
al
(1990).
The
spruce
stand
is
a
dense,
30-year-old
plan-
tation,
whose
main
characteristics
are
presented
in
table
I.
Projected
leaf
area
index
(LAI)
was
esti-
mated
through
2
independent
methods:
1)
the
relationship
between
sapwood
area
and
leaf
area
(Oren
et
al,
1986)
gave
a
value
of
5.6;
and
2)
direct
sampling
and
measurement
of
needle
dry
weight
(Le
Goaster,
1989)
gave
6.1.
Two
adjacent
plots
(water
stressed
(dry)
and
control
(watered))
were
selected
in
autumn
1989.
A
12-m-high
scaffolding
tower
was
set
up
in
each
plot.
In
the
dry
plot
(30
trees)
water
was
withheld
by
a
surrounding
trench
(1
m
deep)
and
a
plastic
roof
extending
2
m
above
soil
surface,
from
July
10
to
September
7
1990.
Because
a
natural
drought
occurred
in
this
region
during
the
exper-
iment,
the
watered
plot
was
irrigated
6
times
(total
58
mm)
in
July
and
August
1990.
Sap
flow
and
stand
transpiration
Xylem
sap
flux
density
(F
d,
dm
3
·dm
-2·h-1
)
was
measured
using
2-cm-long
continuously
heated
sap
flowmeters
(Granier,
1985,
1987)
on
4
trees
from
each
plot,
from
June
to
mid-October
1990.
The
sensors
were
connected
to
a
datalogger
(Campbell
Ltd,
21 X);
measurements
were
taken
every
10
s and
hourly
means
were
stored
for
fur-
ther
processing.
Total
sap
flow
(dm
3
·h-1
)
was
calculated
for
each
tree
by
multiplying
Fd
by
the
sapwood
cross-
sectional
area
(SA,
dm
2)
of
the
trees
at
the
sen-
sor
level.
SA
was
estimated
using
a
relationship
between
tree
circumference
(C)
and
SA,
estab-
lished
from
a
sampling
of
cores
on
the
surround-
ing
trees
(Granier,
1985;
Lu,
1992):
Hourly
stand
transpiration
(T,
mm·h
-1
)
was
computed
as:
where
SA
T
was
the
plot
sapwood
area
per
unit
of
ground
area
(31.9
m2
·ha
-1),
F
di
the
mean
sap
flux
density
of
trees
in
the
class
of
circumference
i,
pi
=
SA
i
/SA
T,
and
SA
i
the
sapwood
area
of
the
trees
in
the
class
of
circumference
i;
3
classes
were
used:
dominant
trees
(C
≥
55
cm);
codom-
inant
(40
≤
C
<
55
cm);
and
intermediate
plus
suppressed
trees
(C
<
40
cm).
The
characteristics
of
the
studied
trees
are
shown
in
table
I.
Daily
plot
sap
flow
(mm·d
-1
)
was
calculated
as
the
total
of
the
hourly
val-
ues.
Twig
water
potential
Twig
water
potential
was
measured
twice
a
month
on
3
one-year-old
twigs
from
each
of
the
studied
trees
(8
sap
flow
measured
trees
plus
2
additional
trees
from
the
dry
plot),
using
a
pres-
sure
chamber.
Twigs
were
sampled
in
the
upper
third
part
of
the
crown
just
before
dawn
(predawn
water
potential,
Ψ
pd
)
and
at
12:00
solar
time
during
sunny
days
(midday
water
potential,
Ψ
m
).
Throughout
the
study
period,
2
trees
in
each
plot
(No
66
and
49
from
the
dry
plot;
No
59
and
71
from
the
watered
plot)
were
selected
for
extensive
measurements
of
diurnal
courses
of
twig
water
potential.
These
trees
were
chosen
for
the
easy
access
to
their
crown
from
the
towers.
Stomatal
conductance
Midday
stomatal
conductance
(g
s)
was
measured
between
12:00
and
13:00
solar
time
on
7
sunny
days
(days
206,
213, 214, 220, 235,
255
and
284)
throughout
the
growing
season
using
a
Li-
Cor
1600
porometer
(Lincoln,
USA).
Four
exposed
sun
twigs
and
4
exposed
shade
twigs
were
selected
in
the
upper
half
of
the
crown
of
the
4
extensively
measured
trees.
Climatic
measurements
Climatic
factors
above
the
stand
(global
radia-
tion,
relative
humidity,
air
temperature
and
wind
speed)
were
measured
hourly
in
a
weather
station
500
m
from
the stand.
Incident
rainfall
and
throughfall
were
measured
weekly
in
a
cutting
and
in
the
watered
plot,
respectively.
Maximum
transpiration
(TM,
mm·h
-1
)
was
cal-
culated
hourly
from
the
climatic
data
using
the
Penman-Monteith
equation:
where:
s:
rate
of
change
of
saturation
vapour
pressure
(Pa·C
-1
)
Rn:
net
radiation
above
stand
(W·m
-2
)
G:
rate
of
change
of
heat
in
the
biomass,
plus
heat
in
the
soil
(W·m
-2
)
p:
density
of
dry
air
(kg·m
-3
)
Cp:
specific
heat
of
dry
air
at
constant
pressure
(J·kg
-1·C-1
)
VPD:
vapour
pressure
deficit
(Pa)
ga:
aerodynamic
conductance
(cm·s
-1
)
g
cm
:
maximum
(non-limiting
soil
water)
canopy
conductance
(cm·s
-1
)
λ:
latent
heat
of
vaporisation
of
water
(J·kg
-1
)
γ.
psychrometric
constant
(Pa·C
-1
)
In
this
study,
heat
flow
in
the
soil
was
not
mea-
sured
but
was
assumed
to
be
negligible.
Rn
was
calculated
as
75%
of
global
radiation
(unpub-
lished
data,
from
a
previous
experiment
in
a
spruce
stand
near
Nancy,
France).
Rate
of
stor-
age
of
heat
in
biomass
was
calculated
from
the
above-ground
estimated
biomass
and
from
hourly
changes
in
air
temperature
(Stewart,
1988).
Aero-
dynamic
conductance
(g
a)
was
calculated
using
the
logarithmic
equation
of
Monteith
(1973)
from
wind
speed
and
mean
height
of
the
stand
(12.6
m).
Daily
TM
(mm·d
-1
)
was
then
calculated
as
the
cumulated
values
of
hourly
TM.
The
maximum
canopy
conductance
(gcm
)
was
modelled.
It
was
first
calculated
hourly
from
sap
flow
(in
both
plots)
and
climatic
data
during
the
beginning
of
the
measurement
period
(days
164
to
190)
under
non-limiting
soil
water
conditions,
using
equation
[3].
It
was
assumed
that
vapour
flux
was
equal
to
the
stand
sap
flow
scaled
up
from
the
trees
sap
flow,
as
in
Cienciala
et
al
(1992).
The
first
tests
have
shown
a
1
h
time
lag
between
sap
flow
and
simulated
TM.
Thus,
max-
imum
canopy
conductance
was
recomputed
from
sap
flow
measured
over
hour
(h)
and
climatic
fac-
tors
measured
over
hour
(h -
1).
A
multiple
regression
was
made
on
hourly
daylight
data
over
the
period
of
days
165
to
190,
using
a
non-lin-
ear
model
close
to
the
equation
proposed
by
Lohammar
et
al
(1980):
with
g
cm
in
cm·s
-1
,
Rg
in
W·m
-2
,
and
VPD
in
hPa.
In
a
forest
stand,
g
cm
can
be
considered
in
the
first
approximation
as
the
average
of
leaf
stomatal
conductances
over
the
entire
canopy:
where
LAI·2.6
is
the
developed
leaf
area
index
of
the
stand
(Oren
et al,
1986).
Additional
experiment
Another
experiment
has
been
undertaken
previ-
ously
near
Nancy,
France
(6°14’E,
48°44’N,
ele-
vation
250
m)
on a
21-year-old
Norway
spruce
plantation.
The
stand
density
was
4
200
stems·ha
-1
,
average
tree
circumference
31.3
cm,
and
average
tree
height
11.3
m.
The
soil
was
a
Gleyic
luvisol
developed
on
loam.
This
experi-
ment
was
described
by
Granier
and
Claustres
(1989).
Sap
flow
and
xylem
water
potential
mea-
surements
were
performed
on
5
trees
from
dif-
ferent
crown
classes,
by
means
of
the
same
tech-
nique.
RESULTS
Twig
water
potential
variations
The
year
1990
was
characterised
by
a
rel-
atively
dry
spring
followed
by
an
exception-
ally
dry
summer
and
autumn
(Dambrine
et
al, 1992).
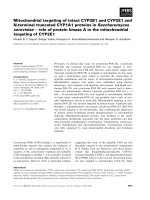
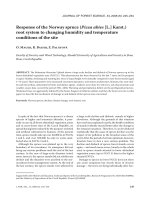
Figure
1
shows
the
seasonal
course
of
average
predawn
(Ψ
pd
)
and
midday
water
potential
(Ψ
m)
of
trees
in
the
dry
and
watered
plots.
Before
the
roof
was
put
in
place,
when
the
soil
was
well-watered,
the
Ψ
pd
values
in
watered
and
dry
plots
were
-0.55
and
-0.45
MPa,
respectively,
on
day
176.
Later,
a
slight
difference
(about
0.15
to
0.20
MPa)
was
noticed
between
both
plots,
probably
due
to
the
trench
which
immediately
provoked
a
decrease
in
soil
water
potential
in
the
dry
plot,
as
was
also
reported
by
Biron
(1994)
from
tensiometer
measurements.
During
the
following
drier
and
warmer
period
(days
190
to
238),
Ψ
pd
and Ψ
m
in
both
plots
first
decreased
gradu-
ally
and
concurrently
until
the
beginning
of
the
August.
Afterwards,
due
to
irrigation
in
the
watered
plot
(especially
on
days
220,
225
and
233),
the Ψ
pd
of
the
watered
plot
increased
and
remained
relatively
stable
around
-0.4
MPa.
In
contrast,
Ψ
pd
of
the
dry
plot
continued
to
decrease
gradually
to
about -1.0
MPa,
and
then
slightly
increased
due
to
several
rainfall
events
from
mid-
August
to
mid-September.
After
the
removal
of
the
roof
(September
15),
Ψ
pd
continued
to
decrease
in
both
plots
in
the
absence
of
rainfall
and
irrigation.
At
this
time,
trees
in
the
dry
plot
were
exposed
to
the
most
severe
drought
observed
in
this
experiment
(Ψ
pd
and
Ψ
m
were
-1.2
and
-2.0
MPa,
respectively).
Variations
of
Ψ
m
progressed
in
parallel
with Ψ
pd
,
with
a
difference
of
about
1.0
MPa.
Except
for
1
day
(day
235),
the
trees
in
the
dry
plot
revealed
a
more
negative
Ψ
m
than
those
in
the
watered
plot.
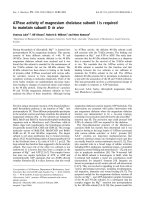
Daily
variations
of
sap
flux
density
(F
d)
Examples
of
diurnal
course
of
Fd
during
3
bright
days
over
the
season
are
shown
in
figure
2.
On
day
201,
under
high
water
availability
conditions
(Ψ
pd
= -0.29
MPa
in
the
watered
plot,
and
Ψ
pd
= -0.44
MPa
in
the
dry
plot),
Fd
courses
were
very
similar,
and
between-tree
variability
was
low.
Nev-
ertheless,
some
differences
could
be
noticed.
In
the
morning,
the
sharp
increase
in
sap
flux
densities
did
not
occur
at
the
same
time
for
all
the
trees,
and
some
of
them
displayed
their
maxima
earlier
than
others.
Throughout
the
season,
the
maxi-
mum
Fd
varied
between
1.2
and
1.9
dm
3
·dm
-2·h-1
,
according
to
the
trees.
Increasing
the
soil
water
deficit
induced
a
gradual
decrease
in
Fd
and
the
increase
in
between-tree
variability,
as
shown
on
days
217
and
235.
Under
the
driest
conditions
(eg,
on
day
235),
maximum F
d
(mean
Ψ
pd
=
-1.03
MPa)
dropped
to
very
low
values
(0.05-0.5
dm
3
·dm
-2·h-1),
while
Fd
in
the
watered
trees
remained
higher,
ranging
between
1.0
and
1.75
dm
3
·dm
-2·h-1
.
It
was
also
observed
that
the
2
dominant
trees
in
the
dry
plot
exhibited
a
much
lower
Fd
than
codominant
trees,
while
no
relationship
between
crown
status
and
Fd
was
appar-
ent
for
the
watered
trees.
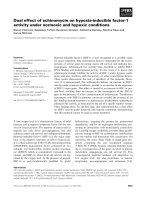
Diurnal
and
seasonal
courses
of plot
transpiration
Over
the
study
period,
5
diurnal
courses
of
plot
transpiration
(T
w,
Td
),
maximum
tran-
spiration
(TM)
and
average
twig
water
potential
(Ψ
f)
are
shown
in
figure
3,
to
illus-
trate
the
effects
of
increasing
soil
drought
on
plot
transpiration.
At
the
beginning
of
the
season,
transpiration
values
in
the
2
plots
were
similar,
with
maximal
transpiration
rates
at
midday
of
0.43
mm·h
-1
.
Significant
differences
between
the
2
plots
were
observed
under
the
higher
soil
water
deficit
(days
213
and
235).
For
example,
on
day
235,
transpiration
of
the
dry
plot
decreased
to
less
than
25%
of
that
of
the
watered
plot.
After
irrigation
(day
284),
transpiration
in
the
dry
plot
almost
recovered
to
a
similar
level
of
the
watered
plot.
As
shown
in
figure
1,
day
235
had
one
of
the
lowest
Ψ
pd
.
At
this
time,
comparable
values
of
Ψ
m
(about
-2.0
MPa)
were
observed
in
the
dry
and
watered
plots,
sug-
gesting
that
stomatal
closure
prevented
trees
in
the
irrigated
plot
from
developing
more
severe
water
stress.
It
was
also
observed
that
the
recovery
of
twig
water
potential
after
sunset
was
slow
under
severe
water
deficits
(fig
3,
day
235).
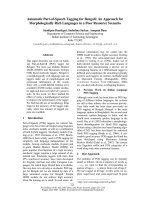
Seasonal
courses
of
daily
TM,
Tw
and
Td
are
shown
in
figure
4.
TM
was
higher
during
July
and
August
(from
days
190
to
235),
with
maximum
values
of
5.5
mm·d
-1
,
during
the
remainder
of
the
measure-
ment
period,
it
ranged
between
1.0
and
4.0
mm·d
-1
.
Plot
transpiration
rates
were
first
at
maximum
and
close
to
TM
from
days
160
to
195.
After
the
beginning
of
July
(day
200),
plot
transpiration
decreased
in
both
plots,
revealing
stomatal
closure.
Lower
transpi-
ration
rates
were
observed
in
the
dry
plot
where
Td
fell
to
0.08
mm·d
-1
.
In
the
watered
plot,
after
an
initial
decrease,
a
tendency
to
stabilise
from
days
210
to
225
was
observed,
the
maximum
transpiration
rate
being
around
2.5
mm·d
-1
.
The
ratios
Td
/TM
and
Tw
/TM
were
close
to
1
until
day
190;
afterwards,
Td
/TM
grad-
ually
decreased
to
0.2
at
the
end
of
August,
and
Tw
/TM
to
0.5,
just
before
irrigation
occurred.
Over
the
period
from
days
165
to
285,
the
total
sums
of
TM,
Tw
and
Td
were
252, 190
and
150
mm,
respectively.
Stomatal
control
of
trees
and
stand
transpiration
The
seasonal
course
of
stomatal
conduc-
tance
(g
s)
measured
at
midday
is
shown
in
figure
5.
Before
day
220,
stomatal
conduc-
tances
of
the
watered
trees
were
slightly
lower
than
those
in
the
dry
plot,
probably
resulting
from
the
sampling
done
at
different
crown
exposures
from
the
towers.
A
strong
decrease
of
gs
was
observed
during
July
and
August
in
both
plots,
but
it
was
more
pronounced
in
the
dry
plot.
Mean
gs
in
the
dry
plot
decreased
by
about
75%
from
the
beginning
(0.08
cm·s
-1
)
until
mid-August
(0.02
cm·s
-1),
while
in
the
watered
plot,
gs
remained
quite
stable,
around
0.05
cm·s
-1
.
After
the
rain
at
the
end
of
August
and
the
beginning
of
September,
and
rehydration
of
the
dry
plot,
the g
s
in
both
plots
recov-
ered
to
the
pre-stress
value.
The
decreases
in
the
ratios
T/TM
and
gs
were
well
correlated
with
the
decrease
of
predawn
water
potential
in
both
plots
(fig
6).
However,
most
of
the
decrease
in
gs
occurred
within
a
very
limited
change
in
predawn
water
potential
(between
-0.4
and
-0.6
MPa).
At the
stand
level,
drought
effects
were
taken
into
account
in
a
more
general
tran-
spiration
model
than
equation
[3].
Follow-
ing
Stewart
(1988),
it
was
assumed
that
variations
in
gc
could
be
modelled
as
the
product
of
a
maximum
canopy
conductance
function
(under
non-limiting
soil
water
con-
ditions,
modelled
as
in
equation
[4])
and
of
a
function
varying
between
0
and
1,
depend-
ing
on
soil
drought.
In
this
study,
predawn
water
potential
(Ψ
pd
)
was
taken
as
the
driv-
ing
variable.
Only
midday
data
were
used
in
order
to
be
compared
with
stomatal
con-
ductance
measurements.
As
previously
observed
for
gs
variations,
figure
6
shows
the
strong
dependence
of
gc
/gcm
on
predawn
water
potential.
A
non-linear
regression
was
made
between
gc
/gcm
and
Ψ
pd
over
the
period
of
dehydration
(from
day
206
to
235):
Simultaneous
variations
of
gc
and
gs
(midday
values)
in
the
dry
plot
are
shown
on
figure
7.
A
good
agreement
between
both
courses
is
observed;
the
ratio
between
gc
and
gs
corresponded
approximately
to
the
developed
leaf
area
of
the
stand,
as
stated
in
equation
[5].
DISCUSSION
Under
non-limiting
water
conditions,
the
maximum
hourly
sap
flux
density
of
the
stud-
ied
trees
varied
from
1.2
to
1.9
dm
3
·dm
-2·h-1
,
which
was
similar
to
the
val-
ues
reported
in
another
study
on
the
same
species,
1.4-2.2
dm
3
·dm
-2·h-1
(Granier
and
Claustres,
1989).
Cienciala
et al (1992)
have
measured
maximum
daily
sap
flux
densi-
ties
of
16
kg·dm
-2·d-1
,
which
is
in
the
same
range
than
our
values.
Between-tree
differ-
ences
in
Fd
measured
in
our
study
could
be
attributed
to
the
heterogeneity
in
crown
exposure
conditions.
We
have
not
found
any
relationship
between
Fd
and
crown
sta-
tus
for
the
watered
trees;
dominant
trees
did
not
exhibit
higher
transpiration
rates
than
codominant
trees.
But
under
decreasing
soil
water
availability,
the
Fd
values
of
the
biggest
trees
were
much
lower
than
the
Fd
of
the
codominant
trees,
indicating
a
higher
soil
water
depletion
by
the
dominant
trees.
The
minimum
Ψ
pd
observed
in
this
study
was
about
-1.4
MPa,
and
Ψ
m
never
decreased
below -2.5
Mpa.
This
minimum
value
of
Ψ
m
coincided
with
the
threshold
of
water
potential
inducing
a
significant
xylem
cavitation
for
this
species
(Cochard,
1992;
Lu,
1992).
The
mechanism
of
stomatal
clo-
sure
prevented
spruce
from
xylem
dys-
function.
Assessment
of
the
sensitivity
of
stomata
to
soil
water
deficit
was
one
of
the
principal
goals
of
this
study.
The
relative
reduction
of
gs
due
to
the
decline
of
Ψ
pd
reported
here
was
comparable
to
what
we
observed
on
spruce
growing
under
similar
conditions,
in
a
stand
located
in
central
Germany
(Lu,
unpublished
results):
gs
was
reduced
to
about
50%
of
its
initial
value
when
Ψ
pd
declined
from
-0.4
to
-0.8
MPa.
Direct
comparison
of
stomata
sensitivity
to
drought
between
plain
and
mountain
condi-
tions
is
difficult,
because
little
data
are
avail-
able
for
spruce
growing
on
the
plain.
How-
ever,
comparison
between
the
ratio
of
stand
transpiration
to
Penman
potential
evapo-
transpiration
(T/PET)
of
the
mountain
ver-
sus
the
plain
stands
showed
a
much
lower
sensitivity
to
soil
drought
in
the
latter
than
in
the
former.
When Ψ
pd
decreased
from
-0.4
to
-0.7
MPa,
the
reduction
of
T/PET
ratio
was
only
of
20%
in
the
plain
stand,
com-
pared
to
50%
in
the
mountain
stand.
Nev-
ertheless,
we
cannot
attribute
this
difference
to
an
intrinsic
difference
in
the
stomatal
behaviour,
because
soil
and
rooting
char-
acteristics
differ
dramatically
between
both
sites.
Our
mountain
stand
was
located
on a
shallow
sandy
soil,
with
the
roots
vertically
limited
by
the
bedrock.
In
such
a
site,
soil
water
depletion
develops
very
rapidly,
and
therefore
a
partially
desiccated
root
system
could
quickly
induce
stomatal
closure,
con-
trolled
through
a
biophysical
and/or
bio-
chemical
communication
between
roots
and
leaves
(Zhang
and
Davies,
1989;
Malone,
1993).
Moreover,
care
must
be
taken
with
the
use
of
predawn
water
potential
as
a
driv-
ing
variable
of
stomatal
closure.
Under
field
conditions,
Ψ
pd
does
not
always
seem
to
be
the
best
indicator
of
the
water
stress
actually
experienced
by
plants
(Reich
and
Hinckley,
1989;
Améglio,
1991).
A
large
decrease
of
gs
with
only
a
limited
variation
in
Ψ
pd
was
observed
here,
especially
for
trees
in
the
watered
plot
(fig
6).
This
phenomenon
has
also
been
reported
on
the
same
species
by
Cienciala
et al (1994)
and
in
several
broad-
leaved
species
such
as
oak
(Bréda
et
al,
1993).
When
the
soil
is
drying,
the
upper
layers
may
dehydrate
without
noticeable
change
in
Ψ
pd
.
We
have
shown
that
during
a
rainless
period,
transpiration,
gs
and
gc
are
well
correlated
with Ψ
pd
(see
fig
6
for
the
dry
plot).
However,
under
variable
weather
conditions,
when
some
soil
layers
were
dry
and
others
humid
(eg,
after
small
rain
events
or
irrigation),
the
implication
of Ψ
pd
is
ques-
tionable.
So
far,
there
is
no
clear
relation-
ship
between Ψ
pd
and
heterogeneity
of
water
availability
in
the
soil,
and
it
is
unclear
how
the
stomatal
aperture
is
controlled
in
this
case.
Therefore,
more
investigations
are
needed
concerning
the
significance
of
Ψ
pd
under
field
conditions.
As
demonstrated
by
McNaughton
and
Black
(1973),
for
a
conifer
stand
under
non-
limiting
soil
water
conditions,
VPD
is
the
major
factor
determining
tree
transpiration,
because
of
a
much
smaller
canopy
con-
ductance
than
aerodynamic
conductance,
and
hence
a
high
degree
of
coupling
between
canopies
and
the
atmosphere
(Tan
et al,
1978;
Jarvis
and
McNaughton,
1986;
Granier
and
Claustres,
1989).
Except
in
the
morning
(when
light
is
limiting),
during
the
course
of
a
day,
transpiration
is
strongly
lim-
ited
by
stomatal
conductance
and
its
resp-
ponse
to
VPD
variations.
Zimmermann
et
al (1988)
have
indicated
the
same
negative
dependence
of
stomatal
conductance
to
VPD
regardless
of
needle
age.
Results
from
the
calculation
of
the
canopy
conductance
(equation
[5])
showed
that
gc
decreased
by
about
50%
as
VPD
increased
from
0.5
to
1.5
kPa,
with
Rg
ranging
between
500
and
1
000
W·m
-2
;
in
the
spruce
stand
located
in
the
plain,
we
have
observed
the
same
dependence
of
gc
to
VPD
(Granier,
unpub-
lished
results).
As
previously
emphasised,
soil
water
deficit
strongly
reduced
canopy
conductance,
decreasing
to
less
than
15%
of
its
initial
value
as
Ψ
pd
declined
from
-0.4
to
-1.0
MPa
(fig
6).
Maximum
midday
stomatal
conductance
values
(about
0.1
cm·s
-1
)
were
compara-
ble
to
data
reported
in
other
studies
for
adult
spruce
under
field
conditions
(Schulze
et
al,
1985;
Claustres,
1987).
Canopy
con-
ductance
variations
calculated
from
sap
flow
were
in
good
agreement
with
variations
of
stomatal
conductance
(fig
7),
even
if
they
were
only
measured
in
the
upper
half
of
the
tree
crowns
on
young
needles.
Sap
flow
measured
on
a
representative
sample
of
trees
within
a
stand
thus
appears
to
be
a
valuable
method
for
estimating
canopy
con-
ductance.
A
slow
recovery
rate
of
twig
water
poten-
tial
after
sunset
under
high
water
deficit
con-
ditions
(eg,
day
235
in
fig
3)
was
observed.
This could
be
explained
by
modifications
of
hydraulic
properties
within
the
root
zone,
where
drought
induces
a
high
water
poten-
tial
gradient
during
drought,
while
water
movement
is
strongly
limited
by
increasing
soil
hydraulic
resistance.
Further
investiga-
tions
were
done
on
this
question
and
have
shown
an
important
decline
of
hydraulic
con-
ductance,
mainly
located
at
the
soil-root
interface
(Lu,
1992).
REFERENCES
Améglio
T
(1991)
Relations
hydriques
chez
le
jeune
Noyer,
de
l’échelle
de
la
journée
à
celle
de
l’année,
en
liaison
avec
quelques
aspects
de
la
physiologie
de
l’arbre.
Thèse
de
3e
cycle,
Université
Clermont
II,
France,
99
p
Biron
P
(1994)
Le
cycle
de
l’eau
en
forêt
de
moyenne
montagne :
flux
de
sève
et
bilans
hydriques
station-
nels
(bassins
versant
du
Strengbach
à
Aubure,
Hautes-Vosges).
Thèse,
université
de
Strasbourg,
France,
114
p
Bréda
N,
Cochard
H,
Dreyer
E,
Granier
A
(1993)
Water
transfer
in
a
mature
oak
stand
(Quercus
petraea):
seasonal
evolution
and
effects
of
a
servere
drought.
Can
J For
Res
23, 1136-1143
Cienciala
E,
Lindroth
A,
Cermark
J,
Hällgren
JE,
Kucera
J
(1992)
Assessment
of
transpiration
estimates
for
Picea
abies
trees
during
a
growing
season.
Trees
6, 121-127
Cienciala
E,
Lindroth
A,
Cermark J,
Hällgren
JE,
Kucera
J
(1994)
The
effects
of
water
availability
on
transpi-
ration,
water
potential
and
growth
of
Picea
abies
during
a
growing
season.
J Hydrol 155, 57-71
Claustres
JP
(1987)
Caractérisation
du
fonctionnement
hydrique
d’épicéas
en
peuplement
fermé :
con-
séquences
d’une
éclaircie.
DEA
Dissertation,
uni-
versité
de
Nancy
I,
France,
46
p
Cochard
H
(1992)
Vulnerability
of
several
conifers
to
air
embolism.
Tree
Physiol
11,
73-83
Dambrine
E,
Carisey
N,
Pollier
B
et al (1992)
Dynamique
des
éléments
minéraux
dans
la
sève
xylémique
d’un
peuplement
d’épicéas
dépérissants.
Ann
Sci For49,
489-510
Granier
A,
Claustres
JP
(1989)
Relations
hydriques
dans
un
épicéa
(Picea
abies
L)
en
conditions
naturelles :
variations
spatiales.
Acta
Oecol,
Oecol
Plant
10,
295-310
Granier
A
(1985)
Une
nouvelle
méthode
pour
la
mesure
du
flux
de
sève
brute
dans
le
tronc
des
arbres.
Ann
Sci For 42,
193-200
Granier
A
(1987)
Evaluation
of
transpiration
in
a
Dou-
glas
fir
stand
by
means
of
sap
flow
measurements.
Tree
Physiol 3,
309-320
Jarvis
PG,
McNaughton
KG
(1986)
Stomatal
control
of
transpiration:
scaling
up
from
leaf
to
region.
Adv Ecol
Res
15, 1-48
Le
Goaster
S
(1989)
Influence
de
la
croissance
d’un
peuplement
sur
le
prélèvement
en
elements
minéraux;
relations
avec
le
dépérissement.
Mémoire
ENITEF,
France,
50
pp
Lévy
G,
Becker
M
(1987)
Le
dépérissement
du
sapin
dans
les
Vosges :
rôle
primordial
de
deficits
d’ali-
mentation
en
eau.
Ann
Sci For 44,
403-416
Lohammar T,
Larsson
S,
Linder S,
Falk
SO
(1980)
FAST
—
simulation
models
of
gaseous
exchange
in
Scots
pine.
Ecol
Bull
(Stockholm)
32,
505-523
Lu
P
(1992)
Ecophysiology
and
reaction
to
drought
of
three
conifer
species
(Abies
alba
Miller,
Picea
abies
(L)
Karsten
and
Pinus
sylvestris
L);
effect of
age.
PhD
Thesis,
University
of
Nancy
I,
France,
204
pp
Malone
M
(1993)
Hydraulic
signals.
Phil
Trans
R
Soc
B
(Lond)
341,
33-39
McNaughton
KG,
Black TA
(1973) Evapotranspiration
from
a
forest:
a
micrometeorological
study.
Water
Resour Res 9, 1579-1590
Monteith
JL
(1973)
Principles
of Environmental
Physics.
Edward
Arnold,
London,
UK,
241
pp
Oren
R,
Schulze
ED,
Matyssek
R,
Zimmermann
R
(1986)
Estimating
photosynthetic
rate
and
annual
carbon
gain
in
conifers
from
specific
leaf
weight
and
leaf
biomass.
Oecologia 70, 187-193
Oren
R,
Werk
KS,
Schulze
ED
(1986)
Relationships
between
foliage
and
conducting
xylem
in
Picea
abies
(L) Karst.
Trees
1, 61-69
Probst
A,
Dambrine
E,
Viville
D,
Fritz
B
(1990)
Influence
of
acid
atmospheric
inputs
on
surface
water
chemistry
and
mineral
fluxes
in
a
declining
spruce
stand
within
a
small
granitic
catchment
(Vosges
massif,
France).
J Hydrol 116, 100-124
Reich
PB,
Hinckley
TM
(1989)
Influence
of
pre-dawn
water
potential
and
soil-to-leaf
hydraulic
conduc-
tance
on
maximum
daily
leaf
diffusive
conductance
in
two
oak
species.
Funct
Ecol 3,
719-726
Schulze
ED,
Cermak
J,
Matyssek
R
et al (1985)
Canopy
transpiration
and
water
fluxes
in
the
xylem
of
the
trunk
of
Larix
and
Picea
trees:
a
comparison
of
xylem
flow,
porometer
and
cuvette
measurements.
Oecolo-
gia
66,
475-483
Schulze
ED,
Lange
OL,
Oren
R
(1989)
Forest
decline
and
air
pollution:
a
study
of
spruce
(Picea
abies)
on
acid
soils.
Ecological
studies,
vol
77,
Springer-Ver-
lag,
Berlin,
Germany
Stewart
JB
(1988)
Modelling
surface
conductance
of
pine
forest.
Agric
For
Meteorol 43,
19-35
Tan
CST,
Black
TA,
Nnyamah
JU
(1978)
A
simple
dif-
fusion
model
of
transpiration
applied
to
a
thinned
Douglas
fir
stand.
Ecology 59,
1221-1229
Viville
D,
Ambroise
B,
Probst
et al
(1987)
Le
bassin
ver-
sant
du
Strengbach
à
Aubure
(Haut-Rhin,
France)
pour
l’étude
du
dépérissement
forestier
dans
les
Vosges
(Programme
DEFORPA).
I.
Équipement
cli-
matique,
hydrologique,
hydrochimique.
In:
Proc
Int
Symposium
Air
Pollution
and
Ecosystems,
Greno-
ble,
Reidel
publishing
company,
France,
823-828
Werk
KS,
Oren
R,
Schulze
ED,
Zimmermann
R,
Meyer
J
(1988)
Performance
of
two
Picea
abies
(L)
Karst
stands
at
different
stages
of
decline.
III.
Canopy
tran-
spiration
of
green
trees.
Oecologia 76, 519-524
Zhang
J,
Davies
WJ
(1989)
Abscissic
acid
produced
in
dehydrating
roots
may
enable
the
plant
to
measure
the
water
status
of
the
soil.
Plant
Cell
Environ
12,
73-81
Zimmermann
R,
Oren
R,
Schulze
ED,
Werk
KS
(1988)
Performance
of
two
Picea
abies
(L)
Karst
stands
at
different
stages
of
decline.
II.
Photosynthesis
and
leaf
conductance.
Oecologia 76, 513-518