Báo cáo khoa học: "Border effects and size inequality in experimental even-aged stands of poplar clones (Populus)" pptx
Bạn đang xem bản rút gọn của tài liệu. Xem và tải ngay bản đầy đủ của tài liệu tại đây (443.9 KB, 8 trang )
Original
article
Border
effects
and
size
inequality
in
experimental
even-aged
stands
of
poplar
clones
(Populus)
P
van
Hecke
R Moermans
F Mau
J
Guittet
1
Universitaire
Instelling
Antwerpen,
Departement
Biologie,
Universiteitsplein
1, B-2610
Wilrijk;
2
Rijkscentrum
voor
Landbouwkundig
Onderzoek,
Burgemeester
Van
Gansberghelaan
96,
B-9220
Merelbeke,
Belgium;
3
Université
de
Paris-Sud,
laboratoire
d’écologie
végétale,
91405
Orsay,
France
(Received
3
January
1994;
accepted
29
June
1994)
Summary—
Five
poplar
clones
were
studied
in
short
rotation
intensively
cultured
(SRIC)
plantations
in
Belgium
(Afsnee)
and
in
France
(Orsay).
Unrooted
cuttings
were
planted
with
a
single
spacing
of
0.8
x
0.8
m,
using
81
or
25
trees
per
cultivar
(density
=
15 625
trees/ha).
The
height
of
stems
was
measured,
while
the
size
inequality
of
each
stand
was
examined
with
the
Gini
index
(G)
and
the
coefficient
of
vari-
ation
(CV).
At
both
sites
the
G
values
reflected
very
high
size
equality,
whereas
some
border
effect
was
found
along
the
southern
side
(r
9:
row
9)
of
the
Afsnee-stands.
D’Agostino-Pearson K
2
/
Gini
index
/
height
/
Lorenz
curve
/
unplanned
multiple
comparison
method
Résumé —
Effet
de
bordure
et
inégalité
de
taille
dans
5
clones
de
peuplier
(Populus)
installés
dans
des
plantations
expérimentales
équiennes.
Cinq
clones
de
peuplier
ont
été
étudiés
en
taillis
à
courtes
rotations
en
Belgique
(Afsnee)
et
en
France
(Orsay).
Au
total
81
(Afnee)
respectivement
25
(Orsay)
boutures
sans
racines
ont
été
plantées
pour
chaque
clone
à
un
espacement
fixe
de
0,8
x
0,8
m
(densité
=
15 625
arbres/ha).
La
hauteur
des
tiges
a
été
mesurée.
L’inégalité
de
la
taille
de
chaque
clone
a
été
examinée
avec
l’indice
de
Gini
(G)
et
le
coefficient
de
variation
(CV). À
Afsnee
(tableau
I) de
même
qu’à
Orsay
(tableau
II),
les
valeurs
de
G
montrent
une
très
grande
égalité
de
taille,
tandis
qu’un
effet
de
bordure
est
démontré
le
long
du
côté
sud
(r
9
=
rangée
9)
des
plantations
à
Afsnée
(fig
1).
D’Agostino-Pearson
K2
/ courbe
de
Lorerz/hauteur/indice
de
Gini / méthode
non-planifiée
de
comparaisons
multiples
INTRODUCTION
The
development
of
plants
within
experi-
mental
plots
is
partially
determined
by
exter-
nal
factors,
one
of
which
is
the
border
or
edge
effect.
Various
crops
have
already
been
studied
in
this
regard,
eg,
soybean
(Hartwig
et al,
1951),
cotton
(Green,
1956),
rice
(Gomez
and
De
Datta,
1971),
wheat
(Konovalov
and
Loshakova,
1980),
Norway
spruce
(Gaertner,
1983)
and
poplar
(Hansen,
1981;
Zavitkovski,
1981;
Bisoffi,
1988).
Moreover,
Cannell
and
Smith
(1980)
state
that
the
border
effect
is
always
pre-
sent
and
point
out
that
it
can
have
a
large
impact
upon
the
estimation
of
yields.
Accord-
ing
to
Hansen
(1981),
"
the
necessary
border
width
[is]
the
distance
inward
from
the
plot edge
to
a
point
at
which
there
is
no
further
tree
height
growth
gradient".
When
drip
irrigation
and
fertilization
were
suffi-
ciently
supplied
both
on
the
plot
and
far
beyond
the
unplanted
alley,
only
canopy
competition
for
light
can
be
responsible
for
the
development
of
a
border
width
and
a
homogeneous
plot
center.
In
our
case
irri-
gation
water
and
fertilizers
were
sufficiently
and
uniformly
supplied
but
only
on
the
plots
themselves.
Plot
yield
estimations
are
affected
by
the
development
of
each
individual
within
a
par-
ticular
stand.
This
development
may
be
influ-
enced
by
other
factors,
eg,
the
availability
of
limiting
resources.
This
may
be
the
origin
of
size
hierarchies
of
individuals.
The
con-
cept
of
’size
inequality’
(Weiner
and
Solbrig,
1984)
can
be used
for
describing
these
size
hierarchies.
The
increasingly
dispropor-
tionate
use
of
resources
between
the
taller
and
the
smaller
individuals
results
in
a
grow-
ing
one-sided
competition
(Firbank
and
Watkinson,
1990)
and
at
the
same
time
in
a
growing
size
inequality.
The
objectives
of
this
paper
are
twofold:
(1)
to
characterize
a
number
of
poplar
cul-
tivars
by
some
statistical
parameters
(ie
size
inequality);
and
(2)
to
assess
the
border
effect
in
experimental
plots
as
influenced
by
both
the
N-S
gradient
and
the
position
of
individual
trees.
MATERIALS
AND
METHODS
Study
areas
A
short
rotation
intensively
cultured
(SRIC)
plan-
tation
of
poplar
(Populus
sp)
was
grown
at
the
location
of
Afsnee
(51°
° 02’N,
03°
39’
E)
in
Bel-
gium,
in
a
fenced
plot
of
10
x
70
m
on
a
loamy
sand
soil.
Dormant
unrooted
hardwood
cuttings
were
planted
in
April
1987,
after
being
submerged
in
water
for
48
h
in
complete
darkness.
The
crite-
ria
for
the
selection
of
the
cultivars
were
disease
resistance,
photoperiodic
response,
cold
resis-
tance
and
productivity.
The
following
clones
were
used:
Robusta
(ROB)
as
a
reference
clone;
Fritzi
Pauley
(FRI);
Columbia
River
(COL);
Beaupré
(BEA);
and
Raspalje
(RAS).
Details
about
the
clones
(scientific
names,
places
of
origin,
pro-
ductivity
range,
parentage)
were
given
in
Ceule-
mans
et al (1984).
Eighty-one
cuttings
per
clone
were
set
out
in
a
9
x
9
square
planting
pattern
with
a
single
spacing
of
0.8
x
0.8
m.
Each
clonal
block
was
surrounded
by
an
unplanted
alley
of
1.5-1.6
m
width.
Weed
control
was
achieved
either
by
mechanically
shallow
ploughing
or
by
herbicides
(Simazine
and
Glyphosate).
Fluctua-
tions
of
the
groundwater
table
were
controlled
with
1
piezometer
per
clonal
block.
At
the
location
of
Orsay
(48°42’N,
02°12’E,
near
Paris
at
about
280
km
SSW
of
Afsnee)
in
France,
another
SRIC
plantation
was
established
at
the
same
time
in
blocks
of
5
cuttings
x
5
rows.
Three
clones
were
retained:
ROB,
BEA
and
RAS.
Weeds
were
removed
by
hand.
At
the
end
of
the
first
year,
the
stems
were
harvested
as
well
as
the
coppice
shoots
at
the
end
of
the
third
year
(1989).
Measurements
In
the
period
1987-1989
the
stem
height
at
Afsnee
was
measured
every
3
weeks
with
a
dou-
ble
meter
rule,
a
5
m
iron
stick
or
a
7
m
aluminium
telescopic
pole
(Téléscomètre
TM7-Le
Pont
Equipments),
depending
on
the
developmental
phase
of
the
stands.
Data
on
height
at
Orsay
were
collected
on
the
longest
shoot
of
each
cop-
pice
stool.
At
Afsnee,
however,
only
the
stem
was
involved.
Only
end-of-growing-season
(Octo-
ber-December)
measurements
are
analysed
sta-
tistically
in
this
paper.
Data
processing
The
height
data
for
the
trees
that
died
(n
=
14)
during
the
first
year
were
substituted
by
the
means
of
the
immediate
neighbors.
The
following
statistics
were
calculated:
mean;
standard
deviation;
95%
confidence
limits;
the
coefficient
of
variation
(CV);
and
the
Fisher’s
coef-
ficients,
completed
with
the
K2
-statistic
as
pro-
posed
by
D’Agostino
et al (1990).
Skewness
was
described
by
Z((b
1)
0.5
)
where
(b
1)
0.5
is
Fisher’s
coefficient
and
Z((b
1)
0.5
)
the
corresponding
approximate
normally
distributed
statistic.
Kurto-
sis
was
described
by
Z(b
2)
where
b2
is
the
Fish-
er’s
coefficient
and
Z(b
2)
the
corresponding
approximate
normally
distributed
statistic.
Com-
bination
of
both
statistics
yields
K2,
which
allows
detection
from
normality
due
to
either
skewness
or
kurtosis.
Homoskedasticity
between
rows
was
tested
with
Bartlett’s
procedure
(in
the
case
of
normal
distribution)
or
the
Scheffé-Box
test
(in
the
case
of
non-normal
distribution,
Sokal
and
Rohlf,
1981).
In
the
former
case,
either
the
F-test
or
the
GH-test
(Games
and
Howell,
1976)
could
be
applied
on
the
row
means
depending
on
homogeneity
or
heterogeneity
of
the
variances.
If
the
F-test
was
significant,
the
Tukey
test
was
used.
The
non-
parametric
sum
of
squares
simultaneous
test
pro-
cedure
(SSSTP,
Sokal
and
Rohlf,
1981)
protected
the
Kruskal-Wallis
test
in
the
case
of
a
non-nor-
mal
distribution
and
homogeneous
variances.
With
homogeneous
variances
only
extreme
skew-
ness
should
be
a
problem
for
the
application
of
parametric
one-way
ANOVA
and
unplanned
mul-
tiple
comparison
procedures
(UMCPs).
A
precise
limit
for
the
concept
extreme
does
not
exist,
how-
ever,
so
we
preferred
a
very
stringent
but
clear
condition.
Therefore,
if
1
row
out
of
a
set
of
rows
proved
to
be
non-normally
distributed
at
the
5%
level
or
lower,
the
whole
set
was
further
anal-
ysed
with
nonparametric
tests.
However,
follow-
ing
Day
and
Quinn
(1989),
we
avoided
"overre-
liance
on
the
religion
of
significance".
Testing
the
means
of
the
central
trees
and
the
northern
and
southern
rows
as
components
of
the
inner
and
outer
border
(at
Afsnee
r1
= row
1,
r2
=
row
2,
r8
= row
8
and
r9
=
row
9;
at
Orsay
r1
=
row
1
and
r5
= row
5)
was
carried
out
as
described
above
at
Afsnee
and
with
the
Mann-Whitney
test
at
Orsay
(Siegel
and
Castellan,
1988).
Because
each
central
block
at
Afsnee
consisted
of
5
trees
x
5
rows,
comparison
of
the
northern
rows
r1
and
r2
with
the
southern
rows
r8
and
r9
was
only
made
considering
the 3rd
to
the
7th
individuals
of
those
rows
(the
2nd
to
the 4th
individuals
at
Orsay).
Size
inequality
was
measured
by
means
of
the
coefficient of
variation
(CV)
and
the
Gini
index
(G)
(Sen,
1973;
Egghe
and
Rousseau,
1990).
If
perfect
quality
occurs
(G
= 0),
the
Lorenz
curve
is
restricted
to
a
diagonal;
otherwise,
the
data
curve
is
convex
and
G
=
1
when
size
inequality
is
per-
fect.
The
Gini
index
is
given
by:
where
n
=
number
of
trees,
μ
= stand
mean,
yi
(i
= 1, 2,
n - 1, n) = value
for
the
ith
mea-
surement
of
height
and
y1
>
yi
>
>
yn.
According
to
Rousseau
(1992)
the
concen-
tration
measures
CV and
G
meet
the
3
axioms
of
permutation
invariance,
scale
invariance
and
the
Dalton-Pigou
principle
of
transfers.
Mutual
comparison
of
concentration
measures
was
cal-
culated
with
the
Spearman
rank
correlation.
RESULTS
AND
DISCUSSION
General
statistics
The
stands
of
Afsnee
did
not
differ
from
those
at
Orsay
as
regards
plant
spacing,
but
they
did
in
the
total
number
of
individu-
als,
81
vs
25.
At
the
end
of
each
growing
season
at
Afsnee
(table
I),
the
group
of
clones
FRI
+
BEA
+
RAS
belonged
to
the
taller
clones
on
average;
ROB
was
always
the
shortest.
The
95%
confidence
interval
of
BEA
did
not
over-
lap
with
RAS.
The
highest
CV
values
occurred
in
the
first
year,
the
lowest
in
the
(RAS
8.9%
and
FRI
9.1 %).
Similar
values
were
quoted
in
Benjamin
and
Hard-
wick
(1986)
who
found
7.5%
for
plants
grown
in
phytotron.
The
negative
skewness
values
Z((b
1)
0.5
)
indicated
that
there
were
fewer
smaller
trees
and
more
taller
trees
than
expected.
In
our
poplar
stands
these
values
generally
increased
with
time,
certainly
at
Afsnee.
This
could
mean
that
energy
was
supplied
more
for
primary
than
for
secondary
growth
of
the
stem.
Considering
the
kurtosis
statis-
tic
Z(b
2
),
leptokurtic
curves
occurred
only
once
in
1987,
3 times
in
1988
and
5
times
in
1989.
With
exception
of
3
cases
(ROB
and
COL
1987,
RAS
1988)
the
K2
statistic
was
always
significant
and
the
height
distribu-
tion
at
Afsnee
was
skewed
to
the
left
and
heavy
in
the
tails.
At
Orsay
(table
II),
the
clone
ROB
was
always
the
lowest
at
the
end
of
each
sea-
son.
Here
too
the
95%
confidence
intervals
of
BEA
and
RAS
did
not
overlap.
Tree
height
was
always
normally
distributed
in
ROB,
but
only
during
the
first
year
in
BEA
and
RAS.
The
data
could
be
interpreted
in
the
same
way
as
those
at
Afsnee
in
1988
and
1989.
The
differences
between
the
2
sites
could
be
attributed
to:
1)
competition
for
light,
because
during
the
second
growing
sea-
son
the
canopy
at
Afsnee
closed
about
1
month
earlier
than
at
Orsay;
and
2)
the
high
level
of
the
groundwater
table
at
Orsay
dam-
aged
the
clones
FRI
and
COL
in
such
a
way
that
neither
could
be
included
in
this
study.
Border
effects
The
global
stand
No
differences
between
the
row
means
in
the
global
stands
of
BEA
and
RAS
could
be
detected
at
Afsnee
(table
I).
The
95%
con-
fidence
intervals
separated
the
outermost
row
r9
from
the
other
rows,
but
only
in
ROB
1988
and
1989
and
COL
1988.
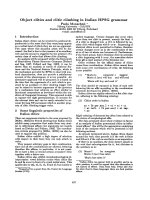
Figure
1
represents
these
intervals
for
COL
1988.
This
could
be
the
result
of
direct
exposition
to
full
sunlight
and
an
increased
loss
of
upper
soil
water
through
evaporation.
This
suggests
that
a
border
effect
was
present
from
the
second
year
onwards.
There
was
a
significant
difference
between
the
row
medians
in
a
single
case
(BEA,
1987)
at
Orsay
(table
II).
In
8
cases
the
Kruskal-Wallis
test
(H)
was
significant
at
least
at
the
5%
level.
Out
of
these
8
cases
the
nonparametric
SSSTP-
test
could
be
applied
7
times
(for
N
>
8 and
equal
sample
sizes).
This
test
could
detect
5
times
a
significant
difference
between
row
medians.
This
only
happened
if
the
H
statis-
tic
was
significant
at
either
the
1 %
or
the
0.1 %
level.
Consequently,
this
SSSTP-test
was
not
always
appropriate
when
protected
by
the
Kruskal-Wallis
test.
Central
and
border
trees
After
3
years
the
trees
of
the
central
blocks
showed
the
following
height
sequence
at
both
Afsnee
and
Orsay:
(FRI)
>
BEA
>
RAS
>
(COL)
>
ROB.
The
25
central
trees
of
each
clone
at
Afsnee
were
a
good repre-
sentative
block
for
the
selection
of
a
few
model
trees
(Mau
et al,
1991),
because
they
were
not
different
from
the
reduced
inner
border
rows r
2
and
r8.
With
regard
to
the
reduced
outer
border
rows r
1
and
r9
we
got
a
different
picture.
The
central
trees
of
ROB,
BEA
and
RAS
had
a
similar
height
to
the
outermost
trees,
but
the
height
of
FRI
(1988-1989)
and
COL
1989
were
higher
than
the
outermost
ones.
Although
Zavit-
kovski
(1981)
believed
that
border
trees
start
to
have
a
growth
advantage
to
inside
trees
when
the
canopies
close,
the
Afsnee
hybrid
poplars
already
reached
a
leaf
area
index
(LAI)
of
4
(assumed
to
be
the
lower
limit
for
a
closed
canopy)
in
the
month
of
June
of
the
second
year
(1988)
and
the
excepted
growth
advantage
was
only
encountered
in
RAS.
In
contrast
with
Afsnee,
no
differences
were
noted
in
the
3
Orsay
cultivars
except
in
the
first
year
(1987).
The
presence
of
a
border
effect
did
not
prevent
both
outermost
rows
and
both
sec-
ond
rows
developing
a
flair
(Zavitkovski,
1981)
in
the
Afsnee-stands.
A
one-sided
growth
of
branches
combined
with
an
out-
ward
bending
was
observed.
We
found
the
combination
of
heteroge-
neous
variances
and
normality
3
times,
and
the
combination
with
non-normality
once.
In
the
combinations
with
normality
the
GH-
test
did
not
give
any
indication
for
differ-
ences
between
the
means
of
central
trees,
outer
border
and
inner
border
trees,
which
was
confirmed
by
the
95%
confidence
inter-
vals.
Size
inequality
At
both
Afsnee
(table
I)
and
Orsay
(table
II)
the
Gini
values
were
very
low,
reflecting
a
very
high
size
equality.
Weiner
and
Solbrig
(1984)
and
Weiner
and
Thomas
(1986)
strongly
argued
that
positively
skewed
size
distributions
and
size
inequality
were
2
different
concepts.
Skew-
ness
only
reflects
the
proportion
of
large
to
small
individuals
and
does
not
reflect
the
variation
between
individuals
or
the
domi-
nance
of
the
larger
individuals.
Some
researchers
(eg,
Bendel
et
al,
1989,
among
others),
however,
believed
that
skewness
could
be used
as
a
measure
of
intraspecific
competition.
Highly
skewed
distributions
did
not
reflect
any
size
hierarchy
(Weiner
and
Solbrig,
1984).
This
was
certainly
the
case
in
the
Afsnee-stands,
where
the
highly
neg-
atively
skewed
distributions
coincided
with
low
CV
values.
Moreover,
Weiner and
Thomas
(1986)
reported
that
28
size
distri-
butions
yielded
a
correlation
coefficient
of
0.99
between
the
Gini
coefficient
and
the
coefficient
of
variation.
The
15
pairs
of
the
stands
at
Afsnee
produced
a
very
similar
correlation
coefficient
rs
= 0.98;
the
9
Orsay
pairs
gave
a
value
of
rs
= 0.87.
Our
findings
were
also
similar
to
those
of
Bendel
et
al
(1989)
who
found
high
(Pearson
product
moment)
correlation
coefficients
between
CV and
G
(r
=
0.98
and
higher;
150
<
N
<
189),
at
least
for
the
biomass
of
the
Fes-
tuca
idahoensis
seedlings.
This
emphasizes
the
fact
that
CV and
G
are
highly
correlated
and
comparison
of
the
2
sites
is
highly
admissible.
Statistics
such
as
CV and
the
Gini
coefficient
evaluate
the
concentration
or
’inequal
distribution’
of
biomass
more
as
a
degree
of
size
inequality.
On
average,
the
frequency
distributions
at
Afsnee
deviated
from
normality
with
time,
indicating
that
the
ratio
of
taller/smaller
trees
increases
together
with
the
change
for
dominance
and
suppression
(Weiner,
1985).
This
was
accompanied
with
the
increasing
common-
ness
of
the
leptokurtic
curve
form.
CONCLUSIONS
At
Afsnee
all
skewness
values
Z((b
1)
0.5
)
were
negative
and
increased
with
time
while
the
leptokurtic
curve
was
rather
common.
Cultivar
ROB
was
the
shortest
and
BEA
the
tallest.
CV and
G
provided
the
lowest
values
in
the
second
year.
A
border
effect
was
found
along
the
southern
side
(r
9)
of
the
stands,
with
ROB,
FRI
and
COL
from
the
second
year
onwards,
and
the
central
block
was
unaffected
by
the
inner
border
(r
2
and
r8
).
At
Orsay
ROB
was
always
the
shortest
clone
and
BEA
the
tallest.
The
size
inequal-
ity
was
again
very
low.
No
border
effect
evolved
and
the
central
block
was
gener-
ally
unaffected
by
the
border
rows
r1
and
r5.
ACKNOWLEDGMENTS
Both
plantations
were
established
within
the
framework
of
the
EC
project
on
biomass
pro-
duction
(Energy
from
Biomass,
EC
contract
EN3B-0114-B
(GDF)).
We
would
like
to
thank
N
Calluy,
S
Chen,
F
Kockelbergh,
K.Landuyt,
C
Martens
and
J
van
den
Bogaert
for
highly
appre-
ciated
field
assistance,
B
Legay
and
JY
Pontailler
(l’Université
de
Paris
Sud,
Orsay)
for
computa-
tional
and
field
co-operation,
R
Ceulemans
for
critical
remarks
on an
earlier
draft,
and
2
anony-
mous
referees
for
their
constructive
and
helpful
comments.
REFERENCES
Bendel
RB,
Higgins
SS,
Teberg
JE,
Pyke
DA
(1989)
Comparison
of
skewness
coefficient,
coefficient
of
variation,
and
Gini
coefficient
as
inequality
measures
within
populations.
Oecologia 78,
394-400
Benjamin
LR,
Hardwick
RC
(1986)
Sources
of
variation
and
measures
of
variability
in
even-aged
stands
of
plants.
Ann
Bot 58,
757-778
Bisoffi
S
(1988)
Border
effects
in
a
multiclonal
poplar
(Populus spp)
plantation.
Genet Agrar 42,
429
Cannell
MGR,
Smith
RI
(1980)
Yields
of
minirotation
closely
spaced
hardwoods
in
temperature
regions:
review
and
appraisal.
For Sci 26,
415-428
Ceulemans
R,
Impens
I,
Steenackers
V
(1984)
Stom-
atal
and
anatomical
leaf
characteristics
of
10
Popu-
lus
clones.
Can
J Bot 62,
513-518
D’Agostino
RB,
Belanger
A,
D’Agostino
RB
Jr
(1990)
A
suggestion
for
using
powerful
and
informative
tests
of
normality.
Am
Stat 44,
316-321
Day
RW,
Quinn
GP
(1989)
Comparisons
of
treatments
after
an
analysis
of
variance
in
ecology.
Ecol
Monogr
59, 433-463
Egghe
L,
Rousseau
R
(1990)
Elements
of
concentra-
tion
theory.
In:
Informetrics
89/90
(L
Egghe,
R
Rousseau,
eds).
Elsevier
Science
Publishers,
Ams-
terdam,
The
Netherlands,
97-137
Firbank
LG,
Watkinson
AR
(1990)
On
the
effects
of
com-
petition:
from
monocultures
to
mixtures.
In:
Per-
spectives
in
Competition
(JB
Grace,
D
Tilman,
eds).
Academic
Press,
San
Diego,
CA,
USA,
165-192
Gaertner
EJ
(1982)
Proximity
effects
in
young
spruce
provenance stands.
Silvae Genet 31,
110-116
Games
PA,
Howell
JF
(1976)
Pairwise
multiple
com-
parison
procedures
with
unequal
ns
and/or
vari-
ances: a
Monte-Carlo
study.
J
Educ
Stat
1,
113-
125
Gomez
KA,
De
Datta
SK
(1971)
Border
effects
in
rice
experimental
plots.
I.
Unplanted
borders.
Expl Agric
7, 87-92
Green
GM
(1956)
Border
effects
in
cotton
variety
tests.
Agron J 48,
116-118
Hansen
EA
(1981)
Root
length
in
young
hybrid
Popu-
lus
plantations:
its
implication
for
border
width
of
research
plots.
For Sci 27,
808-814
Hartwig
EE,
Johnson
HW,
Carr
RB
(1951)
Border
effects
in
soybean
test
plots.
Agron
J43,
443-445
Konovalov
YB,
Loshakova
VA
(1980)
Border
effect
in
model
nurseries
for
spring
wheat
selection.
Izv
Timiryazev
S
Kh
Akad 0,
29-36
Mau
F,
Van
Tilborgh
A,
Van
Hecke
P,
Impens
I (1991)
Stem
and
branch
architecture
of
four
two-year
old
poplar
(Populus)
clones
under
a
short
rotation
inten-
sive
culture
system.
Naturalia
Monspeliensia
638-639
Rousseau
R
(1992)
Concentratie
en
diversiteit
in
informetrisch
onderzoek.
Ph
D
thesis,
Universitaire
Instelling
Antwerpen,
Wilrijk,
Belgium
Sen
A
(1973)
On
Economic
Inequality.
Clarendon
Press,
Oxford,
UK
Siegel
S,
Castellan
NJ
(1988)
Nonparametric
Statistics
for the
Behavioral
Sciences.
Mc
Graw-Hill,
New
York,
USA
Sokal
RR,
Rohlf
FJ
(1981)
Biometry.
WH
Freeman
and
Company,
San
Francisco,
CA,
USA
Weiner
J (1985)
Size
hierarchies
in
experimental
popu-
lations
of
annual
plants.
Ecology 66,
743-752
Weiner
J,
Solbrig
OT
(1984)
The
meaning
and
mea-
surement
of
size
hierarchies
in
plant
populations.
Oecologia
61, 334-336
Weiner
J,
Thomas
SC
(1986)
Size
variability
and
com-
petition
in
plant
monocultures.
Oikos 47, 211-222
Zavitkovski
J
(1981)
Small
plots
with
unplanted
plot
bor-
der
can
distort
data
in
biomass
production
studies.
Can
J For
Res
11, 9-12