Báo cáo y học: "Allergen-specific T cell quantity in blood is higher in allergic compared to nonallergic individuals" pptx
Bạn đang xem bản rút gọn của tài liệu. Xem và tải ngay bản đầy đủ của tài liệu tại đây (2.13 MB, 12 trang )
RESEARCH Open Access
Allergen-specific T cell quantity in blood is higher
in allergic compared to nonallergic individuals
Aito Ueno-Yamanouchi
1†
, Faisal M Khan
2,3*†
, Bazir Serushago
1
, Tom Bowen
1,3
, Cathy Lu
1
, Joanne Luider
2
and
Jan Storek
1
Abstract
Background: Allergen-specific IgE production is a hallmark of allergic asthma/rhinitis/eczema. Theoretically this
could be due to a high number of allergen-specific B cells or allergen-specific T cells helping allerge n-specific B
cells differentiate into IgE-producing plasma cells. Here, we determined whether the number of allergen-specific B
cells or T helper (Th) cells is higher in allergic individuals compa red to nonallergic individuals.
Methods: A total of 52 allergic individu als and 32 nonallergic individuals were studied. The allergen-specific B and
Th cells were enumerated by culturing CFSE-loaded blood mononuclear cells for 7-days with allergen (cat, Timothy
or birch), and determining the number of proliferating B or Th cells (diluting CFSE) by flow cytometry. Allergen-
specific IgE concentration was determined by fluorescent enzymoimmunoassay (FEIA).
Results: The quantities of proliferating Th cells but not proliferating B cells specific for cat, Timothy and birch were
significantly higher in cat-, Timothy- and birch-allergic individuals compared to nonallergic individuals. The titer of
allergen-specific IgE showed significant correlation with allergen-specific Th cells and not with allergen-specific B
cells for all 3 allergens.
Conclusions: A high number of allergen-specific proliferating Th cells, but not proliferating B cells, may play a role
in the pathogenesis of allergic asthma/rhinitis/eczema.
Background
Enhanced production of allergen-specific IgE is charac-
teristic for allergic asthma, rhinitis or eczema [1,2].
Upon inhalation, ingestion or transcutaneous diffusion
of the allergen, dendritic cells present peptides from the
allergen to allergen-specific Th cells. These allergen-spe-
cific Th cells, expressing CD40 ligand and secreting Th2
cytokines like IL-4, stimul ate the differentiation of aller-
gen-specific B cells to IgE-producing plasma cells [3-6].
The increased production of IgE could be due to 1)
increased quantity of allergen-specific B cells, 2) abnor-
mal function of allergen-specific B cells (abnormally
high B cell-intrinsic drive to differentiate into IgE
plasma cells), 3) increased quantity of allergen-specific
Th cells, 4) abnormal function of allergen-specific Th
cells (abnormally high propensity to sti mulate B cell dif-
ferentiation into IgE plasma cells, eg, through increased
secretion of Th2 cytokines), or 5) other mechanisms. To
determine whether the mechanism of increased B cell
quantity or the mechanism of increased Th cell quantity
may apply, here we compared t he quantity of allergen-
specific proliferating B and Th cells for inhalant aller-
gens in allergic and nonallergic individuals. The term
allergen-specific Th cells or B cells has been used to
describe allergen- specific proliferating Th or B cells
throughout the manuscript. We also assessed the pro-
duction of IL-4 (characteristic of Th2 cells) and IFNg
(characteristic of Th1 cells) by the allergen-specific Th
cells.
Materials and methods
Subjects
Fifty-two allergic and 32 nonallergic individuals partici-
pated in the study. Allergic individuals were recruited by
allergists (B.S. or T.B.) among patients newly referred to
their allergy clinics. All 52 allergic individuals (38%
* Correspondence:
† Contributed equally
2
Department of Pathology & Laboratory Medicine, University of Calgary,
Room 269, Heritage Medical Research Building, 3330 Hospital Drive NW,
Calgary, AB T2N 4N1, Canada
Full list of author information is available at the end of the article
Ueno-Yamanouchi et al. Allergy, Asthma & Clinical Immunology 2011, 7:6
/>ALLERGY, ASTHMA & CLINICAL
IMMUNOLOGY
© 2011 Ueno-Yamanouchi et al; licensee BioMed Cent ral Ltd. This is an Open A ccess article dist ribute d under the terms of the Crea tive
Commons Attribution License (http://creativecomm ons.org/licenses/by/2.0), which permits unrestricted use, distribution, and
reproduction in any medium, provided the original work is properly cited.
male, n = 20; 62% female, n = 32) had symptoms of
asthma, rhinitis or eczema and were skin prick t est
(SPT)-posit ive for at least 1 of 9 common inhalant aller-
gens tested (see below). Their median age was 27 years
(range, 18-69 years). Asymptomatic subjects (without
symptom s of asthma, rhinitis or eczema) were recruited
by advertising. They were included into the study as
“nonallergic subjects” only if they were SPT-negative for
all 9 inhalant allergens tested. We studied 32 nonallergic
individuals (40% male, n = 13; 60% female, n = 19); their
median age was 29 years (range, 15-47 years). During
each month of blood drawing from a non allergic indivi-
dual, blood was drawn also from 1-2 allergic individuals
to ensure season-matching of allergic and nonallergic
individuals.
To ensure uniformity in assessing the presence o f
symptoms of asthma, rhinitis or eczema between the
symptomatic and asymptomatic persons, the Interna-
tional Study of Asthma and allergies in Childhood ques-
tionnaire (version Phase II, />PhaseOne/Manual/ManFrame.html, accessed December
27, 2007) was used for both the symptomatic and
asymptomatic subjects. Presence of symptoms was
defined as a positive answer to question No. 2, 7 or 8 of
the asthma section, question No. 2 of the rhinitis section
or question No. 2 of the eczema section of the question-
naire. Of the 52 allergic subjects, 14 (27%) had asthma,
rhinitis and eczema, 16 (31%) had asthma and rhinitis, 4
(7.5%) had rhinitis and eczema, 12 (23%) had rhinitis
only, 4 (7.5%) had asthma only, and 2 (4%) had eczema
only. Per another questionnaire, none of the allergic or
nonallergic subjects had had cancer, autoimmune dis-
ease or immune deficiency, had ever received allergen
immunotherapy or received systemic immunosuppres-
sive drugs in the previous three months. None of the
subjects received antihistamines in the last 7 days prior
to SPT. All subjects (allergics and nonall ergics) signed a
written consent to participate in the study. The study
was approved by the Ethics Committee of the University
of Calgary.
Blood was drawn for allergen-sp ecific B/Th cell assays
prior to SPT (typically within one hour prior to SPT) to
eliminate the possibility of SPT influence on the results
of the allergen -specific B/Th cell assays. Blood was
drawn at two different times from 5 allergic and 4 non-
allergic individuals to evaluate whether the quantity of
allergen specific B and Th cells differs in the same indi-
vidual at different time points.
Allergens
Allergen extracts (ALK-Abello, Horsholm, Denmark,
except for Timothy grass pollen extract from Greer
Laboratories, Lenoir, NC, USA) were kindly donated by
Western Allergy, Mississauga, Ontario, Canada. Neat
extracts contained 50% glycerol and 0.4% phenol. Nega-
tive control was 0.9% sodium chloride in 50% glycerol
and 0.4% phenol (Glycerol Saline). Positive control was
histamine 1 mg/mL in 50% glycerol and 0.4% phenol
(Histatrol, [ALK-Abello, Horsholm, Denmark]) for skin
prick test and monoclonal mouse-anti-human CD3
(mitogenic clone 64.1) for allergen-specific Th cells
assay. The same CD3 antibody was used also as a posi-
tive control for the allergen-specific B cell assay, as B
cell proliferation was induced in the CD3 antibody-
stimulated culture of mononuclear cells, probably by
stimulated T cells. The allergen concentration used for
SPT was in compliance with the US guidelines on prob-
able effective concentration range for allergen extracts
( />notherapy/, accessed on November 26, 2008). The aller-
gen concentration used for allergen-specific B /Th cells
assay was based on our preliminary experiments in
which assay was performed for each allergen using three
different concentrations - 10-times, 100-times and 1000-
times lower concentration than that u sed for SPT. The
100-times lower concentration was associated with the
highest percentage of Th and B cell proliferation above
Glycerol Saline background. Thus, the final concentra-
tion used was as follows:
○ Cat pelt, 10,000 BAU/ml [SPT], 100 BAU/ml [spe-
cific B/Th cells]
○ Dog epithelium, 1:20 [SPT], 1:2000 [specific B/Th
cells]
○ Dermatophagoides pteronyssius (DP), 10000 AU/ml
[SPT], 100 AU/ml [specific B/Th cells]
○ Dermatophagoides farinae (DF), 10000 AU/ml
[SPT], 100 AU/ml [specific B/Th cells]
○ Alternaria, 1:10 [SPT], 1:1000 [specific B/Th cells]
○ Hormodendrum/Clados porium, 1:10 [SPT], 1:1000
[specific B/Th cells]
○ Timothy grass pollen, 100,000 AU/ml [SPT], 1000
AU/ml [specific B/Th cells]
○ Short ragweed pollen, 1:20 [SPT], 1:2000 [specific
B/Th cells]
○ Birch tree (Betula verrucosa) pollen, 1:20 [SPT],
1:2000 [specific B/Th cells]
Enumeration of Allergen-Specific B, Th, Th1 and Th2 cells
(a) Cell culture and Flow analysis
Blood was drawn into hepariniz ed tubes. Within 8 h
from the blood draw, mononuclear cells (MNCs) were
isolated using density gradient centrifugation (Ficoll,
density 1.073 kg/L) and labeled with 5 μM carboxyfluor-
escein diacetate succinimidyl ester (CFSE, Molecular
Probes). CFSE labeling was done to m easure the prolif-
eration of allergen-specific Th and B cells. When a
Ueno-Yamanouchi et al. Allergy, Asthma & Clinical Immunology 2011, 7:6
/>Page 2 of 12
CFSE-labeled cell divides, CFSE-labeled proteins in the
cell are e qually distributed between the daughter cells,
thus halving cell fluorescence with each division. Conse-
quently, dividing cells lose their fluorescence (become
CFSE
low
), and non-proliferating cells preserve their
brightness (remain CFSE
high
). The number of the origi-
nal cells can be calculated from estimated number of
divisions for ea ch cell [7]. This allows the detection of
low frequency cells that can only be detected after they
have proliferated. Three million of CFSE-labeled MNCs
in 2 ml of DMEM-RS media (Hyclone, Logan, UT) sup-
plemented w ith 2 mM glutamine, Penicillin (100 U/ml),
Streptomycin (0.1 mg/ml), and 5% autologous plasma
were incubated with allergen (see “Allergens”,above,for
concentration) or negative control (Glycerol Saline) or
positive control (anti-CD3) for 7 days at 37°C in a humi-
dified atmosphere containing 5% CO
2
. Monensin (Golgi-
stop, BD Biosciences; final concentration 2 mM) was
added into the cell culture on day 6 (for the last 18 h of
culture). At the end of culture, cells were washed using
PBS with 10% Fetal Bovine Serum and 2 mM EDTA,
resuspended in PBS, and fixed and permeabilized using
BD cytofix/cytoperm kit (BD Biosciences). Then the
cells were stained for 30 min at 4°C with the following
fluorochrome-labeled antibodies: IFNg-APC, CD4-APC-
Cy7 (Miltenyi Biotec, Bergisch Gladbach, Germany), IL-
4-PE, CD3-PC7 (BD Biosciences, San J ose, CA, USA)
and CD19-PC5 and CD20-PC5 (Beckman Coulter, Mis-
sissauga, Ontario, Canada). Cells were washed and
resuspended in P BS with 1% bovine serum albumin and
0.1% sodium azide. Immediately before flow cytometry,
a known number of fluorospheres (eg, 50,000) (Flow-
Count, Beckman Coulter) were added to ea ch sample.
The cells were then analyzed by flow cytometry (FACS
Aria,BDBiosciences,SanJose,CA,USA).Datawere
analyzed using FACS DiVa software (BD Biosciences,
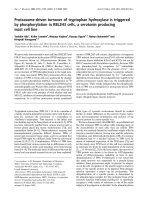
San Jose, CA, USA). Allergen-specific B cells were
defined as CFSE
low
cells expressing CD19 or CD20.
Allergen-specific Th cells were defined as CFSE
low
cells
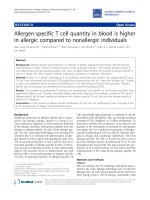
expressingCD3andCD4(Figure1).Allergen-specific
Negative Control
Negative Control
(Glycerol Saline)
(Glycerol Saline)
Positive Control
Positive Control
(Anti CD3)
(Anti CD3)
Allergen
Allergen
(Timothy)
(Timothy)
Allergen specific
Allergen specific
Th
Th
cells
cells
Allergen specific
Allergen specific
Th1 cells
Th1 cells
Allergen specific
Allergen specific
Th2 cells
Th2 cells
Allergen specific
Allergen specific
B cells
B cells
CD4
CD4
CFSE
CFSE
IFN
IFN
γ
γγ
γ
γ
γγ
γ
CFSE
CFSE
IL4
IL4
CFSE
CFSE
CD19
CD19
and
and
CD20
CD20
C
F
S
E
CFSE
P1
P2
P3
P4
Gated on
CD3+CD4+
cells
CD3+CD4+
cells
CD3+CD4+
cells
CD19+
and/or
CD20+ cells
Figure 1 Example of allergen specific Th and B cells. Peripheral blood MNCs (in this example from Timothy-allergic individual per skin prick
test) labeled with carboxyfluorescein diacetate succinimidyl ester (CFSE) were cultured for 7 days with Timothy allergen. Glycerol saline (negative
control) and anti-CD3 (positive control) were used as controls. Monensin was used to stop cytokine secretion. At the end of the culture, cells
were stained for CD3, CD4, CD19, CD20, IFNg and IL-4 and analyzed using FACS Aria flow cytometer. Timothy-specific Th, Th1, Th2 and B cells
are defined as CFSE
low
CD3
pos
CD4
pos
(P1), CFSE
low
CD3
pos
CD4
pos
IFNg
pos
(P2), CFSE
low
CD3
pos
CD4
pos
IL-4
pos
(P3) and CFSE
low
CD3
pos
(CD19
pos
or
CD20
pos
) (P4) cells, respectively.
Ueno-Yamanouchi et al. Allergy, Asthma & Clinical Immunology 2011, 7:6
/>Page 3 of 12
Th1 or Th2 cells were defined as allergen-specific CFSE-
low
cells expressing CD3 and CD4 and either IFNg (Th1)
or IL-4 (Th2) (Figure 1).
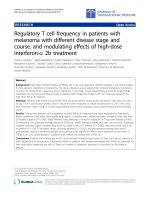
(b) Index and absolute count of allergen specific B, Th, Th1
and Th2 cells
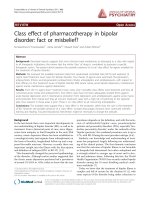
The method of calculation of index and absolute count
of allergen speci fic B, Th, Th1 and Th2 cells is dis-
played in Figure 2. The percentage of the CFSE
low
cells
on day 7 of culture is referred to as the “index” of the
quantity of allergen-specific cells. The absolute count
of the allergen-specific cells was determined from the
absolute MNC count on day 0 (absolute lymphocyte
count + absolute monocyte count per ml of blood), the
acquired cell proportion on day 7 (determined as the
acquired proportion of fluorospheres, eg, 0.8 if 40,000
of the 50,000 fluorospheres were acquired), and the
number of precursor cells of acquired (by flow cytome-
try) allergen-specific cells (dete rmined using Modfit
software, Verity Software House, see next paragraph
for details). The absolute count of allergen-specific
cells (per ml of blood) wa s calculated using the follow-
ing formula:
A=
Total number o
ffl
uorospheres in tube (eg, 50, 000)
Acquired number of fluorospheres
(
eg, 40, 000
)
×Number of precursor cells of acquired allergen−specific cells of the subset
∗
*B cells, Th cells, Th1 cells or Th2 cells
The absolute count of allergen−specific cells (per ml of blood) = A×
Absolute MNC count on day 0 o
f
culture (per ml blood)
Number of MNCs put into culture on da
y
0
The number of precursor cells of acquired allergen-
specific cells (the precursor cells of CFSE
low
Th cells,
CFSE
low
B cells, CFSE
low
IFNg+ Th cells, CFSE
low
IL-4
+ Th cells) was estimated using the ModFit software
(Verity Software House, Topsham, ME, U SA). Based
on CFSE fluorescence, the software estimates how
many ce lls divided (between day 0 an d day 7) once
(generation 1), twice (generation 2), three times (gen-
eration 3), etc. To exclude bystander responding cells
(which should undergo fewer divisions than allergen-
specific cells), only generations 3, 4, 5 and higher were
considered as the allergen-specific cells and
[
[
#
#
7
7
]
]
/
/
2
2
7
7
+
+
[
[
#
#
6
6
]
]
/
/
2
2
6
6
+
+
[
[
#
#
5
5
]
]
/
/
2
2
5
5
+
+
[
[
#
#
4
4
]
]
/
/
2
2
4
4
+
+
[
[
#
#
3
3
]
]
/
/
2
2
3
3
0
50
100
150
200
0
10
2
Generation 7
Generation 6
Generation 5
Generation 4
Generation 3
Generation 2
Generation 1
}
% of CD4 T cells in
Generations 3-7
Index of allergen-
specific T cells
Generation 0
Number of
precursor cells of
acquired allergen-
specific Th cells
C
C
D
D
4
4
C
C
D
D
3
3
Used for
calculation of
absolute count of
allergen-specific
Th cells
#
#
C
C
F
F
S
S
E
E
Figure 2 Example of calculation of the index of the quantity of allergen-specific Th cells and the number of precursor cells of
acquired allergen-specific cells (needed to calculate the absolute count of allergen specific Th cells). The percentage of the CFSE
low
cells
after the 7 day culture is referred to as the “index” of the quantity of allergen-specific cells (in this example, Timothy-specific Th index). The
number of precursor cells of acquired allergen-specific cells (in this example, precursor cells of CFSE
low
Th cells), determined using the ModFit
software, and was used to estimate the absolute count of allergen-specific Th cells. Only generations 3 and higher were considered as allergen-
specific cells and generations 0, 1 and 2 were omitted from the calculation.
Ueno-Yamanouchi et al. Allergy, Asthma & Clinical Immunology 2011, 7:6
/>Page 4 of 12
generations 0, 1 and 2 were omitted from the calcula-
tion (Figure 2). The number of precursor cells of
acquired allergen-specific cells was calculated as
([number of cells in generation 3]/2
3
+[numberof
cells in generation 4]/2
4
+ [number of cells in genera-
tion 5]/2
5
+ [number of cells in generation 6]/2
6
+
[number of cells in generation 7]/2
7
+ [number of cells
in generation 8]/2
8
).
To correct the index or the absolute count of allergen-
specific cells for background (eg, due to nonspecific sti-
mulation, nonspecific staining o r loss of CFSE activity),
the index or the absolute count of the negative control
was subtracted. The indices a nd absolute counts pre-
sented in the Results and Figures 3 and 4 are the cor-
rected indices and corrected absolute counts.
Skin Prick Testing
Allergen drops and positive and negative control drops
were applied on t he volar forearms with at least 2 cm
distance from each other. For each allergen, a single epi-
cutaneous prick was d one using Allersharp
®
device
(Western Allergy, Mississau ga, Ontario, Canada). Wheal
area was recorded for Histatrol at 10 min, and for
others (each allergen and negative control) at 15 min by
Birch
Birch
Timothy
Timothy
Cat
Cat
Allergic Non-
SPT+ aller
g
ic
Th cell IndexB cell Index
0.0
1.0
2.0
3.0
4.0
5.0
(%)
0.0
5.0
10.0
15.0
20.0
25.0
30.0
(%)
0.0
10.0
20.0
30.0
40.0
50.0
(%)
0
1
2
3
4
5
6
7
(%)
NS
NS
NS
0.0
10.0
20.0
30.0
40.0
50.0
60.0
70.0
(%)
0
10
20
30
40
50
60
(%)
Allergic Non-
SPT+ allergic
P= 0.041
P<0.001
P= 0.025
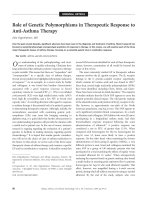
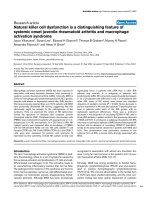
Figure 3 Indices for allergen-specific B cells (left) and Th cells (right) in allergic patients (n = 52, closed diamonds) and nonallergic
persons (n = 32, open diamonds). The numbers of allergic patients were 26 for cat, 34 for Timothy, and 27 for birch. Significance of the
difference between the allergic and nonallergic groups is given in the upper section of each plot. Allergen-specific Th and B cell results are
displayed as corrected percentage of CFSE low Th and B cells (saline control percentage subtracted). The horizontal bars show the medians.
Ueno-Yamanouchi et al. Allergy, Asthma & Clinical Immunology 2011, 7:6
/>Page 5 of 12
Birch Timothy Cat
Allergic Non-
SPT+ allergic
Allergic Non-
SPT+ allergic
B cell
A
bsolute count Th cell
A
bsolute count
P= 0.038
P= 0.001
P= 0.041
NS
NS
NS
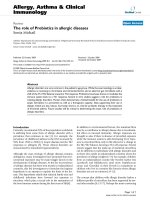
Figure 4 Absolute count for allergen-specific B cells (left) and Th cells (right) in allergic patients (n = 33, closed diamonds) and
nonallergic persons (n = 18, open diamonds). The numbers of allergic patients were 18 for cat, 23 for Timothy, and 19 for birch. Significance
of the difference between the allergic and nonallergic groups is given in the upper section of each plot. Allergen-specific Th and B cells results
are displayed as corrected absolute count of CFSE low Th and B cells (saline control absolute counts subtracted). The horizontal bars show the
medians.
Ueno-Yamanouchi et al. Allergy, Asthma & Clinical Immunology 2011, 7:6
/>Page 6 of 12
outlining the area with a f elt-tipped pen, and transfer-
ring the outline onto 3 M tape s to keep a permanent
record of SPT. The recorded wheal areas were scanned
as jpeg files and analyzed by Image J software (National
Institutes of Health, Bethesda, MD, USA) to determine
the average diameter of each wheal. The average dia-
meter of the negative control wheal was subtracted from
each allergen wheal (corrected diameter). The SPT
result was considered positive if the corrected diameter
was greater than 3 mm [8]. All subjects had a valid SPT
as defined by at least 1 mm diameter difference between
the positive and negative controls[8].
Fluorescent enzymoimmunoassay
Sera from the research subjects were stored in tightly
sealed vials at -86°C. Allergen-specific IgE concentra-
tion was determined using UniCAP100 instrument
and specific IgE FEIA reagents (Phadia, Uppsala, Swe-
den, accessed January 7, 2010) per manufacturer
instructions. Numbers of allergic and non-allergic
individuals tested for allergen-specific IgE are men-
tioned in Table 1.
Statistics
Significance of difference of test results (index or the
absolute count of allergen-specific T or B cells) between
2 subject groups was tested by Mann-Whitney-Wil-
coxon rank sum test. P values less than 0.05 (2-tailed)
were considered significant.
Results
Allergic and nonallergic individuals
By SPT, 26 (50%) of the 52 allergic subjects were allergic
to cat, 14 (27%) to dog, 11 (21%) to D. pteronyssimus,6
(11%) to D. farinae, 2 (4%) to Alternaria, 3 (6%) to Hor-
modendrum, 34 (65%) to Timothy, 27 (52%) to birch
and6(11%)toshortragweed.Giventhesmallnumber
of subjects allergic to Dog, D. pteronyssimus, D. farinae,
Alternaria, Hormodendrum and short ragweed, only
analyses pertinent to cat, Timothy and birch are pre-
sented here. The indices of allergen-specific T/B cells
were determined in all 52 allergic and 32 nonallergic
individuals, whereas the absolute counts were
determined in o nly the last consecutive 33 allergic and
18 nonallergic individuals (Table 1).
Indices of allergen-specific B and Th cells
Indices of allergen -specific B cells were similar in indivi-
duals allergic to any of the allergens analyzed (cat,
Timothy, birch) compared to nonallergic individuals
(Figure 3, left). In contrast, the indices of allergen-speci-
fic Th cells were significantly higher in individuals aller-
gic to cat, Timothy or birch compared to nonallergic
individuals (Figure 3, right).
Absolute counts of allergen-specific B and Th cells
The indices presented in the previous paragraph are
imperfect indicators of the quantity of allergen-specific
B/Th cells. For example, a higher allergen-specific Th
cell index in allergic individuals could be due to the fact
that allergen-specific Th ce lls from allergic individuals
underwent on average more divisions in the culture
than allergen-specific Th cells from nonallergic indivi-
duals. The index also does not take into account poten-
tial differences in the absolute counts of total B or T h
cells in the blood of allergic and nonallergic individuals.
Thus, in a subset of the study subjects (the “n” for each
allergen is given in Table 1) we also determined the
absolute counts of allergen-specific B and Th cells.
Analogous to the indices, the absolute counts of aller-
gen-specific B cells were similar in individuals allergic to
any of the allergens analyzed compared to nonallergic
individuals (Figure 4, left). Also analogous to the indices,
theabsolutecountsofallergen-specificThcellswere
significantly higher in individuals allergi c to cat,
Timothy or birch compared to nonallergic individuals
(Figure 4, right). We then compared the ratio of positive
control (anti CD3) -specific Th cell and allergen-specific
Th cells to rule out the impact of run variability. Similar
to the absolute counts of allergen-specific Th cells, the
ratio of positive control (anti CD3)-specific Th cell and
allergen-specific Th cells was significantly higher in indi-
viduals allergic to cat, Timothy or birch compared to
nonallergic individuals (Figure 5). The absolute counts
of Th and B cells were found similar in allerg ic indivi-
duals allergic to one and more than one allergen.
Table 1 Subjects (allergic and nonallergic) studied
Allergens Index Analysis Absolute count Analysis FEIA analysis
Allergic
Individuals
1
Nonallergic
Individuals
2
Allergic
Individuals
1
Nonallergic
Individuals
2
Allergic
Individuals
1
Nonallergic
Individuals
2
Cat 26 32 18 18 13 12
Timothy 34 32 23 18 11 12
Birch 27 32 19 18 12 12
1
Numbers denote the number of allergic individuals (with symptoms of asthma/rhinitis/eczema and skin prick test (SPT) positive for the specific allergen)
2
Numbers denote the number of nonallergic individuals (with no symptoms of asthma/rhinitis/eczema and SPT negative for all 9 allergens tested)
Ueno-Yamanouchi et al. Allergy, Asthma & Clinical Immunology 2011, 7:6
/>Page 7 of 12
In order to assess whether the observed proliferation
of Th cells was allergen-specific, we performed an
additional analysis by dividing allergic patients into
those allergic to the allergen of interest (SPT result
positive for that allergen, “ Allergic SPT+” )andthose
allergic to a different allergen(s) ("Allergic SPT-”). For
example, cat allergen acts as a non-offending allergen
in CAT SPT- allergic individuals. The absolute counts
of allergen-specific Th cells were higher for all 3 aller-
gens tested in SPT+ than SPT- individuals (Additional
file 1, Figure S1). The difference was significant for
Timothy (P = 0.001) and showed a trend of signifi-
cance for birch (P = 0.06) and cat (P = 0.09). Also, the
absolute counts of Th cells specific for Timothy, birch
and cat were similar in SPT- and non-allergic indivi-
duals. In contrast to T cells, absolute counts of B cells
specific for Timothy, birch and cat were similar
between SPT+ and SPT-individuals, SPT+ and non-
allergic individuals and SPT- and non-allergic indivi-
duals (Additional file 1, Figure S1).
Correlation between allergen-specific IgE and allergen-
specific Th and B cells
Since production of allergen-specific IgE is characteristic
for allergic diseases, we determined serum concentration
of allergen-specific IgE using FEIA in 22 allergic and 12
non-allergic individuals. As expected, the absolute
counts of allergen-specific IgE were significantly higher
in individuals allergic to cat, Timothy or birch compared
to nonallergic individuals (Additional file 2, Figure S2).
Correlations between allergen-specif ic IgE and allergen-
specific Th cells but not allergen-specific B cells (specific
for cat, Timothy and birch) were statistically significant
(Table 2).
Indices and absolute counts of allergen-specific Th1 and
Th2 cells
No significant differences in the indices or absolute
counts of allergen-specific Th1 or Th2 cells between the
individuals allergic to any of the allergens analyzed and
nonallergic individuals were observed. There were
trends toward higher indices and absolute counts of
both allergen-specific Th1 cells and allergen-specific
Th2 cells in allergic compared to nonallergic individuals;
statistical significance was not reached probably due to
a high interindividual variabily in the number of aller-
gen-specific Th1 as well as Th2 cells.
Intraindividual variability of allergen-specific Th and B
cells (in blood drawn on different dates) is remarkably
low
In spite of the statistically significant difference in cat/
Timothy/birch-specific Th cell counts between allergic
and nonallergic individuals, there were cat/Timothy/
birch-allergic individuals with low cat/Timothy/birch-
specific Th cell counts (in the range of nonallergic indi-
viduals) as well as nonaller gic individuals with high cat/
Timothy/birch-specfic Th cell counts (in the range of
allergic individuals) (Figure 6). This could be either due
to a high variability in assay results (due, eg, to variation
of allergen-specific Th cell counts from month to
month [eg, due to season or technical reasons] or
because allergen-specific Th cells were truly low in
some allergic individuals or truly high in some nonaller-
gic individuals. Also, the lack of statistically significant
difference in allergen-specific B cell counts between
allergic and nonallergic individuals could be due to a
high variability in assay results. Thus, we drew blood
from 5 cat/Timothy/birch-allergi c individuals and 4
nonallergic individuals at ≥2 time points, and mea sured
allergen-specif ic Th and B cells at each time point. As
shown in Figure 5, the results were remarkably similar
between time points. This implies that (1) cat/Timothy/
birch-specific Th cell counts are high in most but not
all cat/Timothy/birch-allergic individuals and low in
most but not all nonallergic individuals, and (2) the lack
of statistically significant difference between allergen-
specific B cell counts in allergic vs nonallergic indivi-
duals is likely not due to a high variability of t he assay
results.
Discussion
Thepresentstudyshowsthreeimportantfindings.The
foremost among them is the similarity of allergen-speci-
fic proliferating B cell quantity (index or absolute count)
in allergic and nonallergic individuals. Irsch et al. and
Burastero et al. have also described similar frequency of
allergen-specific B cells in allergic vs nonallergic indivi-
duals; however absolute counts have not been deter-
mined in those studies [9,10]. Our data together with
those of Irsch et al. and Burastero et al. suggest that
since the quantity of allergen-specific B cells in blood is
not different between al lergic and non-allergic indivi-
duals, other mechanisms like increased differentiation of
allergen-specific B cells into IgE-producing plasma cells
may be involv ed in the pathogenesis of allergic diseases.
This notion is further supported by the poor correlation
of allergen-specific B cell counts with serum levels of
allergen-specific IgE. Consistent with this speculation,
Kasaian et. al showed that allergic individuals have
higher frequencies of IgE-producing B cells in peripheral
blood than nonallergi c individuals [6,7]. These are likely
the precursors of IgE-producing plasma cells that are
increased in number in the airways of allergic indivi-
duals [11].
The second crucial finding of this study is that the
quantity of cat, Timothy and birch-specific Th cells is
higher in allergic than nonallergic individuals and
Ueno-Yamanouchi et al. Allergy, Asthma & Clinical Immunology 2011, 7:6
/>Page 8 of 12
Birch Timothy Cat
Allergic Non-
SPT+ allergic
Allergic Non-
SPT+ allergic
P= 0.005
P= 0.001
P= 0.009
NS
NS
NS
Ant
i
C
D3-spec
ifi
c Th cells
/
Allergen-specific Th cells
Anti CD3-specific B cells /
Allergen-specific B cells
Figure 5 Ratio of positive control (anti CD3)-specific Th cell and allergen-specific Th cells (left) and ratio of positive control (anti CD3)-
specific B cells and allergen-specific B cells (right) in allergic patients (n = 33, closed diamonds) and nonallergic persons (n = 18, open
diamonds). The numbers of allergic patients were 18 for cat, 23 for Timothy, and 19 for birch. Significance of the difference between the allergic
and nonallergic groups is given in the upper section of each plot. The horizontal bars show the medians.
Ueno-Yamanouchi et al. Allergy, Asthma & Clinical Immunology 2011, 7:6
/>Page 9 of 12
significantly correlates with serum levels of cat, Timothy
and birch-specific IgE. We did not find a significant dif-
ference in the Th or B cell indices or absolute counts
between individuals allergic to other allergens (eg, dog,
DP)butthismaybeduetotheinadequatepowerto
detect a difference (data not shown). Specificity of aller-
gen-specific activation of Th cells was demonstrated by
showing that allergen-specific Th cells for all three aller-
gens(cat,Timothy,birch)was consistently higher in
allergic SPT+ than SPT- individuals and similar between
allergic SPT- and non-allergic individuals. In previous
studies allergen-specific Th cell quantities were also sus-
pected to be increased (based on incre ased thymidine
incorporation by MNCs or increa sed frequencies of pro-
liferating T cells stimulated with allergen) in persons
allergic to that allergen compared to nonallergic persons
in case of some allergens (eg, cow’smilkprotein,pea-
nut)[12- 14] but not other allergens (eg, ovalbumin) [14].
However, absolute counts were not determined. In our
study, both indices and absolute counts for allergen spe-
cific Th cells have shown a similar pattern (significantly
different for cat, Timothy and birch). Consistent with
our results, Tay et al showed a higher frequency of pea-
nut-specific T cells in peanut-allergic individuals com-
pared to controls but similar frequency of egg allergen-
specific T cells in egg-allergic compared to nonallergic
subjects [14]. We speculate that in allergic persons, the
increased number of allergen-specific Th cells may drive
the allergen-specific B cells to differentiate into IgE
plasma cells. This may have been the reason why aller-
gen-speci fic Th cells showed consistently better correla-
tion with serum titer of allergen-specific IgE than
allergen-specific B cells.
The third important finding of the study is the simi-
larity in allergen -specific Th cell quantity when analyzed
at different time-points. This suggests that the interassay
variability is lo w and that the quantity of allergen speci-
fic Th cells remains relatively constant irrespective of
season or allergen exposure. More important, this sug-
gests that despite cat/Timothy/birch-allergic individuals
have higher-than-normal allergen-specific Th cell counts
asagroup,therearesomecat/Timothy/birch-allergic
patients with low allergen-specific T cell counts and
some nonallergic patients with high allergen-specific T
cell counts. This sugg ests that the high allergen-specific
Th cell count is not the only pathogenic mechanism of
allergic disease, as other mechanisms may cause an indi-
vidual with low allergen-specific Th cell counts to
develop allergic disease or an individual with high aller-
gen-specific Th cell counts not to develop allergic
disease.
Table 2 Correlation between allergen-specific IgE
obtained from FEIA and absolute count of allergen-
specific Th and B cells
Allergen-specific IgE vs
Allergen-specific Th cells
Allergen-specific IgE vs
Allergen-specific B cells
Cat R = .58 R = .39
P = .004 P = .07
Timothy R = .72 R = .38
P <.001 P=.08
Birch R = .50 R = .21
P = .01 P = 76
1
10
100
1000
10000
100000
1000000
Sample 1 Sample 2
1
10
100
1000
10000
Sam ple 1 Sam ple 2
Allergic (SPT+) Nonallergic
(B) Absolute count of allergen-specific B cells
1
10
100
1000
10000
Sample 1 Sample 2
1
10
100
1000
Sample 1 Sample 2
(
A
)
Absolute count of allergen-specific Th cell
P=0.89
P=0.40
P=0.85
P=0.89
Aller
g
ic (SPT+) Nonaller
g
ic
Figure 6 Comparison of ab solute count of (A) allergen-specific
Th and (B) allergen-specific B cells in blood drawn at different
time point from 5 allergic and 4 nonallergic individuals.
Significance of the difference between samples (1 and 2) collected
from same individual is given in the upper section of each plot. If
blood from a patient was drawn on more than two occasions,
sample 3 was considered as sample 1 or 2 for each of the other 2
samples. Allergen-specific Th and B cell results are displayed as
corrected absolute count of CFSE low Th and B cells (saline control
absolute counts subtracted).
Ueno-Yamanouchi et al. Allergy, Asthma & Clinical Immunology 2011, 7:6
/>Page 10 of 12
There are important limitations of the interpretation
of our findings of no difference in the quantity of aller-
gen-specific B cells between allergic and nonallergic
individuals in case of a ll allergens tested. First, we
enumerated the allergen-specific B or Th c ells in blood
and not in bone marrow, lymphoid and non-lymphoid
tissues like skin or mucosas. Th e non-blood tissues
might house the majority of allergen-specific memory
lymphocytes. So it is theoretically possible that allergic
individuals have higher numbers of allergen-specific B
cellsintissuesliketheairwaymucosaorlymphoid
organs like tonsils. Though, it is important to note in
this regard that the numbers of total lymphocytes, B
cells and CD4 T cells in airway secretions or biopsy spe-
cimens have been shown to be similar between allergic
and nonallergic individuals[15]. The second limitation is
that enumeration of allergen-specific B cells is based on
their proliferation. Other functions like production of
IgE have not been studied. The third limitation is that
our method of enumeration of the allergen-specific Th
or B cells was based on the ability of the cells to prolif-
erate. We assumed that all allergen-specific cells prolif-
erated and that their death rate during the 7 days of
culture was negligible. Fourth, for B cells, using a posi-
tive control stimulus directly stimulating B cells like
CD40L might have been advantageous. Fifth, we did not
take into account cell loss during cell staining (including
washes), as we considered this to be negligible and likely
similar between allergic and nonallergic individuals. The
correctness of these assumptions has not been tested.
Increased Th2 cell or decreased Th1 cell quantity or
function has been considered to play a role in the
pathogenesis of allergic disease [13,16-18] though this
has been recently contested [14]. The production of
IL-4 by IL-4-secreting Th cells (judged by anti-IL-4-PE
fluorescence of IL-4
+
cells) did not appear to be higher
in our allergic than nonallergic subjects, and the pro-
duction of IFNg by IFNg-secreting Th cells also did
not appear to be lower. Tay et al has also shown that
there were no significant differences in IFN-g or IL-4
producing cell numbers or in IFN-g/IL-4 ratios
between peanut- and egg- allergic and nonallergic
groups [14]. This suggests against a pat hogenic role of
increased Th2 or d ecreased Th1 function. However,
the role of Th1 and Th2 cells cannot be conclusively
determined from our study, as t he secretion of IL-4
and IFNg was measured after the cells were cultured
for 6-7 days - during this period their ability to secrete
IL-4 or IFNg mayhavechanged.Itisalsoimportant
that only some, but not all T cel l clones and lines spe-
cific for allergens that were cultured from peripheral
blood of allergic subjects have been shown to display
Th2 ph enotypes [19-21].
Conclusions
The increased production of allergen-specific IgE in
patients with allergic asthma, rhinitis or eczema
probably does n ot result from an increased n umber of
allergen-specific B cells but might result from an
increased number of allergen-specific Th cells that
could stimulate differentiation of allergen-specific B cells
into IgE-producing plasma cells.
Additional material
Additional file 1: Figure S1: Absolute count for allergen-specific B
cells (left) and Th cells (right) in allergic SPT + patients (closed
diamonds), nonallergic persons (open diamonds), and allergic SPT -
patients (open circle). The allergic patients are divided into those
allergic to the allergen of interest per SPT result ("Allergic SPT+”) and
those allergic to a different allergen(s) ("Allergic SPT-”). The numbers of
Allergic SPT+ patients were 18 for cat, 23 for Timothy and 19 for birch.
The numbers of Allergic SPT- patients can be calculated for each allergen
as 39 minus the number of Allergic SPT+ patients (eg, 33-23 = 10 for
cat). Significance of the difference between the Allergic SPT+ and
Allergic SPT- groups and between Allergic SPT- and Nonallergic groups is
given in the upper section of each plot. The horizontal bars show the
medians.
Additional file 2: Figure S2: Allergen-specific IgE values analyzed by
FEIA in allergic (n = 22, closed diamonds) and nonallergic (n = 12,
open diamonds) individuals. The numbers of allergic individuals were
13 for cat, 11 for Timothy, and 12 for birch. Significance of the difference
between the allergic and nonallergic individuals is given in the upper
section of each plot. Undetectable IgE levels by FEIA are displayed as
0.05 kU/L. The horizontal bars show the medians.
Author details
1
Department of Medicine, University of Calgary, Health Science Center, 3330
Hospital Drive NW, Calgary, AB T2N 4N1, Canada.
2
Department of Pathology
& Laboratory Medicine, University of Calgary, Room 269, Heritage Medical
Research Building, 3330 Hospital Drive NW, Calgary, AB T2N 4N1, Canada.
3
Department of Paediatrics, University of Calgary, Room 269, Heritage
Medical Research Building, 3330 Hospital Drive NW, Calgary, AB T2N 4N1,
Canada.
Authors’ contributions
AUY and FMK performed experiments. AUY performed analysis and
generated the initial draft of the manuscript, FMK performed experiments,
carried out final analyses and wrote later drafts of the manuscript, BS and TB
recruited allergic subjects and performed skin prick tests, CL was involved in
performing laboratory experiments assay, JL was involved in data analyses
and JS designed the study, edited the drafts and the final version of the
manuscript. FMK is Barb Ibbotson ACHF Investigator in Pediatric
Hematology. JS is a recipient of Canada Research Chair and Alberta Heritage
Foundation Clinical Scholar Awards. All authors have critically reviewed, and
approved the final manuscript.
Competing interests
The authors declare that they have no competing interests.
Received: 31 August 2010 Accepted: 17 April 2011
Published: 17 April 2011
References
1. M-RJ Bellanti JA, Castro HJ, de Inocencio JM, Sabra A: Developmental
immunology: clinical application to allergy-immunology. Ann Allergy
Asthma Immunol 2003, 90:2-6.
Ueno-Yamanouchi et al. Allergy, Asthma & Clinical Immunology 2011, 7:6
/>Page 11 of 12
2. Geha RS, Jabara HH, Brodeur SR: The regulation of immunoglobulin E
class-switch recombination. Nat Rev Immunol 2003, 3:721-32.
3. Jabara HH, Geha RS: Jun N-terminal kinase is essential for CD40-mediated
IgE class switching in B cells. J Allergy Clin Immunol 2005, 115:856-63.
4. Kracker S, Radbruch A: Immunoglobulin class switching: in vitro induction
and analysis. Methods Mol Biol 2004, 271:149-59.
5. Machura E, Mazur B, Kwiecien J, Karczewska K: Intracellular production of
IL-2, IL-4, IFN-gamma, and TNF-alpha by peripheral blood CD3+ and
CD4+ T cells in children with atopic dermatitis. Eur J Pediatr 2007,
166:789-95.
6. Hasbold J, Lyons AB, Kehry MR, Hodgkin PD: Cell division number
regulates IgG1 and IgE switching of B cells following stimulation by
CD40 ligand and IL-4. Eur J Immunol 1998, 28:1040-51.
7. Kasaian MT, Meyer CH, Nault AK, Bond JF: An increased frequency of IgE-
producing B cell precursors contributes to the elevated levels of plasma
IgE in atopic subjects. Clin Exp Allergy 1995, 25:749-55.
8. Arbes SJ Jr, Gergen PJ, Elliott L, Zeldin DC: Prevalences of positive skin
test responses to 10 common allergens in the US population: results
from the third National Health and Nutrition Examination Survey.
J Allergy Clin Immunol 2005, 116:377-83.
9. Irsch J, Hunzelmann N, Tesch H, Merk H, Maggi E, Ruffilli A, Radbruch A:
Isolation and characterization of allergen-binding cells from normal and
allergic donors. Immunotechnology 1995, 1:115-25.
10. Burastero SE, Fenoglio D, Crimi E, Brusasco V, Rossi GA: Quantitative
analysis of peripheral allergen-specific B lymphocytes in asthma. Allergy
1994, 49:348-53.
11. Papatziamos G, Van Hage-Hamsten M, Lundahl J, Hemlin C: IgE-positive
plasma cells are present in adenoids of atopic children. Acta Otolaryngol
2006, 126:180-5.
12. Rimaniol AC, Garcia G, Till SJ, Capel F, Gras G, Balabanian K, Emilie D,
Humbert M: Evaluation of CD4+ T cells proliferating to grass pollen in
seasonal allergic subjects by flow cytometry. Clin Exp Immunol 2003,
132:76-80.
13. Tsuge I, Kondo Y, Tokuda R, et al: Allergen-specific helper T cell response
in patients with cow’s milk allergy: Simultaneous analysis of proliferation
and cytokine production by carboxyfluorescein succinimidyl ester
dilution assay. Clin Exp Allergy 2006, 36:1538-45.
14. SS Tay, Clark AT, Deighton J, King Y, Ewan PW: T cell proliferation and
cytokine responses to ovalbumin and ovomucoid detected in children
with and without egg allergy. Clin Exp Allergy 2007, 37:1519-27.
15. Karjalainen EM, Lindqvist A, Laitinen LA, Kava T, Altraja A, Halme M,
Laitinen A: Airway inflammation and basement membrane tenascin in
newly diagnosed atopic and nonatopic asthma.
Respir Med 2003,
97:1045-51.
16. Bullens DM, Van Den Keybus C, Dilissen E, Kasran A, Ceuppens JL: Allergen-
specific T cells from birch-pollen-allergic patients and healthy controls
differ in T helper 2 cytokine and in interleukin-10 production. Clin Exp
Allergy 2004, 34:879-87.
17. Murphy KM, Reiner SL: The lineage decisions of helper T cells. Nat Rev
Immunol 2002, 2:933-44.
18. Jung T, Lack G, Schauer U, Uberuck W, Renz H, Gelfand EW, Rieger CH:
Decreased frequency of interferon-gamma- and interleukin-2-producing
cells in patients with atopic diseases measured at the single cell level.
J Allergy Clin Immunol 1995, 96:515-27.
19. Noma T, Yoshizawa I, Maeda K, Baba M, Yata J: Initial events and T cell
activation in lymphokine-mediated allergic responses in patients with
hen egg allergy. Ann Allergy 1994, 73:76-84.
20. Kondo M, Suzuki K, Inoue R, et al: Characterization of T-cell clones specific
to ovomucoid from patients with egg-white allergy. J Investig Allergol Clin
Immunol 2005, 15:107-11.
21. Holen E, Bolann B, Elsayed S: Novel B and T cell epitopes of chicken
ovomucoid (Gal d 1) induce T cell secretion of IL-6, IL-13, and IFN-
gamma. Clin Exp Allergy 2001, 31:952-64.
doi:10.1186/1710-1492-7-6
Cite this article as: Ueno-Yamanouchi et al.: Allergen-specific T cell
quantity in blood is higher in allergic compared to nonallergic
individuals. Allergy, Asthma & Clinical Immunology 2011 7:6.
Submit your next manuscript to BioMed Central
and take full advantage of:
• Convenient online submission
• Thorough peer review
• No space constraints or color figure charges
• Immediate publication on acceptance
• Inclusion in PubMed, CAS, Scopus and Google Scholar
• Research which is freely available for redistribution
Submit your manuscript at
www.biomedcentral.com/submit
Ueno-Yamanouchi et al. Allergy, Asthma & Clinical Immunology 2011, 7:6
/>Page 12 of 12