Báo cáo khoa học: "Branchiness of Norway spruce in north-eastern France: modelling vertical trends in maximum nodal branch size" potx
Bạn đang xem bản rút gọn của tài liệu. Xem và tải ngay bản đầy đủ của tài liệu tại đây (794.52 KB, 15 trang )
Original article
Branchiness of Norway spruce
in north-eastern France: modelling vertical trends
in maximum nodal branch size
F Colin
F Houllier
1
INRA, Centre de Recherches Forestières de Nancy, Station de Recherches
sur la Qualité des Bois, 54280 Champenoux;
2
ENGREF, Laboratoire ENGREF/INRA de Recherches en Sciences Forestières,
Unité Dynamique des Systèmes Forestiers, 14, rue Girardet, 54042 Nancy Cedex, France
(Received 13 March 1991; accepted
12
September 1991)
Summary — This paper is part of a study which aims at proposing a new method for assessing the
quality of Norway spruce from northeastern France. One component of this method is a wood
quality simulation software that requires detailed inputs describing tree branchiness and morphology. The specific purpose of this paper is to present a model that predicts maximum limbsize at various points along the stem. The dependent variable of the model is the maximum diameter per annual growth unit. The independent variables are the relative distance from the growth unit to the top of
the stem and some combinations of standard whole-tree measurements and general crown descriptors. The equation is a segmented polynomial with a join point at the height of the largest branch diameter for each tree. First, individual models are fitted to each sample tree. Then a general equation
is derived by exploring the behaviour of the individual tree parameters of the polynomial model as
functions of other individual tree attributes. Finally the model is validated on an independent data set
and is discussed with respect to biological and methodological aspects and to possible applications.
wood
branchiness / crown ratio /
modelling / wood resource / wood quality / Picea abies
Résumé — Branchaison de l’épicéa commun dans le Nord-Est de la France : modélisation du
diamètre maximal des branches verticillaires le long de la tige. Cet article s’insère dans un projet qui vise à proposer une méthode d’évaluation de la qualité de la ressource en épicéa commun du
Nord-Est de la France. Ce projet s’appuie notamment sur un logiciel de simulation de la qualité des
sciages (Leban et Duchanois, 1990) qui nécessite une description détaillée de la morphologie et de
la branchaison de chaque arbre. Cet article a pour but de proposer un modèle de prédiction de la
distribution du diamètre des branches le long de la tige. La variable prédite est le diamètre maximal
de branche par unité annuelle de croissance. Les variables indépendantes du modèle sont la distance de l’unité de croissance à l’apex ainsi que des combinaisons des variables dendrométriques
usuelles et des descripteurs globaux du houppier. L’équation est non linéaire et segmentée autour
d’une valeur critique qui correspond à la position de la plus grosse branche de l’arbre. On ajuste
d’abord un modèle individuel pour chaque arbre échantillonné. Puis on construit un modèle global à
partir d’une analyse du comportement des paramètres du modèle individuel en fonction d’autres caractéristiques dendrométriques. Ce modèle est ensuite validé sur un jeu de données indépendantes.
On discute finalement des propriétés de ce modèle tant au plan méthodologique et biologique qu’au
plan de ses possibilités d’utilisation.
branchaison / houppier / modélisation / ressource en bols / qualité du bols / Picea abies
INTRODUCTION
This sofware and the results of the
a system for predicting the quality of the coniferous wood resources from the data recorded by regional or national forest
inventories. This project deals specifically
with Norway spruce in northeastern France
present study will be integrated into
Description and modelling of tree branchimay be carried out in various congrowth and yield investigations, silvicultural and genetic experiments, logging
and wood quality studies. The analysis
and the prediction of branch size (ie
branch diameter) is obviously one of the
most important features of branchiness
studies. Several authors have already considered the limbsize at various heights:
Madsen et al (1978), at 2.5, 5 and 7.5 m
from ground level; Hakkila et al (1972), at
70% of the total height, De Champs
(1989), at the fourth and eighth whorl
counted from tree base; Maguire and
Hann (1987), at the point where the radial
extension of the crown is at its maximum.
ness
texts:
Other authors (Ager et al (1964) and
Western (1971) in Kärkkaïnen (1972) op
cit; Kärkkäinen (1972), Uusvaara (1985))
observed the relationship between limb
size and the distance from the top of the
stem. However, few studies have tried to
model this vertical trend and predict the
maximum limbsize anywhere along the
(Maguire et al, 1990, on Douglas fir).
This study aims to develop a limbsize
(ENGREF, INRA, UCBL, 1990).
Until now the project has focused on
mid-size with a diameter at breast height
(DBH) ranging between 15 and 35 cm.
There are 2 reasons for this choice: 1), this
size range will provide most of the stems
that will be harvested in the coming decades; 2), the prediction of the quality of
these logs is important because they may
either be sawn or utilized as pulpwood.
Applications of this study are not limited
to this particular project, since branching
structure can also be related to growth
modelling. Indeed, crown development and
recession are intimately linked to wood
yield through the interactions between
branch size, leaf area and carbon assimilation rate. Therefore, information on branch
size at various stages of stand development provide an insight into the dynamic
interactions between stem and crown.
stem
model
that
links
standard
whole-tree
measurements (age, total height, diameter
at breast height) to the required inputs of a
wood quality simulation software (Simqua;
Leban and Duchanois, 1990). This software requires information on stem taper,
ring width patterns and branching structure
(insertion angle, diameter, number of nodal and internodal branches). It can then
simulate the sawing process for any board
sawn from any stem for which this detailed
information is available. It can further simulate lumber grading by examination of the
4 faces of each board and application of
grading rules (for instance, French grading
rules for softwood lumber).
MATERIAL AND METHODS
Study area
All the trees were sampled in the Vosges department, in the northeastern part of France where
Norway spruce stands are mostly located in the
Vosges mountains, at elevations ranging from
400 to 1 100 m. The approximate annual precipitation is between 800 and 2 200 mm while mean
temperature ranges from 8 to 5 °C. Snow is
abundant above 800-900 m.
In the pre-Vosgian hills, sandstone with voltzite prevails on the western side, while much di-
versity appears (limestone, clay, sandstone)
on
the eastern side. The lower Vosges, between
350 and 900-1 000 m, are composed of triassic
limestones, which produce acid soils covered by
forests, and also permian limestones, which
definition of the latter parameter,
cal analysis section).
see
the Statisti-
yield richer soils that are seldom occupied by fo-
high Vosges are composed of granites of various kinds, producing primarily rich
soils, although these soils can sometimes be
poor to very poor (Jacamon, 1983).
rests. The
Data collection
known.
For the first 2 subsamples, the following variables were measured:
the length of each annual shoot and the distance from the top of the tree to the upper bud
scale scars (measured to the nearest 2 cm);
the diameter over bark for each whorl branch
(ie having a diameter > 5 mm) with a digital caliper (to the nearest mm and at a distance from
the bole that was approximately equal to one
branch diameter);
the "height to the live crown" which was defined as the height from the base of the tree to
the first whorl including more than threequarters of green branches (modified from Maguire and Hann, 1987, op cit);
the total height of the stem and the diameter
at breast height;
the age by counting the number of rings at the
stump after felling.
For the third subsample, only the diameter of
the thickest whorl branch, instead of the diameter of each whorl branch, was measured.
Subsample 2
Statistical analysis
In 1989, 16 trees were removed by thinning in a
private experimental plantation, managed by AFOCEL (Association Forêt-Cellulose). This stand
represents a fairly intensive silvicultural regime
when compared with usual practices carried out
in non experimental stands. The seedlings (6
years in the nursery) were installed in 1961 and
Two kinds of data were used: "the branch descriptors" and the "whole-tree descriptors". The
latter were the standard tree measurements and
different crown heights and crown ratios:
AGE = total age of the tree (in years);
DBH diameter (of the stem) at breast height
-
Sampling
subsamples were collected, 2 for building
the model and the third one for its validation.
The trees of the 2 first subsamples were measured after felling whereas the last subsample
was obtained by climbing the trees.
Three
-
-
Subsample 1
sample trees (between 30 and 180 years of
came from public forests managed by the
ONF (Office National des Forêts). In 1988, 10
trees without severe damage from late frosts
and/or forest decline (in upper elevations) were
sampled in 10 stands, for which the current density ranged between 500 and 1 500 stems per
ha. The past silviculture of these stands was unThe
age)
then thinned in 1974, 1983 and 1989.
-
-
=
(in cm);
H
Subsample 3
belonging to the first subsample, and for 7 trees in each of these stands,
the diameter of the thickest whorl branch per annual shoot was collected up to the maximum
height that it was possible to reach by climbing.
For 9 of the 10 stands
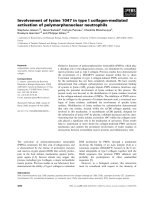
Figure 1 shows the frequency of samples
by diameter at breast height, total stem
height, total age and crown ratio (for an exact
trees
total height of the stem (in cm);
H/DBH = = ratio between H and DBH;
=
HFLB =
height to the first live branch (in cm);
= height to the base of the live crown as
previously defined (in cm);
HC average of the 2 previous heights, HFLB
and HBLC (in cm);
HBLC
=
X
=
absolute distance from the upper bud scale
of the annual shoot to the top of the stem
scars
(in cm)
XR = 100 X/H = relative distance from the upper
bud scale scars of the annual shoot to the top of
the stem (in %).
DBR = diameter of the branch
The "branch descriptors" were relative either
to an individual branch or to the whorl (or to the
annual shoot) where the branch is located:
(in cm).
In the nonlinear models that were tested, we
focused on the prediction of the diameter of the
thickest branch per annual shoot, DBRMAX.
The
variables (ie the predictors)
the whole-tree measurements as well as
the absolute and relative distances to the top 1
.
The analysis was carried out in 4 steps:
independent
RESULTS
were
First step: We tried to model the variation of
DBRMAX along each stem with individual equations (one per tree) according to the relative distance to the top of the stem, XR :
where i denotes the ith tree, jthe jth annual
i
shoot,Θ the model parameters specific to the
i th tree and ϵ random homoscedastic and non
i,j
autocorrelated variable.
Second step: We analyzed the variability of the
parameters Θ in relation to the whole tree dei
scriptors and then tried to fit temporary equations of the following type:
&iatehT ;
=
, , , /DBH
iiii
g(DBH H AGE H CR 1CR 2
,
,,
ii
(2)
, , , ψ)
i i i η
HFLB HBLC HC +i
CR 3
,
i
where ψ denotes
common
the
global
model parameters
to all trees and η a random error.
i
Third step: We moved from the individual models towards a global model by progressively replacing the Θ parameters in (1) by their predici
tions (equation 2). We finally obtained models of
the following form:
i,j i,j i i i
DBRMAX f(XR Θ(DBH H AGE
,,,,
,
/DBH ,...;
i i i,j
H CR1 ψ)) + ϵ
=
Individual models
Several preliminary models were explored
and tested. A modified Chapman-Richards
equation was one of the best:
(ie the
differential form of the usual Chapman-Richards model with a, β and y be-
ing parameters:
a>
However, it did
0, β and &gam a; ≥ 1).
adequately describe
the peak of the experimental curve around
the thickest branches of the stem. Indeed,
the prediction of the thickest branch of the
tree was not efficient, either for the location
of this branch along the stem or for its diameter.
not
By observing the actual DBRMAX distrialong the stem, the idea was proposed to choose a segmented second order polynomial model (Max and Burkhardt,
bution
1975; Tomassone et al, 1983, p 119-122;
with a join point value (ξ) which is the location of the estimated thickest branch:
(3)
These global models were then compared with
the individual ones in order to check that there
was no great loss in accuracy. These 3 first
steps only used the data from the first 2 sub-
samples.
Fourth step: We used the data of the third sub-
sample to validate the model and then put the 3
data sets together and re-estimated parameters
for a final global model.
where a,
eters:
a
β, γ and ξare constrained param> 0, β < 0, y< 0 and
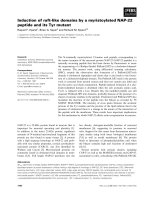
This model has the following properties
the model and its first-order
derivative are continuous; b) α/H is the
slope of the DBRMAX over the X curve at
the top of the tree (ie a is the slope of the
DBRMAX over the XR curve): α/H is therefore related to the geometry of the top of
the crown; c) X ξ.H is the distance be0
tween the top of the stem and the location
of the thickest branch; d) the thickest
branch of the stem has a predicted value
noted Max (DBRMAX):
(see fig 2): a)
=
independent parameters (ie 4 basic paramby equation 5), estimates of β
eters related
derived from the estimates of a and;
&xi
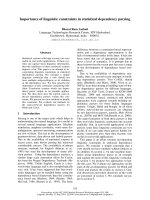
3 shows how
the model fits to the data for 2 different
trees (a relatively good and a relatively bad
fit). For the worst fit, the model slightly underestimates the greatest diameter and
there is a small discrepancy between the
observed and predicted locations of the
thickest branch.
were
by using equation (5). Figure
Construction of a single global model
This model was fitted independently for
each tree. Since the model contains only 3
At first, we tried to predict the estimated
values of Max(DBRMAX) and(ie the diameter and the location of the thickest
branch of the i th tree). Among various
0
a was not significantly different from 0;
this parameter was therefore removed in
further analysis.
Since the best prediction of Max
(DBRMAX) was not as good, we decided
to incorporate equation (7) into the individual models by substituting for ξ. We then
reestimated the parameters a and y of
model (4) in order to investigate the possible relationships between a and y and to
predict these parameters by using the
whole-tree parameters (β was not directly
estimated but was deduced from a and;
&xi
by using equation 5).
Among various combinations,
equations were:
the best
(Statistics of fit: R2= 0.96; RMSE = 0.012;
(Statistics of fit: R 2 = 0.77;
The regression expressions of ξ, a and
y (eq 7, 8 and 9) were then introduced in
the individual models to form a global model which was estimated simultaneously for
all the trees of the first 2 subsamples. After
some modifications due to high correlations between some parameters, the model form was:
combinations of 1, 2, 3 or more whole-tree
descriptors, the best fit for ξ was given by:
2
1
0
ξ =a
+
CR
a
(7)
(Statistics of fit: R2= 0.73; RMSE 5.4%
(root mean squared error); P > F =0.001)
=
(Statistics of fit for 699 observations and
26 trees: RMSE
0.36 cm; P > F
=
=
0.0001)
The parameter values and their standard errors were estimated as follows in
table I.
The 2 estimated asymptotic correlations
among parameter estimates with the highest absolute value were: r (a a -0.95
,) =
86
r (a a -0.75.
,) =
78
els (RMSE
0.32 cm for model 4 vs
RMSE 0.36 cm for model 10), the value
of the F statistic was fairly high (F= 3.69)
according to the high degrees of freedom
(ie 70 and 621). Thus it appeared that the
global model was slightly but significantly
less accurate than the set of individual
models and that a part of the within- and
between-tree variation of branch size could
not be predicted by the tested whole-tree
descriptors and by the relative distance to
the top of the tree.
=
=
Comparison between the tree-by-tree
model and the overall model
VALIDATION
Although the hypotheses necessary for its
application are likely to be at least partially
violated (there is a within-tree autocorrelation and the within-tree error is not rigorously homoscedastic) we used an F statistic to test the loss of precision between
models (4) and (10). We noted SSE, the
sum of squared residuals, obtained after
the nonlinear adjustments: the sum of SSE
for the 26 individual models was: 64.0
(with 621 degrees of freedom); SSE for
the overall model was: 90.6 (with 691 degrees of freedom).
Although the root mean squared error
was not very different between the 2 mod-
Validation
on
the
third subsample
global model
26 trees predicted the DBRMAX distribution for the 60
trees of the validation sample (ie we used
the parameter values given above). The
difference between actual and simulated
values (observed DBRMAX minus predictAt first,
checked how the
we
(10) previously adjusted
ed
on
DBRMAX) and the square of this differ-
ence were
calculated for each observation
(a total of 1 728 observations). We obtained the following results:
the mean difference was -0.229 cm,
which indicates that the model overestimated limbsize for the validation sample;
-
-
the
sum
of
squared
771.68, which gives
differences
was
root mean squared
difference equal to 0.66 cm which is considerably higher than the RMSE obtained
for the 26 trees of the first two samples.
a
Global fit of the same model
with all tree subsamples
The root mean squared error for the 2 427
observations and the 86 trees was: 0.49
cm.
dard
The parameter values and their stanerrors were estimated in table II.
The estimated asymptotic correlation
among parameter estimates with the highest absolute value was: r (a a -0.73.
,) =
67
Improvement of the global model
for the third subsample
Using the
same strategy as described in
Construction of a single global model for
the 60 trees of the third subsample we first
obtained:
The global model was then reestimated
using these equations; it provided a root
mean squared error equal to 0.49 cm.
Development of a global model
for the 3 subsamples
The model obtained in Improvement of the
global model for the third subsample
above was finally adjusted to the 2 427 observations coming from all 86 trees. The
root mean squared error was 0.47 cm with
the following parameter values (since b
4
and bwere not significantly different from
11
zero, these parameters were removed)
(table III).
The estimated asymptotic correlation
among parameter estimates with the highest absolute value was: r (b b -0.82.
,) =
56
The fit of this model for 2 different trees is
illustrated in figure 4.
If adjusted to the 26 trees of the first
2 subsamples, this model provides a root
mean squared error equal to 0.37 cm
which is fairly similar to the 0.36 cm given
in Construction of a single global model.
Thus this last model was considered as the
best compromise for the whole data set.
DISCUSSION
is very restricted
so
nearly stopped, and
are
Biological interpretation
The predominant effect of the distance
from the tip, also observed and modelled
by Madgwick et al (1986), Maguire et al
(1990, op cit)) is actually the result of different complementary aspects:
-
softwood
crown, due to
species present a conical
a strong apical dominance;
the effect of the age of the branch: older
branches are located far away from the tip;
-
at a certain distance from the tip, the
branches belong to the part of the crown
where mutual inter-tree interference occurs (shading and stress marks);
-
further down, the branches belong to the
part of the crown where sunlight exposure
-
that their growth is
the ground they
near
dead.
Consequently, the first part of the model
with a curvilinear form predicts limbsize
from the tip of the stem to approximately
the base of the live crown: qualitatively, the
second degree polynomial equation takes
into account the intrinsic geometry of the
crown as well as the beginning of the effects of the mutual inter-tree shading. The
second part of the model which is also a
second degree polynomial describes the
part of the crown that goes from the base
of the live crown to the dead branches.
The estimated values of a b and
, , b
1 1
2
indicate that the thickest
branch seems to be actually located higher
than the base of the living crown (eg a
1
0.56 in Construction of a single global
model). Since the maximum of the curve is
3
b parameters
=
generally quite flat, there is
a wide portion
of the stem where maximum limbsize per
whorl is nearly constant. However, this
point should be analysed further to check
whether the difference between ξand base
of the living crown is due to an inadequacy
of the model or to an early effect of the
competition that precedes crown recession.
Concerning the overall model established for the 3 subsamples (see Development of a global model for the 3 subsamples), we noticed: 1) a slight overestimation of the DBRMAX for the smallest
trees (ie for most trees which have a DBH
< 16 cm; and 2) a slight but systematic underestimation for the trees which are located in edge conditions or in stands installed
on sites with steep slopes. This is probably
due to the fact that the standard whole-tree
measurements introduced in the model
cannot take into account the relative overdevelopment of the branches that are
oriented towards the best sunlight conditions.
Moreover the model underestimated
but frequently the maximum limbsize for the trees of the AFOCEL stand.
This is not really surprising since: 1),the
weight of these trees in the whole data set
is relatively small; and 2), they belong to a
stand which has been submitted to a more
intensive silviculture than the others (ie the
spacing conditions of these trees have
been more favourable to their growth).
Again, it is likely that the model does not
reflect their increased exposure to sunlight.
The crown ratio CR 3 and the height to
the first live branch (HFLB) turned out to
be the best crown parameters when we
tried to validate the model. This is probably
due to the fact that the proportion of trees
located in stands with steeper slopes
(> 20 °C) is higher in this part of the data
set. Steep slopes introduce an asymmetry
in the crown and produce a greater differ-
slightly
between the height to the base of the
(as previously defined) and the
height to the first five branch; the thickest
branches are located nearer to this latter
ence
live
crown
height.
For the first 2 samples, the crown ratio
CR 2 (ie the ratio 100.(H- HC)/H) was the
best predictor. When considering this reduced data set the weight of the trees belonging to the AFOCEL stand is high
(16 trees / 26 trees) in the regression analysis. Since this stand is more homogeneous (ie the total heights of the trees are
very similar) and the slope is gentle, the
crowns are nearly symmetrical and have a
regular external shape; hence, the difference between CR 2 and CR 3 does not
vary much from one tree to another.
Therefore all these remarks seem to be
consistent. The distribution of the maximum limbsize per annual growth unit along
the stem appears to be sensitive to the
symmetry of the crown and to the sunlight
exposure conditions.
Comparison with other models
Maguire et al’s model (Maguire et al, 1990,
op cit) focuses on young Douglas fir trees
from plantations before crown closure and,
hence, where the base of the live crown is
very near to ground level. The shape of
their model is curvilinear rather than linear
from tip down to stem base. This is consistent with the fact that, even without intertree competition for light, the growth of the
lower branches is reduced (Mitchell, 1975).
Due to younger ages and the opengrown condition of Maguire et al’s trees, it
is difficult to compare their results with
ours. However it is important to note that
their model does not separate the withinand between-tree variabilities, since the dimensions of the trees are not taken into
account. This might at least partially ex-
plain the great variance around their model and why our first attempts (not reported
here) to model branch size variation along
the stem without including whole-tree descriptors were not conclusive.
Vertical distribution of branch diameter
and growth conditions
Site
growth conditions (eg site index) are
partially hidden in the model by the use of
relative depth into the crown as an independent variable. To predict the actual
size of the branches, for instance in the
merchantable part of the stem, it is necessary to return to the absolute values of
depth in the crown which are linked with
height growth and therefore with site conditions.
Tree growth conditions are also determined by the current and initial stand densities, by the silvicultural practices and by
the competitive status of the tree. The
main effect of the stand management is reflected in crown development which is, at
least partially, included in the proposed
model through crown ratio variables. Nevertheless, as already observed for widely
spaced trees (ie AFOCEL stand) or for
edge trees, the overall model does not describe perfectly the trees submitted to favourable or asymmetrical sunlight exposure.
The growth conditions at high elevations imply branch and leader damage
which are caused by late frost and snow
weight. For some trees we indeed observed that the model does not describe
the peak of the empirical curves very well.
This fact could be explained, at least partly, by the occurrence of "ramicorn branches" that attain greater diameters than other
branches. Although these branches are
very important in lumber grading, they
have not been analysed in this study be-
of the absence of a good definition
in terms of limb size and insertion angle,
and because their occurrence cannot be
predicted with deterministic models.
cause
Vertical distribution of branch diameter
and genetic origin
On different families of a Polish provenance studied by Van de Sype (personal
communication), he observed that independently of growth vigour, branches are
proportionally thicker for certain families
than for others. Such differences have also
been established by Cannell and Bowler
(1977) on Picea sitchensis. Our sampled
trees probably belong to the same genetic
origin (ie the same provenance): the Gérardmer provenance. It will therefore be important to check whether a part of the residual variability around the model may be
attributed to genetic effects. This will be
done by fitting the model to various provenances.
As cited by Schmidt-Vogt (1977) and
also observed by Hakkila (1971),different
patterns of branchiness exist: brush form,
comb form, flat form, with narrow or wide
lateral extension. Do these patterns have a
strong influence on the accuracy of our
model? Using our field notes we were not
able to establish an actual effect of branch
form. In fact, only three trees presented
comb-shaped branches and these trees
were accurately modelled. During future
sampling, such characteristics will have to
be noted again.
Utilization of the model
First, it must be emphasized that the model
developed in order to predict the
vertical trend in maximum limb size
point of time and that it does not repre-
was
mean
at a
sent the dynamics of the branching structure (ie branch growth and crown reces-
sion). This point may partly explain the difference that was observed between ξ and
the base of the living crown (see Biological
interpretation section). Above all, it implies
that the direct application of the model to
the outputs of a tree growth model may
lead to some inconsistencies between the
successive predictions of maximum limb
size at a given height for the same tree.
One interesting feature of this model is
that it provides relatively good estimates of
the maximum branch diameters along the
stem as well as quantitative indications
about the variability around these predictions. Although the underlying statistical
assumptions are probably violated, the
confidence intervals (see figs 3, 4) provide
rough estimates of extremes in limbsize.
As previously stated, a more rigorous statistical analysis recognizing autocorrelated
and heteroscedastic errors was outside of
the scope of this paper and will now be
performed. Information about the variability
around the model could then be used in
Monte-Carlo simulations to provide probabilistic inputs to SIMQUA rather than
purely deterministic predictions.
The proposed model has been established for mid-size trees (15 cm ≤ DBH ≤
35 cm) in even-aged stands. It cannot be
extrapolated to smaller or bigger trees
without further validation. Indeed, the behaviour of the model for bigger trees is unknown and the slight overestimation for the
smallest trees indicates that the model
should be improved for small and young
trees. Its application to uneven-aged
stands or to steep slopes should also be
avoided due to the highly asymmetrical development of the crown in these conditions.
One other
practical problem is that
rarely performed in operational surveys (eg National
measurement of crown ratio is
Forest Survey data) so that CR2 or CR
3
values will have to be estimated from other
whole-tree descriptors (eg AGE, DBH, H).
This procedure will probably introduce a
major source of variability which has not
been assessed in this study.
The model has several other
tions as well:
applica-
for logging operations and for standing or
felled tree grading, information about the
height of the thickest branch or about the
height to a given branch size are very useful. For instance, in the Soviet Union (Arlauskas and Tyabera, 1986) or in Finland
(Hakkila et al, 1972, op cit; Leban, 1989)
the size of the branches combined with the
length of the merchantable logs determine
the quality and value of trees;
-
for pruning, the choice of the tools as
well as the assessment of the costs also
require information about the size of the
branches that would be removed by differ-
ent pruning lifts (Riou-Nivert, personal
communication);
lastly, due to the close links between
-
maximum or mean whorl limbsize and
branch length, our model could be used to
predict the external shape of the crown.
CONCLUSION
Since the estimated confidence intervals
are relatively broad around the predicted
limbsize values and since lumber grading
rules are heavily dependent on the maximum limbsize in boards, trees with similar
whole-tree descriptors may actually produce different grades. Thus, the accuracy
of limbsize predictions is crucial when attempting to apply such models to operational inventory data to estimate wood
product quality.
Our approach provides
this
question, but there
are
an
insight
into
still many im-
portant points to be addressed: 1),the improvement of the accuracy of the pro-
posed
model by taking into account more
precisely the effects of site and silvicultural
treatments; 2), the analysis of the genetic
variability of limbsize distributions; 3), a
more rigorous statistical analysis of the regression models; 4), the proposal of probabilistic simulation procedures that use
the information provided about the residual
variability around the model; 5), and a dynamic approach of branching structure
that would allow the establishment of a direct and consistent link with growth and
yield models.
ACKNOWLEDGMENTS
of forest stands, trees and terrain in
Sweden)
Stud For Suec 20
Arlauskas LS, Tyabera AP (1986) Branchiness
of stems in Norway spruce forests in Lithuania. Lesnoï Zh 1, 13-16.
Cannell MGR, Bowler KC (1977) Spatial arrangement of lateral buds at the time they
form on leaders of Picea and Larix. Can J
For Res 8, 129-137
De Champs J (1989) Effet de la densité de plantation sur la croissance en diamètre, la forme
et la branchaison du Douglas. Ann AFOCEL
1988, 232-283
ENGREF, INRA, UCBL (1990) Modélisation de
la Croissance et de la Qualité du Bois de
l’Épicéa Commun : Objectifs, Méthodes et
Premiers Résultats. ENGREF (Nancy), Doc
Interne, october 1990, 42 pp
Hakkila P (1971) Coniferous branches as a raw
material source. Commun Inst For Fenn 75-
1, 60 pp
This work was partially supported by two grants
from the French Ministry of Agriculture and Forests. The authors are grateful to JF Dhôte (Laboratoire ENGREF/INRA de Recherches en
Sciences Forestières, Nancy) and G Nepveu
(Station de Recherches sur la Qualité du Bois)
for reviewing the manuscript, to C Houssement,
P Michel, J Perrin, A Perrin, C Herbé and P Gelhaye (Station de Recherches sur la Qualité des
Bois, INRA, Nancy) and H Joannès (Station de
Génie Logiciel, INRA, Nancy) for technical assistance.
Hakkila P, Laasasenaho J, Oittinen JK (1972)
Branch data for logging work. Folia For (Helsinki) 147, 15 pp
Jacamon M (1983) Arbres et Forêts de Lorraine.
SAEP, Colmar
Kärkkäinen M (1972)
on the
branchiness of Norway spruce. Silva Fenn 6
They also wish to thank the Office National
des Forêts (ONF) and the Association ForêtCellulose (AFOCEL) for their authorization to
fell and/or measure their trees. They also are
deeply grateful to D Maguire (College of Forest
Resources, University of Washington, Seattle)
and another anonymous reviewer for their helpful comments on the first version of the paper.
Leban JM, Duchanois G (1990) SIMQUA : un
logiciel de simulation de la qualité des bois.
Ann Sci For 47 (5), 483-493
Madgwick HAI, Tann CO, Fu Mao-Yi (1986)
Growth development in young Picea Abies
stands. Scand J For Res 1, 195-204
n
Madse TL, Moltensen P, Olesen PO (1978)
The influence of thinning degree on basic
density, production of dry matter, branch
thickness and number of branches of Norway
spruce. Forstl Forsøgsvaes Serv Dan 36
REFERENCES
Ager BH, Nilsson NE, von Segebaden G (1964)
Beskrivning av vissa skogstekniskt betydelsefulla bestands- och trädegenskaper samt
terränförhallanden
(Description of some for
logging operations important characteristics
Observations
(2), 90-115
(1989) Compte-Rendu de Mission
Leban JM
Finlande,
01/04/1989-15/04/1989.
Mission No 634/89
en
INRA,
(H.2.22), 183-203
Maguire D, Hann D (1987) A stem dissection
technique for dating branch mortality and reconstructing past crown recession. For Sci
33 (4), 858-871
Maguire D, Mœur M, Bennett WS (1990) Simulating branch diameter and branch distribu-
Douglas fir. IUFRO World
Congr Montreal, Quebec, Canada, August 9,
tion in young
1990
Max TA, Burkhardt HE (1976) Segmented polynomial regression applied to taper equations.
For Sci 22, 283-289
Mitchell KJ (1975) Dynamics and simulated
yield of Douglas fir. For Sci Monogr 17, 39 pp
Schmidt-Vogt H (1977) Die Fichte. Paul Parey,
Hamburg, 3 vol
Tomassone R, Lesquoy E, Millier C (1983) La
Régression, Nouveaux Regards Sur Une Ancienne Méthode Statistique. Masson, Paris,
180 pp
(1985) The quality and value of
goods from plantation-grown Scots pine.
Commun Inst For Fenn (Helsinki) 130, 53 pp
Western H (1971) Tre- og Kvistdata (Tree and
branch study). Norske Skogsforsoksvesen
Driftsteknisk Rapp No 10, 83-93
Uusvaara O
sawn