Báo cáo khoa học: "Branchiness of Norway spruce in northeastern France: predicting the main crown characteristics from usual tree measurements" doc
Bạn đang xem bản rút gọn của tài liệu. Xem và tải ngay bản đầy đủ của tài liệu tại đây (1.3 MB, 28 trang )
Original
article
Branchiness
of
Norway
spruce
in
northeastern
France:
predicting
the
main
crown
characteristics
from
usual
tree
measurements
F Colin
F
Houllier
1
INRA,
Centre
de
Recherches
Forestières
de
Nancy,
Station
de
Recherches
sur
la
Qualité
des
Bois,
Champenoux,
F-54280
Seichamps;
2
ENGREF,
Laboratoire
ENGREF/INRA
de
Recherches
en
Sciences
Forestières,
Unité
Dynamique
des
Systèmes
Forestiers,
14
rue
Girardet,
F-54042
Nancy
Cedex,
France
(Received
5
March
1992;
accepted
6
July
1992)
Summary —
This
paper
is
part
of
a
study
proposing
a
new
method
for
assessing
the
quality
of
wood
resources
from
regional
inventory
data.
One
component
of
this
method
is
a
wood
quality
simulation
solfware
that
requires
detailed
input
describing
tree
branchiness
and
morphology.
The
specific
purpose
of
this
paper
is
to
construct
models
that
predict
the
main
characteristics
of
the
crown
for
Norway
spruce.
One
hundred
and
seventeen
spruce
trees
sampled
in
northeastern
France
have
been
de-
scribed
in
detail.
The
position
of
the
different
parts
of
the
crown,
the
size,
the
insertion
angle,
the
num-
ber
and
the
position
of
the
whorl
branches
have
been
predicted
as
functions
of
usual
whole-tree
meas-
urements
(ie
diameter
at
breast
height,
total
height,
total
age)
and
of
the
position
of
the
growth
unit
along
the
stem
(ie
distance
to
the
top,
and
number
of
growth
units
counted
downward
or
upward)
for
branchiness
prediction.
The
most
efficient
predictors
of
crown
descriptors
have
been
established
and
preliminary
models
are
proposed.
branchiness
/ Picea
abies
Karst
/ modelling
/ wood
quality
/ crown
ratio
/ wood
resources
Résumé—
Branchaison
de
l’épicéa
commun
dans
le
Nord-Est
de
la
France :
prédiction
des
prin-
cipales
caractéristiques
du
houppier
à
partir
des
mesures
dendrométriques
usuelles. Cette
étude
s’insère
dans
le
cadre
d’un
projet
qui
vise
à
proposer
une
nouvelle
méthode
d’évaluation
de
la
qualité
de
la
ressource
à
partir
des
données
issues
d’un
inventaire
forestier
régional.
Ce
projet
s’appuie
notam-
ment
sur
un
logiciel
de
simulation
de
la
qualité
des
sciages
qui
nécessite
une
description
détaillée
de
la
morphologie
et
de
la
branchaison
de
chaque
arbre.
Cet
article
concerne
spécifiquement
l’épicéa
com-
mun
et
vise
à
proposer
des
modèles
de
prédiction
des
principales
caractéristiques
du
houppier
à
partir
des
données
dendrométriques
usuelles.
Cent
dix
sept
épicéas
échantillonnés
dans
le
Nord-Est
de
la
France
sont
décrits
en
détail.
La
position
des
différentes
zones
du
houppier,
le
diamètre,
l’angle
d’inser-
tion,
le
nombre
et
la
position
des
branches
verticillaires
sont
prédits
à
partir
des
variables
dendrométri-
ques
usuelles
(diamètre
à
1,30
m,
âge
et
hauteur
totale)
et
de
la
position
de
l’unité
de
croissance
consi-
dérée
le
long
de
la
tige
(distance
à
l’apex,
âge
ou
numéro
de
l’unité
de
croissance)
pour
la
prédiction
de
la
branchaison.
Les
variables
dendrométriques
les
plus
efficaces
(pour
la
prédiction)
sont
mises
en
évi-
dence
et
des
modèles
préliminaires
sont
proposés.
branchaison
/
Picea
abies
Karst
/
modélisation
/
qualité
du
bois
/
houppier
/
ressources
en
bois
INTRODUCTION
The
current
interest
in
branchiness
studies
for
forest
trees
is
linked
to
several
comple-
mentary
factors:
i)
the
search
for
a
better
description
of
the
role
of
the
crown
com-
partment
in
growth
and
yield
studies
(Mitchell,
1969, 1975;
Vaïsänen
et
al,
1989)
and
in
forest
decline
evaluation
(Roloff,
1991);
ii)
the
need
for
rationalizing
harvesting,
logging
and
industrial
opera-
tions
which
are
affected
by
limb
size
(Hak-
kila
et
al,
1972);
iii)
the
necessity
of
as-
sessing
the
influence
of
silvicultural
practices
on
the
quality
of
wood
products
which
depends
partially
on
knottiness
(Kramer et al,
1971;
Fahey,
1991).
These
considerations
are
well
illustrated
by
the
recent
development
of
several
mod-
els
that
predict
both
the
growth
and
the
wood
quality
in
artificial
stands
(eg
Mitchell,
1988;
Vaïsanen
et
al,
1989)
and
by
the
con-
ception
of
a
software,
called
SIMQUA,
that
simulates
the
quality
of
any
board
sawn
in
a
tree
whose
stem
(ie
global
size,
taper
curve
and
ring
width
pattern)
and
branches
(ie
number,
location,
insertion
angle
of
each
nodal
or
intemodal
branch)
are
a
priori
known
(Leban
and
Duchanois,
1990).
This
software
has
to
be
fed
with
fairly
detailed
information
about
branchiness;
presently
these
data
have
to
be
measured
directly.
Of
course,
this
situation
does
not
meet
the
requirements
of
operational
ap-
plications
and
there
is
a
strong
need
for
predicting
crown
and
branchiness
charac-
teristics
from
usual
whole-tree
measure-
ments
(ie
total
age,
diameter
at
breast
height,
total
height,
etc).
The
present
study
was
initiated
in
this
context
with
the
specific
aim
of
developing
a
new
method
for
assessing
the
quality
of
wood
resources
on
a
regional
scale.
More
precisely
the
idea
was
to
use
jointly
the
database
of
the
French
National
Forest
Survey
(NFS)
and
Simqua
in
order
to
im-
prove
the
evaluation
of
the
various
wood
products
of
Norway
spruce
in
France.
Since
no
branchiness
data
are
collected
by
the
NFS,
the
following
question
arose:
is
it
possible,
merely
with
usual
tree
measure-
ments,
to
predict
the
branchiness
parame-
ters
wich
constitute
the
input
of
SIMQUA?
In
order
to
answer
this
question,
a
de-
tailed
description
of
a
small
sample
of
Nor-
way
spruce
was
made
and
we
focused
on
mid-size
trees
with
a
diameter
at
breast
height
(DBH)
that
ranged
between
15-
35 cm
(Colin
and
Houllier,
1991).
A
latter
paper
presented
results
for
the
maximal
no-
dal
branch
size.
Our
objectives
here
are
to
complete
it:
i)
by
exploring
the
relationships
between
usual
whole-tree
measurements
and
other
branchiness
characteristics;
and
ii)
by
displaying
preliminary
models.
This
paper
deals
mainly
with
whorl
branches.
Al-
though
small
internodal
branches
do
play
some
role
in
wood
quality
assessment,
it
was
considered
that
quality
is
mostly
deter-
mined
by
the
characteristics
of
the
largest
branches.
Moreover,
from
a
more
scientific
point
of
view,
the
study
of
small
branches
leads
to
some
technical
difficulties
(eg
death
and
self-pruning)
that
were
beyond
the
scope
of
this
first
approach.
MATERIALS
AND
METHODS
Data
collection
The
study
area
has
been
described
in
Colin
and
Houllier
(op
cit).
Four
subsamples
called
S1,
S2,
S3
and
S4
were
collected.
The
number
of
trees
amounted
to
12
for
S1,
18
for
S2,
63
for
S3
and
24
for
S4.
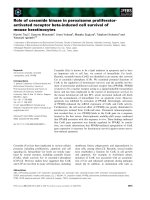
Figure
1
provides
the
frequency
distri-
bution
of
sampled
trees
for
various
characteris-
tics:
total
height,
DBH,
age
and
crown
ratio
(see
below).
These
distributions
are
not
balanced
for
two
reasons:
the
study
was
focused
on
mid-size
trees
which
were
relatively
young
(20-60
yr);
the
successive
subsamples
were
carried
out
with
different
objectives
(eg
the
18
trees
in
S2
came
from
the
same
even-aged
stand
and
were
sampled
for
studying
within-stand
variability).
For
three
subsamples
(S
1,
S2
and
S4)
meas-
urements
were
taken
after
felling,
whereas
S3
trees
were
described
by
climbing
them.
The
lat-
ter
operation
was
primarily
intended
to
validate
limb-size
distribution
models
(Colin
and
Houllier,
op
cit).
The
trees
belonging
to
subsamples
S1
to
S3
were
already
described
in
Colin
and
Houllier
(op
cit).
The
trees
of
subsample
S4
came
from
forests
managed
by
the
ONF
(l’Office
National
des
Forêts)
and
were
located
in
the
Vosges
mountains
(northeastem
France).
Branchiness
was
described
by
measuring
the
diameter
(to
the
nearest
2
mm)
and
length
(to
the
nearest
2 cm)
of
the
branches
whose
diameter
was
>
5
mm,
and
the
number
of
whorls
per
1-meter-
length-unit.
The
following
whole-tree
descriptors
were
measured:
the
diameter
at
breast
height
(to
the
nearest
5
mm),
the
total
height
(to
the
nearest
10
cm),
the
age
at
the
stump
(to
the
nearest
1
to
5
yr,
depending
on
age),
the
height
to
the
first
live
branch,
the
height
to
the
first
dead
branch
and
the
height
to
the
base
of
the
live
crown
(to
the
neared
10
cm)
which
was
de-
fined
by
the
first
whorl
were
at
least
tree-
quarters
of
branches
were
still
living
(modified
from
Curtis
and
Reukema,
1970;
Maguire
and
Hann,
1987;
Kramer,
1988).
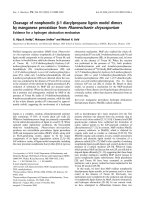
Variables
Two
kinds
of
data
were
used:
’branch
descrip-
tors’
and
’whole-tree
descriptors’.
The
latter
were
the
usual
tree
measurements
and
different
crown
heights
and
crown
ratios
(fig
2a):
AGE=
total
age
of
the
tree
(in
yr);
DBH=
diame-
ter
of
the
stem
at
breast
height
(in
cm);
H
= total
height
of
the
stem
(in
m);
H/DBH
= ratio
be-
tween
H and
DBH
(in
cm/cm);
HFLB
= height
to
the
first
live
branch
(in
m);
HFDB
= height
to
the
first
dead
branch
(in
m);
HBLC
= height
to
the
base
of
the
live
crown
as
previously
defined
(in
m);
CR
= 100
(H-HBLC/H)
(in
%);
CR
3
=
100
(H-HFLB/H)
(in
%).
The
’branch
descriptors’
were
relative
either
to
an
individual
branch
or
to
the
whorl
(or
to
the
annual
shoot)
where
the
branch
is
located
(figs
2b,c):
X
= absolute
distance
from
the
upper
bud
scale
scars
of
the
annual
shoot
to
the
top
of
the
stem
(in
m);
RX
= 100
(X/H)
=
relative
distance
from
the
upper
bud
scale
scars
of
the
annual
shoot
to
the
top
of
the
stem
(in
%);
NGU
=
No
of
the
growth
unit
counted
downward
from
the
top
of
the
stem;
DBR
= diameter
of
the
branch
(in
cm);
ANGLE
= external
insertion
angle
of
the
branch
with
the
stem
(in
degrees);
DBRMAX
=
diameter
of
the
thickest
branch
for
an
annual
shoot
(in
cm);
DBRAVE
=
mean
diameter
of
whorl
branches
for
an
annual
shoot
(in
cm);
NTOT
=
total
No
of
observed branches
(dead
or
living)
for
an
annual
shoot;
NW
= total
No
of
observed
whorl
branches
(dead
or
living)
for
an
annual
shoot;
N
10
=
total
No
(for
an
annual
shoot)
of
branches
(dead
or
living)
whose
diameter
is
≥ 10
mm;
N
05
=
total
number
(for
an
annual
shoot)
of
branches
(dead
or
living)
whose
diam-
eter
is
≥
5 mm.
Statistical
analysis
The
data
were
analysed
using
the
SAS
Statisti-
cal
Package
(version
SAS
6.03)
on
a
Compaq
386/25
computer
with
an
8
Megabytes
extended
memory.
During
statistical
analysis,
trees
with
errone-
ous
field
data
or
many
missing
data
were
re-
moved.
Linear
and
nonlinear
regression
meth-
ods
(Tomassone
et
al,
1983)
were
extensively
used.
First,
linear
regressions
were
carried
out
in
order
to
select
the
best
combinations
of
inde-
pendent
variables
by
using
adjusted
R-square
criterion
(R
adj
2
).
Nonlinear
regressions
were
then
used
to
establish
most
of
the
final
models.
The
proposed
equations
were
chosen
as
com-
promises
between
i)
the
search
for
a
good
fit
as
measured
by
adjustment
statistics
and
by
a
visu-
al
analysis
of
residuals
and
ii)
the
parsimony
and
the
robustness
of
the
model
(ie
we
tried
to
avoid
a
too
great
number
of
parameters).
The
following
results
include
parameter
estimates,
their
standard
error,
and
their
95%
confidence
interval,
root
mean
squared
error
(RMSE)
or
weighted
mean
squared
error
(WMSE),
adjusted
R-square
(R
adj
2
=
1
-
[(n-1)
/
(n-p)]
(1 -
R2
)),
global
F-test,
weighting
expressions
(when
weighted
least
squares
were
used)
and
a
graph-
ic
display
of
residuals.
For
nonlinear
models,
these
statistics
have
only
asymptotic
properties
(Seber
and
Wild,
1989).
Generalized
linear
models
(Dobson,
1983)
were
introduced
when
the
dispersion
of
the
data
did
not
look
like
a
normal
distribution
around
a
general
trend
and
when
the
random
error
seemed
to
be
multiplicative
rather
than
additive.
These
models
were
fitted
by
maximizing
the
like-
lihood
of
the observations.
The
choice
of
the
model,
which
includes
both
the
equation
of
the
deterministic
trend
and
the
probability
distribu-
tion
of
the
random
error
(eg
normal,
lognormal,
Weibull)
was
based
on
the
value
of
the
likeli-
hood
and
on χ
2
statistics
for
testing
the
individu-
al
significance
of
variables
and
covariates
(SAS,
1988).
Other
methodological
aspects
The
problem
we
deal
with
is
quite
different
from
those
considered
by
Mitchell
(1975),
Väisänen
et al
(op
cit)
or
Ottorini
(1991),
whose
main
aim
was
to
stimulate
branchiness
as
the
result
of
the
dynamic
functional
processes
that
link
stand
density
and
tree-to-tree
competition
to
crown
de-
velopment
and
to
stem
growth.
Our
objective
here
is
more
descriptive
and
static,
since
we
ad-
dress
the
problem
of
predicting
crown
and
branchiness
characteristics
from
usual
whole-
tree
measurements
for
trees
that
already
exist
and
that
are
described
by
usual
inventory
data
(ie
the
past
silviculture
of
the
stands
as
well
as
the
site
quality
and
the
genetic
origins
are
most-
ly
unknown).
However,
the
search
for
good
predictors
of
crown
morphology
is
not
independent
from
our
knowledge
on
the
processes
that
influence
crown
development.
The
most
important
factors
are
the
genetic
origin
and
the
site,
the
stage
of
development
of
the
tree
as
measured
by
its
age,
its
size
(ie
H
or
DBH)
or
its
growth
rate
(ie
length
of
the
annual
shoot),
as
well
as
the
local
density
of
the
stand
and
the
social
status
of
the
tree,
which
both
depend
on
silviculture.
These
factors
interact
and
simultaneously
affect
stem
size
and
crown
development.
For
example,
genetic
ori-
gin,
site
and
silvicultural
conditions
have
a
strong
influence
on
the
global
vigour
of
the
tree.
As
a
consequence,
when
selecting
the
usual
whole-stem
descriptors
that
have
good
allomet-
ric
relationships
with
crown
and
branch
charac-
teristics
and
when
proposing
models,
the
difficul-
ty
that
we
face
is
that
the
usual
stem
descriptors
are
correlated
and
that
it
is
not
possible
to
di-
rectly
assess
the
underlying
causes
of
the
rela-
tionships
that
we
observe.
However,
by
using
AGE,
H and
DBH
and
their
various
combina-
tions,
especially
H/DBH,
it
is
often
possible
to
roughly
separate
site,
genetic
and
silvicultural
effects.
RESULTS
Global
description
of the
crown
The
dependent
variables
were
height
to
the
first
dead
branch
(HFDB),
height
to
the
first
living
branch
(HFLB),
height
to
the
base
of
the
living
crown
(HBLC)
and
crown
ratio
(CR)
(fig
2a).
The
tested
independent
variables
were
total
height
(H),
total
age
(AGE),
diameter
at
breast
height
(DBH
in
cm)
and
various
combinations
of
these
variables,
such
as:
1/H,
H2,
H/DBH,
etc.
Crown
ratio
(CR)
For
the
117
trees,
the
best
individual
pre-
dictors
were
AGE,
DBH/H
and
AGE
2
(R
adj
2
=
0.21).
A
more
detailed
analysis
in-
dicated
that
the
best
fit
of
CR
using
AGE
was
obtained
with
the
expression
exp(-α
AGE
β
)
+
δ
where
a,
β and
δ
are
parame-
ters,
the
best
value
for
β being
nearly
1.5.
It
was
then
established
that
H/DBH and
H2
also
had
to
be
included
in
the
regression
equation
so
that
we
finally
obtained:
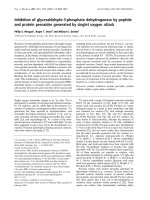
WMSE
=
84.6;
residuals
vs
predicted
val-
ues
are
presented
in
figure
3a
and
param-
eter
estimates
are
provided
in
table
I.
In
order
to
take
into
account
the
fact
that
the
data
set
includes
both
data
for
iso-
lated
trees
and
data
for
trees
belonging
to
the
same
stand
(17
trees
in
the
same
stand
for
S2,
7-8
trees
per
stand
for
S3
),
the
weight
of
each
tree
was
inversely
pro-
portional
to
the
number
of
trees
belonging
to
the
same
stand.
This
weighting
proce-
dure
led
to
a
good
fit
especially
for
the
data
collected
on
old,
isolated
trees.
Height
to
the
base
of
the
living
crown
(HBLC)
Since
HBLC
=
H
(1 -
0.01
CR)
eq
(1)
was
used
to
predict
HBLC,
the
weighting
ex-
pression
being
the
product
of
the
previous
one
by
1/H
2.
Height
to
the
first
living
branch
(HFLB)
For
the
same
trees,
we
used
the
same
method
(equation
and
weighting
expres-
sion)
as
for
HBLC.
We
finally
obtained:
WMSE =
85
10-4
;
parameter
estimates
are
given
in
table
II
and
residuals
are
present-
ed
in
figure
3b.
Height
to
the
first
dead
branch
(HFDB)
The
statistical
analysis
was
carried
out
on
96
trees
(pruned
trees
were
removed).
The
previous
form
of
the
model
was
first
tested
but the
best
results
were
obtained
with
a
linear
model
including.
H.AGE,
H/DBH
and
DBH.AGE;
as
previously,
the
weighting
ex-
pression
took
into
account
the
number
of
sample
trees
in
each
stand.
WMSE
=
0.59;
parameter
estimates
are
given
in
table
III
and
residuals
are
present-
ed
in
figure
3c.
Vertical
trend
of
nodal limbsize
Diameter
of
the
thickest
branch
per
tree
Ramicorn
branches
with
a
diameter
>
5
cm
were
removed
and
trees
with
evident
expressions
of
ramicorn,
due
to
frost
and/
or
to
forest
decline
damages
were
not
con-
sidered.
However,
ramicorn
branches
with
a
smaller
diameter
were
taken
into
ac-
count,
since
it
was
difficult
to
recognize
them.
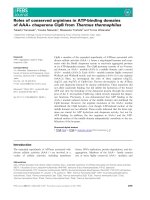
In
order
to
predict
the
maximum
branch
diameter
per
tree
(MAXD)
we
test-
ed
the
following
independent
variables:
DBH,
AGE,
H,
H/DBH.
For
a
total
number
of
trees
of
117,
the
best
individual
predic-
tor
was
DBH
(R
adj
2
=
0.59).
No
additional
independent
variable
could
improve
the
model
so
that
we
finally
obtained:
RMSE
=
0.1412
DBH;
weighting
expres-
sion
=
DBH
-2
;
parameter
estimates
are
given
in
table
IV;
the
model
is
illustrated
in
figure
4).
Vertical
trend
of maximal
branch
diameter
(DBRMAX)
The
construction
of
the
model
predicting
the
maximum
branch
diameter
per
growth
unit
is
explained
in
Colin
and
Houllier
(op
cit):
there
is
no
distinction
between
dead
and
living
branches;
the
independent
vari-
ables
are
the
relative
depth
into
the
crown
(RX),
the
standard
whole-tree
measure-
ments
H,
DBH,
H/DBH
and
the
global
crown
descriptors
HFLB
and
CR
3;
the
model
is
a
segmented
second
order
poly-
nomial
model
with
a
join
point
corre-
sponding
to
the
position
of
the
estimated
thickest
branch;
the
model
was
improved
by
adding
an
intercept
term,
λ:
where
λ,
a,
β,
y
and
are
parameters:
λ > 0 and
The
model
was
fitted
to
90
trees
using
nonlinear
ordinary
least
squares
(RMSE
=
0.48
cm;
parameter
estimates
are
given
in
table
V).
Figure
5
illustrates
the
sensitivity
of
DBRMAX
to
usual
whole-tree
descrip-
tors
by
showing
three
groups
of
simula-
tions
for
various
combinations
of
DBH,
H
and
CR
3.
Vertical
trend
of average
whorl
branch
diameter
(DBRA VE)
Model
[6]
was
adapted
to
predict
the
verti-
cal
trend
of
the
average
whorl
branch
di-
ameter
(DBRAVE).
This
variable
could
be
calculated
for
29
trees.
For
these
trees,
the
model
became:
where
λ’,
a’,
β’,
y’
and
ξ’
are
parameters:
λ’ > 0 and
The
model
was
fitted
to
29
trees
using
nonlinear
ordinary
least
squares
(RMSE =
0.33
cm;
parameter
estimates
are
given
in
table
VI;
a
comparison
with
DBRMAX
model
is
illustrated
in
figure
6).
Insertion
angle
(ANGLE)
For
predicting
the
vertical
trend
of
ANGLE
for
dead
and
living
whorl
branches
along
the
stem,
2
different
independent
variables
were
tested:
the
number
of
the
annual
growth
unit
counted
downward
from
the
top
of
the
stem
(NGU)
and
the
depth
into
the
crown
(X).
Figure
7
illustrates
the
relationship
be-
tween
ANGLE
and
X
for
S1
and
S2
sub-
samples.
Three
groups
of
trees
can
be
seen
in
this
figure:
i)
S1
trees
for
which
AGE >
60
yr:
their
ANGLE
values
appear
to
be
larger
than
the
average
trend;
ii)
S1
trees
for
which
AGE ≤
60
yr
have
interme-
diate
ANGLE
values;
iii)
S2
trees
(AGE
=
34
yr)
exhibit
the
lowest
angles,
as
illustrat-
ed
for
two
individuals.
When
replacing
X
by
NGU
as
the
inde-
pendent
variable,
the
structure
of
the
data
looks
better:
figure
8
illustrates
the
good
superposition
of
the
tree
above-defined
groups
of
trees.
We
therefore
chose
NGU
as
the
predictor
and
fitted
the
following
nonlinear
model:
where
ø1
+
ø2
is
the
maximum
angle
(ie
the
plateau
value).
WMSE =
136.319;
weighting
expression
=
exp
(0.04
NGU);
parameter
estimates
are
given
in
table
VII;
data
and
fitted
curve
are
given
in
figure
8.
However,
when
considering
separately
the
2
subsamples
S1
and
S2,
it
appeared
that
some
differences
remained.
Two
sep-
arate
models,
one
for
each
subsample,
were
therefore
fitted
and
it
turned
out
that
they
were
significantly
different
(table
VIII).
Since
a
detailed
analysis
of
the
variability
would
have
required
more
data
than
avail-
able,
it
was
not
possible
to
elucidate
the
reasons
of this
discrepancy
(ie
site,
genet-
ic
or
silvicultura
effect).
Numbers
of
branches
per
growth
unit
(NTOT,
NW,
N
10
and
N
05
)
Figure
9
shows
the
vertical
trend
of
the
numbers
of
branches
for
two
different
trees
(respectively
38
and
175
years
old).
Four
variables
corresponding
to
different
groups
of
branches
were
studied:
all
branches
(NTOT),
whorl
branches
(NW),
and
the
thickest
branches
(N05
and
N
10).
NW
and
N
10
are
very
similar
and
are
fairly
stable
along
the
stem;
the
mean
values
of
NW
and
N
10
are
clearly
lower
for
the
older
slow-growing-trees;
the
general
trend
of
NTOT
is
not
easy
to
determine,
whereas
N
05
is
clearly
decreasing
downward
the
stem;
there
are
high
frequency
fluctuations
(probably
due
to
annual
climatic
varia-
tions)
around
the
general
vertical
trend.
Some
branch
studies
(Cannell,
1974;
Cannell
and
Bowler,
1978;
Remphrey
and
Powell,
1984;
Maguire
et
al,
1990)
have
shown
that
there
is
a
good
relationship
be-
tween
the
length
of
the
annual
growth
unit
(AGUL)
and
its
number
of
branches
so
that
AGUL
can
be
used
as
an
independent
variable
in
predicting
the
number
of
branches.
In
all
these
studies,
linear
or
nonlinear
regressions
were
carried
out
and
the
distribution
of
the
random
error
was
as-
sumed
to
be
normal.
However,
de
Reffye’s
team
seldom
observed
normal
distributions
when
modelling
growth
and
ramification
by
counting
the
number
of
internodes
(’stem
units’)
and
axillary
buds
occurring
on
annu-
al
growth
units
(de
Reffye
et
al,
1991;
Car-
aglio
et al,
1990).
The
statistical
models
of
branch
numbers
should
therefore
be
based
on
other
probability
distribution
func-
tions.
These
results
are
confirmed
here.
There
is
a
statistical
relationship
between
AGUL
and
the
number
of
branches
and
although
the
stage
of
development
is
not
the
same
for
younger
and
older
trees,
this
relation-
ship
does
not
seem
to
be
influenced
by
tree
age
(fig
10a).
Young
trees
(ie
AGE <
60
yr)
for
which
the
height
growth
is
still lin-
ear
have
longer
growth
units
than
older
slow-growing
trees
(there
are
four
such
trees
in
the
data
set
with
AGE
=
90,
102,
175
and
180
yr)
which
have
nearly
reached
their
maximum
height,
but
the
trend
of
the
relationship
is
the
same.
This
figure
also
shows
that
the
dispersion
of
the
number
of
branches
increases
with
in-
creasing
values
of
AGUL.
Figure
10b
shows
the
frequency
distri-
bution
of
N
10
for
the
annual
growth
units
studied
for
both
old
and
young
trees
(AGE
>
60
yr
vs
AGE
≤
60
yr).
The
average
val-
ues
of
N
10
are
different
because
of
the
dif-
ference
of
the
length
of
the
annual
growth
units,
but
the
distributions
have
a
similar
shape
(they
are
left-skewed).
A
single
model
was
therefore
elaborated,
assuming
that
AGUL
synthetizes
the
effect
of
age
and
climate
on
branch
numbers.
Since
the
dispersion
is
neither
normal
nor
additive
but
multiplicative,
different
generalized
linear
models
were
tested
so
that
we
finally
obtained:
=
a
Ln(AGUL)
+
β γNGU
+
ϵ,
with
distribution
of
ϵ
= normal law
N(0,σ)
[9.1]
or
N =
AGUL
α
exp(β)
exp(γNGU)·ϵ’
with
dis-
tribution
of
ϵ’ =
lognormal
law
LN(0,σ)
[9.2]
Figure
11
illustrates
a
simulation
for
N
10
.
Each
group
of
three
curves
(for
instance
the
curves
in
standard
line)
correspond
to
the
5th,
50th
and
95th
quantiles
and
de-
scribe
the
modelled
dispersion
of
N
10
for
a
given
value
of
NGU.
Two
values
of
NGU
are
proposed:
NGU
= 15
(standard
line)
and
NGU
=
30
(dashed
line).
The
values
of
the
parameters
are
given
in
table
IX,
while
examples
of
average
numbers
for
two
val-
ues
of
AGUL
(0.5
and
1
m)
are
given
in
ta-
ble
X.
The
same
method
was
applied
to
NW,
N
05
and
NTOT.
The
results
are
given
in
tables
IX
and
X.
Whorl
branch
location
The
distance
from
upper
scale
scars
to
the
first
whorl
branch
was
never
great:
maxi-
mum
value
was
approximately
10
cm.
The
distribution of
the
relative
length
of
the
part
of
the
stem
supporting
whorl
branches
(single
or
double
whorl
in
case
of
lammas
shoots)
is
illustrated
in
figure
12.
The
main
characteristics
of
these
distributions
are
provided
in
table
XI.
DISCUSSION
Methodological
aspects
Dynamic
vs
static
points
of
view
As
already
stated
our
approach
does
not
directly
address
the
dynamic
processes
which
determine
the
relationships
between
stem,
crown
and
branch
characteristics.
Our
models
must
be
considered
as
static
allometric
models
that
enable
the
predic-
tion
of
branchiness
from
usual
stem
meas-
urements.
However,
we
checked
that
these
models
are
dynamically
compatible.
As
an
example,
we
used
data
provided
by
yield
tables
(Décourt,
1972)
for
predicting
branch
diameter
at
different
ages
along
the
(fig
13)
of
the
mean
dominant
tree.
These
simulations
show;
1)
that
superposi-
tion
of
the
curves
is
consistent
with
growth
processes
(ie
the
curves
do
not
cross
each
other
and
are
nearly
the
same
for
the
lower
part
of
the
stem
where
dead
and
de-
clining
branches
are
located);
and
2)
that
the
maximum
branch
diameter
increases
when
trees
get
older.
A
comparison
with
tree
architecture
studies
leads
to
the
same
kind
or
remark.
For
example,
the
aim
of
Caraglio
et
al
(op
cit)
or
de
Reffye
et
al
(op
cit)
is
to
stimulate
tree
architecture
by
using
botanical
and
statistical
knowledge
on
the
dynamic
beha-
viour
of
apical
meristems.
The
aim
of
the
present
study
was
quite
different,
since
the
current
number
of
branches
at
a
point
of
time
and
at
a
level
in
the
tree
had
to
be
as-
sessed
from
usual
whole-tree
descriptors
and
average
relationships
(including
the
usual
height-over-age
growth
curves).
Therefore,
whereas
other
authors
would
consider
that
the
length
of
the
annual
growth
unit
is
functionally
determined
by
the
number
of
internodes
or
axillary
buds
(eg
Kremer
et
al,
1990,
or
Guyon,
1986
for
pines)
we
predicted
the
numbers
of
branches
by
using
AGUL
as
the
main
inde-
pendent
variable.
Another
important
point
concerns
the
distinction
between
living
and
dead
branches.
Our
models
provide
a
descrip-
tion
of
the
different
zones
in
the
crown
but
they
do
not
provide
any
information
about
the
status
of
a
particular
branch.
Variability
Since
the
final
objective
of
the
study
is
to
predict
crown
and
branchiness
characteris-
tics
from
forest
inventory
data
at
a
regional
scale,
we
had
to
deal
with
several
levels
of
variability:
between-stands
(including
age,
site,
silvicultural
and
genetic
effects),
with-
in-stands
(including
genetic
and
tree-to-
tree
competition
effects)
and
within-tree
variability
(including
age,
climatic
and
vary-
ing-over-time
tree-to-tree
competition
ef-
fects).
Our
results
will
therefore
be
com-
pared
to
four
groups
of
studies:
within-tree,
within-stand,
between-stands
and
exten-
sive
forest
inventory
surveys.
Sampling
design
and
statistical
models
Most
statistical
difficulties
that
appear
in
this
study
are
due
to
the
fact
that
our
sampling
design
could
not
be
used
to
mod-
el
the
effects
of
all
the
factors
that
deter-
mine
branchiness
and
in
particular
to
ex-
plore
in
detail
the
different
levels
of
variability
that
have
been
listed.
As
an
ex-
ample,
let
us
consider
the
case
of
branch
insertion
angle.
Since
only
one
branch
was
sampled
in
each
whorl
(it
was
subjectively
chosen
as
being
’representative’
of
the
oth-
er
branches
in
the
whorl)
and
since
eq
[8]
is
a
global
model
adjusted
on
all
sample
trees,
within-whorl
variability,
between-
growth
unit
variability
and
between-tree
variability
cannot
be
clearly
distinguished
in
figures
7
and
8.
Our
sampling
design
has
two
draw-
backs.
First,
the
choice
of
a
sample
repre-
sentative
of
the
resource
for
a
fixed
size-
range
(except
for
subsample
S2)
leads
i)
to
a
design
that
is
not
balanced
according
to
stand
characteristics
(eg
only
few
old
stands
were
sampled);
and
ii)
to
equations
that
cannot
be
extrapolated
to
the
whole
life
of
a
stand
or
a
tree
(eg
the
effect
of
age
on
crown
recession
is
not
precisely
described
for
early
stages
so
that
eq
[1-4]
cannot
be
extrapolated
to
young
ages).
Second,
the
number
of
trees
varies
from
1-18
per
stand,
so
that
weighting
func-
tions
had
to
be
modified
in
order
to
give
the
same
weight
to
the
different
stands.
There
are
at
least
two
possibilities
for
improving
the
description
of
the
variability.
Firstly,
a
better
statistical
approach
in
the
context
of
such
a
sampling
design
would
be
to
use
random-effect
linear
or
nonlinear
models
(ie
the
model
parameters
are
as-
sumed
to
be
randomly
distributed
among
a
tree
or
stand
population;
see
Lappi,
1991,
for
an
application
in
another
domain);
this
was
not
carried
out
because
our
main
goal
was
to
model
the
global
trends
and
rela-
tionships
and
because
fitting
such
models
requires
specialized
software
that
is
rarely
available.
Secondly,
it
is
possible
to
initiate
specific
studies
in
order
to
obtain
more
precise
information
about
the
effect
of
the
different
factors;
such
studies
are
presently
being
carried
out
for
genetic
and
silvicultu-
ral
(ie
stand
density
and
social
status)
as-
pects.
Different
parts
of
the
crown
The
comparison
to
other
studies
is
possi-
ble
for
the
height
to
the
first
dead
branch
and
the
height
to
the
first
live
branch
whose
definitions
are
always
the
same,
whereas
care
must
be
taken
when
analyz-
ing
crown
ratio
and
height
to
live
crown
since
in
most
cases
their
definition
are
somewhat
different
from
ours.
Within-stand
studies
Burger
(1936,
1939a,b)
found
a
high
corre-
lation
between
DBH
and
the
different
heights
of
crown
within
a
stand.
The
situa-
tion
changes
according
to
the
stage
of
de-
velopment
of
the
stand.
For
young
stands
(ie
before
40
yr),
where
competition
is
high,
HBLC
is
lower
for
suppressed
and
overtopped
trees
than
for
the
others.
When
the
stands
get
older,
HBLC
becomes
near-
ly
the
same
for
all
trees.
This
fact
was
con-
firmed
by
Delvaux
(1979).
Studying
the
slow
self-pruning
process
for
Picea
abies,
Köster
(1934)
observed
that
a
branch-free
part
began
to
appear
on
the
trunk
when
trees
were
about
85
yr
old;
when
trees
were
105
yr
old
the
length
of
this
part
was
only
1.5
m.
Therefore,
HFDB
depends
on
tree
age
after
at
least
80
years.
Between-stand
studies
For
Picea
abies
even-aged
stands
where
the
same
forest
management
had been
applied,
Kramer
(1962)
established
a
close
relationship
between
the
average
total
height
and
the
average
height
to
the
live
crown
base.
By
using
this
relationship
and
the
mean
height
growth
curve
correspond-
ing
to
a
given
site
index,
he
could
picture
that
the
trends
of
HBLC
and
CR
according
to
AGE:
CR
approximately
followed
an
ex-
ponentially
decreasing
function.
Eversole
(1955),
Curtis
and
Reukema
(1970),
Kram-
er
and
Smith
(1985;
in
Kramer,
1988)
dem-
onstrated
the
effect of
initial
density
on
HBLC
and
CR
for
trees
of
the
same
age.
The
latter
authors
further
showed
that
this
effect
may
actually
be
predicted
from
the
size
of
the
trees,
ie
two
trees
with
the
same
DBH,
one
suppressed
in
a
first
stand
(low
density),
the
other
dominant
in
a
sec-
ond
stand
(high
density),
have
about
the
same
HBLC
and
CR.
Consequently,
for
a
given
age,
tree
size
measurements
are
pertinent
independent
variables
for
predict-
ing
crown
characteristics.
Forest
inventory
studies
The
main
studies
that
we
refer
to
concern
Lithuanian
and
Finnish
Norway
spruce
re-
sources
(Arlauskas
and
Tyabera,
1986;
Hakkila
et
al,
1971,
Hakkila
et
al,
1972).
The
number
as
well
as
the
main
character-
istics
of
the
sampled
trees
are
not
the
same:
2 306
trees
in
Lithuania
(DBH
range:
7-35
cm;
AGE
range:
60-120
yr),
and
1
864
trees
in
northern
and
southern
Finland
(DBH
range:
5-35
cm,
average
AGE
=
105
yr
with
AGE
standard
error
=
55
yr).
Finnish
spruce
had
a
crown
ratio
of
ap-
proximately
75-80%,
with
nearly
no
differ-
ence
between
north
and
south.
Such
CR
values
seem
to
correspond
to
widely
spaced
trees,
but
they
may
also
be
due
to
an
effect
of
the
high
latitude
(Kuuluvainen
and
Pukkala,
1991).
The
following
correla-
tions
were
found:
r
=
-0.38
with
H/DBH,
0.29
with
DBH,
0.10
with
AGE
and
0.06
with
H.
Lithuanian
trees
were
more
con-
strasted,
with
a
CR
ranging
from
55
H-
80%.
In
this
case,
CR
was
related
to
the
independent
variables
DBH,
AGE,
AGE
2,
DBH.AGE,
DBH.AGE
2,
but
no
information
was
given
about
residual
standard
error
or
coefficient
of
determination,
and
height
measurements
had
not
been
carried
out.
Concerning
height
to
the
base
of
live
crown
and
height
to
the
first
live
branch,
Hakkila
et
al
(op
cit)
established
that
the
height
to
the
base
of
green
branches
in-
creases
when
DBH
and
total
height
in-
crease
but
that
it
becomes
nearly
constant
with
a
maximum
value
of
about
4-5
m
(ie
when
DBH
increases
from
20-35
cm,
HFLB
varies
from
3.5
m
to
4.5
m).
This
value
is
smaller
than
our
values,
but
this
might
be
due
to
the
fact
that
the
trees
are
smaller.
For
Arlauskas
and
Tyabera
(op
cit),
the
independent
variables
were
again
AGE,
AGE
2,
DBH.AGE,
DBH.AGE
2.
The
height
to
the
base
of
the
green
branches
ranged
from
7-11
m.
In
Lithuania,
the
height
to
the
first
dead
branch
ranged
from
2-5
m.
The
authors
emphasized
that
natural
pruning
was
less
intensive
than
branch
death,
and
noticed
that
natural
pruning
did
not
seem
to
be
in-
fluenced
by
site
conditions
(soil
and
cli-
mate).
In
Finland,
Hakkila
et
al
(op
cit)
no-
ticed
a
value
of
approximately
1
m
for
HFDB.
These
data
and
our
results
confirm
the
fact
that
natural
pruning
is
not
efficient
for
Norway
spruce.
Our
non-pruned
trees
have
almost
all
their
dead
branches
(most
of
them
are
younger
than
the
Finnish
and
Lithuanian
sample
trees).
The
models
Although
the
list
of
the
best
predictors
that
we
found
is
somewhat
different
from
those
provided
by
the
above-mentioned
authors,
it
must
be
stated
that
this
list
is
strongly
in-
fluenced
by
the
sampling
design
and
that
crown
development
and
recession
are
controlled
by
several
factors
that
are
not
directly
assessed
through
global
tree
char-
acteristics.
For
instance,
Hakkila
(op
cit)
considered
that
variations
in
CR
are
caused
fundamentally
by
genetic
factors
and
stand
density
in
the
different
ages
of
tree.
It
can
therefore
be
explained
only
fair-
ly
inadequately
by
means
of
the
tree
char-
acteristics.
Some
specific
site
conditions
(eg
slope, exposition,
elevation)
may
also
play a
role
in
crown
dynamics.
Our
results
are
therefore
consistent
with
previous
studies
and
confirm
that
crown
re-
cession
is
an
age-dependent
phenomenon
that
is
regulated
by
stand
density
and
by
individual
tree
social
status.
More
precisely
it
depends
on:
i)
the
stage
of
development
of
the
tree
which
is
indirectly
measured
by
age,
total
height
and
DBH
and
which
is
af-
fected
by
site
conditions;
ii)
the
past
and
current
density
of
the
stand
(Delvaux,
op
cit,
Bryndum,
1974);
iii)
the
social
status
of
the
tree
within
the
stand
(Delvaux,
op
cit).
Equations
[1-3]
provide
a
means
for
in-
tegrating
these
factors:
the
effect
of
age
is
modelled
by
an
exponentially
decreasing
function
that
is
consistent
with
Kramer’s
observations
(1962);
the
term
with
H/DBH
is
a
correction
to
the
general
age-trend
that
accounts
for
both
the
current
social
status
of
the
tree
and
the
past
density
of
the
surrounding
stand;
H2
term
accounts
for
a
size
effect
whose
interpretation
is
less
clear.
The
structure
of
our
model
is
also
fairly
similar
to
that
of
Dyer
and
Bur-
kardt
(1987)
for
Pinus
taeda.
Since
crown
importance
and
location
determine
both
annual
increment
of
wood
along
the
stem
and
the
status
of
the
knots
(intergrown
or
encased
knot),
it
is
interest-
ing
to
determine
whether
the
dynamics
of
crown
recession
can
be
investigated
with
our
data.
Figure
1
illustrates
that
our
sam-
pling
design
is
not
suitable
for
exploring
this
question.
In
fact,
a
complementary
sampling
should
be
achieved,
including
trees
of
various
ages
(especially
young
and
old
trees)
whithin
stands
of
various
densities.
Branch
diameters
Thickest
branch
in
a
tree
Hakkila
(op
cit)
sampled
245
trees
coming
from
49
stands
located
in
all
parts
in
Fin-
land.
He
noticed
that
the
greater
part
of
the
variation
(of
branch
size
distribution)
is
as-
sociated
with
characteristics
that
illustrate
the
tree
size.
After
testing
various
vari-
ables
(ie
AGE,
H,
DBH,
stem
volume,
dry
weight,
CR,
H/DBH,
branch
class)
he
built
a
model
for
predicting
the
diameter
of
the
thickest
branch:
MAXD
(mm)
=
15.9
+
0.978
DBH-
7.45
H/
DBH (R = 0.81;
RMSE= 3.8 mm).
Hakkila’s
equation
is
similar
to
eq
[5]
ex-
cept
that
H/DBH
was
not
found
to
be
sig-
nificant
in
our
sample.
For
Scots
pine
at
pole
stage
(DBH
range:
3-17
cm),
Kel-
lomäki
and
Väisänen
(1986)
also
found
a
good
relationship
between
diameter
of
the
thickest
branch
and
DBH.
These
results
confirm
that
tree
size
(ie
DBH)
is
the
most
efficient
predictor
of
MAXD
and
that
stand
density
and
social
status
of
the
tree
(as
synthesized
by
H/
DBH)
play
some
additional
role
in
predict-
ing.
Vertical
trend
of
branch
diameter
Few
vertical
profiles
of
branch
diameter
have
appeared
in
the
literature.
Schöpf
(1954)
on
Pinus
sylvestris
between
18
and
64
yr
compared
crown
structure,
internal
structure
of
the
stem
and
vertical
trend
of
branch
diameter.
He
observed
i)
that
branch
diameter
increases
from
the
top
of
the
tree
to
a
point
that
is
near
to
the
level
of
maximum
lateral
extension
of
the
crown;
and
ii)
that
it
then
decreases
towards
the
base
of
the
tree.
The
size
of
the
branches
is
therefore
linked
to
crown
shape
and
to
tree
size
(DBH).
Uusvaara
(1985,
1991)
noticed
the
same
vertical
trends
in
Pinus
sylvestris
in
Finland.
Maguire
et
al
(op
cit)
modelled
this
trend
in
young
Pseudotsuga
menziesii;
since
the
seedlings
had
a
CR
of
nearly
100%,
their
model
concerned
the
upper
part
of
the
curve
(ie
from
the
top
to
the
level
of
maximum
lateral
extension).
The
situation
was
similar
in
Abetz’s
study
(1970)
on
Pinus
sylvestris
in
Germany.
The
decreasing
part
of
the
vertical
trend
has
been
investigated
in
particular
by
Bernhart
(1960),
Merkel
(1967)
and
Kram-
er
et
al
(1971)
on
Picea
abies
and
Dietrich
(1973)
on
Abies
alba.
Merkel
demonstrat-
ed
the
effect
of
stand
density
which
chang-
es
with
time.
Due
to
successive
silvicultu-
ral
practices
the
remaining
trees,
ie
dominant
and
codominant
trees,
get
more
and
more
growth
space.
Kramer
(1962)
showed
that
the
lifespan
of
the
branches
becomes
longer
when
the
tree
gets
older
so
that
the
maximum
branch
diameter
also
increases.
The
model
introduced
by
Colin
and
Houllier
(op
cit)
was
slightly
improved
and
extended
to
average
branch
diameter.
This
model
is
consistent
with
the
above-cited
result:
the
vertical
trend
is
modelled
ac-
cording
to
the
distance
to
the
top
of
the
tree
with
additional
terms
that
are
related
to
tree
size
(ie
H,
DBH),
to
crown
descrip-
tors
(ie
CR
3,
HFLB)
and
to
tree
social
stat-
us
(ie
H/DBH,
CR
3)
(for
other
comments
on
this
aspect,
see
Colin
and
Houllier,
op
cit).
Insertion
angle
of
branches
Figures
7
and
8
show
that
there
is
a
global
effect of
tree
height
growth
rate
on
the
in-
sertion
angle
of
the
branches.
For
the
same
total
height,
trees
that
grow
quickly
have
less
growth
units
and
the
insertion
angles
are
statistically
lower
(ie
angles
are
more
acute).
Possible
reasons
for
this
re-
sult
might
be
the
following:
firstly,
for
the
same
initial
stand
density
fast-growing
trees
face
a
more
intensive
competition
when
they
are
young:
this
might
lead
to
acute
an-
gles
because
branches
are
oriented
toward
upper
light
(Jarret,
1978;
for
Pseudotsuga
menziesii):
we
could
neither
reject
nor
vali-
date
this
hypothesis
because
information
about
past
stand
density
was
lacking
for
most
stands.
Secondly,
since
all
sample
trees
are
about
the
same
size,
older
trees
are
those
which
come
from
poorer
sites
that
are
often
located
at
a
high
elevation:
these
trees
are
therefore
submitted
to
heavy
weights
of
snow
and
intercepted
rainfalls
during
most
of
the
year.
From
our
results
it
therefore
appears
that
for
mid-size
spruces
the
merchantable
part
of
the
stem
(ie
from
tree
bottom
to
70%
of
total
height
or
between
30-100%
of
relative
depth
into
crown)
supports
whorl
branches
with
angles
ranging
ap-
proximately
from
70°
(for
fast-growing
trees
and/or
for
trees
from
stands
where
initial
density
was
high)
to
100°
(for
slow-
growing
trees
and/or
for
trees
which
grew
in
conditions
where
the
loads
on
branches
are
high).
Due
to
knot
inclination
inside
the
bole,
the
volume
of
wood
disturbed
by
knots
is
greater
in
the
first
case.
This
global
result
has
to
be
shaded
ac-
cording
to
the
genetic
origin
of
the
trees.
For
instance,
the
fact
that
S2
trees -
which
all
come
from
the
same
stand
and
hence
from
the
same
provenance -
have
more
acute
insertion
angles
might
be
due
to
their
genetic
origin.
Comparative
studies
of
different
provenances
and
descendances
are
under
way
in
order
to
confirm
the
mag-
nitude
of
genetic
effects
on
the
parameters
of
our
model.
Similarly
the
occurrence
of
ramicorn
branches -
which
were
not
stud-
ied
here -
is
partially
dependent
on
the
ge-
netic
origin;
it
also
depends
on
site
condi-
tions
and
tree
age,
and
we
indeed
observed
that
trees
growing
at
a
high
ele-
vation
in
Vosges
mountains
often
have
ramicorn
branches.
The
frequency
of
this
phenomenon
should
be
more
intensively
studied
in
the
future.
However,
since
genetic
origin
is
un-
known
when
using
National
Forest
Survey
data,
it
is
not
possible
to
take
this
aspect
into
account
when
extrapolating
our
mod-
els
(except
by
stochastic
simulation).
Number
of
branches
Compared
to
other
studies,
the
proposed
models
present
an
improvement
concern-
ing
the
statistical
description
of
the
variabil-
ity
(random
errors
were
not
assumed
to
be
normal).
Nevertheless,
the
general
trends
that
were
fitted
are
similar
to
those
mod-
elled
by
Maguire
et
al
(op
cit),
by
Cannell
(op
cit)
and
by
Remphrey
and
Powell
(op
cit).
It
appears
that
the
number
of
branch-
es
per
annual
growth
unit
increases
when
the
length
of
the
growth
unit
increases,
but
that
the
slope
of
this
trend
decreases
pro-
gressively
from
the
top
to
the
bottom
of
the
stem
(fig
11).
The
analysis
of
annual
climatic
effect
was
not
within
the
scope
of
this
study.
The
previous
year’s
climate
influences
the
num-
ber
of
stem
units
of
the
annual
shoot
as
well
as
its
length
(Cannell
and
Bowler,
op
cit;
Kremer
et
al,
op
cit;
Guyon,
op
cit)
and
hence
the
number
of
axillary
buds
and
po-
tential
branches;
the
climate
of
the
follow-
ing
spring
then
influences
organogenesis
(Powell,
1982);
so
that
the
final
number
of
branches
presents
a
strong
variability
even
if
the
length
of
the
annual
growth
unit
has
been
taken
into
account.
On
figure
9
we
observe
a
decreasing
trend
for
N
05
.
This
is
probably
due
to
the
fact
that
internodal
branches
have
a
short
lifespan
and
fall
after
a
certain
time.
On
the
other
hand,
the
branches
with
a
diameter
<
0.5
cm
include
branches
developed
from
’proventive’
buds
(Edelin,
1977);
this
phe-
nomenon
leads
to
a
regular
replacement
of
very
small
branches
that
have
a
very
short
lifespan
and
provides
an
explanation
for
the
stability
of
NTOT and
for
the
introduction
of
NGU when
modelling
N
05
.
This
aspect
must
be
further
investigated
in
future
studies,
but
this
will
require
dynamic
analysis
(ie
repeat-
ed
observation
of
the
same
trees).
Concerning
site
effects,
the
role of
growth
conditions
is
important
since the
length
of
the
annual
shoot
has
a
strong
in-
fluence
on
the
number
of
branches.
Cannell
(op
cit)
observed
slightly
differ-
ent
numbers
of
lateral
buds
per
leader
length
unit
between
the
different
prove-
nances
which
he
investigated.
This
might
be
due
to
inherent
differences
in
branch-
needle
numbers
ratio
(Cannell
and
Bowler,
op
cit).
At
this
stage
of
branchiness
knowl-
edge,
and
before
extending
current
results
to
the
whole
resource
in
a
given
region
it
is
therefore
essential
to
compare
the
main
provenances
that
are
used
in
this
region
and
to
check
whether
there
is
an
effect
on
the
parameters
of
our
models.
On
the
other
hand,
Pollard
and
Logan
(1979)
observed
that
the
primordium
initia-
tion
is
variable
when
conditions
of
sunlight
exposure
are
contrasted:
for
instance,
a
re-
duction
of
light
intensity
from
20 000
to
3
400
lux
leads
to
a
reduction
of
primordi-
um
initiation
of
40-46%
depending
on
provenances.
Hence,
silviculture
might
have
some
influence
on
branch
numbers:
low stand
density
and
regular
thinnings
could
lead
to
an
increase
of
the
number
of
branches
per
annual
shoot
length
unit.
Whorl
branch
location
and
diameter
distribution
inside
the
whorl
The
location
of
whorl
branches
is
deter-
mined
overall
by
upper
scale
scars
posi-
tion.
Knowing
the
height
growth
curve
al-
lows
a
rough
prediction
of
whorl
position.
In
fact,
whorl
branches
are
attached
to
the
stem
in
an
area
that
represents
about
20%
of
annual
shoot
length.
Similarly,
Maguire
et
al
(op
cit)
observed
that
approximately
24%
of
the
total
number
of
branches
(likely
whorl
branches)
on
young
Douglas
fir
trees
are
located
in
the
first
percentage
of
the
relative
depth
in
an
annual
shoot.
Our
distribution
seems
to
be
slightly
more
spaced,
especially
for
S2
trees.
Extrapolation
to
other
species
Our
approach
may
be
extrapolated
to
oth-
er
regions
for
the
same
species
by
extend-
ing
our
samples
and
calibrating
our
mod-
els.
It
is
also
likely
that
it
may
be
adapted
to
other
coniferous
species
such
as
Doug-
las
fir,
Sitka
spruce,
larches
and
pines
with
relatively
strong
apical
control;
and
more
broadly,
to
tree
species having
close
archi-
tectural
models
(according
to
the
definition
of
Hallé
and
Oldeman,
1970).
CONCLUSION
We
emphasize:
i)
that
our
purpose
was
not
to
look
for
functional
relationships:
in
the
context
of
this
study
this
would
have
been
hopeless,
since
annual
stem
and
crown
development
are
dynamically
linked
so
that
their
present
status
is
only
the
visible
result
of
the
accumulation
of
annual
pro-
cesses;
ii)
that
this
study
constitutes
an
ex-
ploratory
statistical
analysis,
that
adresses
the
following
question:
can
usual
tree
measurements
be
used
as
predictors
of
branchiness
characteristics?;
iii)
that
the
model
equations
are
temporary,
since
pre-
diction
could
change
slightly
if
more
trees
were
sampled
and
especially
if
the
range
of
sampled
trees
were
extended
to
small-
er,
larger,
younger
or
older
trees.