Báo cáo y học: "High CXCR3 expression in synovial mast cells associated with CXCL9 and CXCL10 expression in inflammatory synovial tissues of patients with rheumatoid arthritis" potx
Bạn đang xem bản rút gọn của tài liệu. Xem và tải ngay bản đầy đủ của tài liệu tại đây (1.15 MB, 12 trang )
Introduction
Rheumatoid arthritis (RA) is a chronic disease of joints
that is characterized by three main manifestations, namely
inflammation, abnormal cellular and humoral immuno-
response, and synovial hyperplasia. Eventually the inter-
play between these pathologic processes leads to
complete joint destruction [1].
A hallmark of RA is infiltration of leukocytes into synovial
tissue, mediated by a complex network of cytokines, adhe-
sion molecules and chemoattractants [2–6]. The presence
of activated leukocytes contributes to persistence of
destructive synovitis [6,7]. Nevertheless, leukocyte recruit-
ment to the joint is not yet fully understood. The presence
of specific functional and inflammatory T-cell subsets that
CXCL = Cys–X–Cys ligand; CXCR = Cys–X–Cys receptor; G3PDH = glyceraldehyde-3-phosphate dehydrogenase; IFN = interferon; IL = inter-
leukin; MC = mast cell; OA = osteoarthritis; PBS = phosphate buffered saline; PCR = polymerase chain reaction; RA = rheumatoid arthritis; RT =
reverse transcription; TCR = T-cell receptor; Th = T-helper (cell).
Available online />Research article
High CXCR3 expression in synovial mast cells associated with
CXCL9 and CXCL10 expression in inflammatory synovial tissues
of patients with rheumatoid arthritis
Peter Ruschpler
1
, Peter Lorenz
2
, Wolfram Eichler
3
, Dirk Koczan
2
, Claudia Hänel
1
, Roger Scholz
4
,
Christian Melzer
5
, Hans-Jürgen Thiesen
2
and Peter Stiehl
1
1
Institute of Pathology, University of Leipzig, Leipzig, Germany
2
Institute of Immunology, University of Rostock, Rostock, Germany
3
Eye Hospital, University of Leipzig, Leipzig, Germany
4
Department of Orthopedic Surgery, University of Leipzig, Leipzig, Germany
5
Specialty Hospital of Orthopedic and Trauma Surgery, ‘Waldkrankenhaus’, Bad Düben, Germany
Correspondence: Peter Ruschpler (e-mail: )
Received: 11 Nov 2002 Revisions requested: 8 Jan 2003 Revisions received: 6 May 2003 Accepted: 14 May 2003 Published: 26 Jun 2003
Arthritis Res Ther 2003, 5:R241-R252 (DOI 10.1186/ar783)
© 2003 Ruschpler et al., licensee BioMed Central Ltd (Print ISSN 1478-6354; Online ISSN 1478-6362). This is an Open Access article: verbatim
copying and redistribution of this article are permitted in all media for any purpose, provided this notice is preserved along with the article's original
URL.
Abstract
To improve our knowledge on the pathophysiology of
rheumatoid arthritis (RA), we investigated gene expression
patterns in synovial tissue from RA and osteoarthritis (OA)
patients. DNA oligonucleotide microarray analysis was
employed to identify differentially expressed genes in synovial
tissue from pathologically classified tissue samples from RA
(n = 20) and OA patients (n = 10). From 7131 gene sets
displayed on the microarray chip, 101 genes were found to be
upregulated and 300 genes to be downregulated in RA as
compared with OA. Semiquantitative reverse-transcription
polymerase chain reaction, Western blotting and
immunohistochemistry were used to validate microarray
expression levels. These experiments revealed that Cys–X–Cys
receptor (CXCR)1, CXCR2 and CXCR3 mRNAs, as well as
Cys–X–Cys ligand (CXCL)9 (monokine induced by IFN-γ) and
CXCL10 (IFN-γ inducible protein 10) mRNAs, were significantly
upregulated in RA as compared with OA disease. Elevated
protein levels in RA synovial tissue were detected for CXCR1
and CXCR3 by Western blotting. Using immunohistochemistry,
CXCR3 protein was found to be preferentially expressed on
mast cells within synovial tissue from RA patients. These
findings suggest that substantial expression of CXCR3 protein
on mast cells within synovial tissue from RA patients plays a
significant role in the pathophysiology of RA, accompanied by
elevated levels of the chemokines CXCL9 and CXCL10. Mature
mast cells are likely to contribute to and sustain the inflamed
state in arthritic lesions (e.g. by production of inflammatory
mediators such as histamine, proteinases, arachidonic acid
metabolites and cytokines). Thus, the mast cell could become a
potential target in therapeutic intervention.
Keywords: chemokines, CXCR3, inflammation, mast cells, rheumatoid arthritis, synovial tissue
Open Access
R241
R242
Arthritis Research & Therapy Vol 5 No 5 Ruschpler et al.
express a characteristic pattern of cell surface markers,
such as T-cell receptor (TCR), T-cell associated proteins
as well as adhesion molecules [8], are of particular signifi-
cance. Other cell types that are involved in disease mani-
festation in the synovial tissue include macrophages and
neutrophilic granulocytes, as well as tissue mast cells
(MCs) [9,10].
Migration of T cells to sites of inflammation is mediated by
selectins and their ligands [11,12]. Regulation of leuko-
cyte migration is orchestrated by activating cytokines and
adhesion molecules. Furthermore, recruitment of leuko-
cytes to sites of inflammation is driven and mediated by
the effects of chemoattractants [13,14]. These molecules,
termed inducible chemokines, are members of the large
superfamily of IFN-γ inducible small cytokines (8–10 kDa),
which can be divided into four groups (CXC, CX
3
C, CC,
and C), according to a conserved structural motif of the
first two closely paired cysteines within their amino acid
sequence [4,6]. Two major families of chemokines have
been reported: CC chemokines, which contain the first
two of four conserved cysteines in adjacent positions; and
CXC chemokines, with a single amino acid separating the
first two cysteines. Cys–X–Cys ligand (CXCL)9 and
CXCL10 are members of the small cytokine
(intercrine/chemokine) CXC subfamily and represent the
specific ligands of the Cys–X–Cys receptor (CXCR)3
[6,15,16]. It has been shown that Th1 and Th2 cells
respond differently to several chemokines and express dif-
ferent chemokine receptors [17]. Production of
chemokines such as CXCL9 (monokine induced by IFN-γ)
and CXCL10 (IFN-γ inducible protein 10) is dependent on
release of IFN-γ, corresponding to a Th1 shifted ST com-
partment in RA disease [18,19].
Receptors of IFN-γ inducible chemokines are members of
the seven-transmembrane-spanning, G-protein-coupled
receptor family, and are thought to mediate inflammatory
effects of chemoattractants within RA synovial tissue
[6,20]. Chemokines and their receptors are molecules that
may manage selective migration of particular T-cell
subsets. Lymphocytes that shift to IFN-γ producing Th1
effector cells express chemokine receptors such as CCR5
and CXCR3 [12,18,21]. High CXCR3 expression was
originally shown to be restricted to activated T lympho-
cytes [5,22,23] and could be observed in resting T lym-
phocytes, B lymphocytes, monocytes or granulocytes
[20,24]. In contrast, Th2 lymphocytes were reported to
produce CCR3, CCR4, and CCR8 [5,12,13,18,25].
However, in other investigations additional expression of
CXCR3 was detected in endothelial cells and dendritic
cells, as well as in eosinophils within Th1 dominated
tissues, including RA synovial tissue [19,26,27]. Thus,
CXCR3 expression does not appear to be restricted to
activated T lymphocytes, and chemokines may attract
more than just T lymphocytes.
Differential expression of CXC chemokines and their
receptors has been associated with numerous disease
stages [28,29]. In a recent study it was demonstrated that
increasing levels of CXCL8 (IL-8) are responsible for acti-
vation of neutrophils and T lymphocytes that migrate into
the epidermis of arthritis patients. CXCL8 was shown to
induce the expression of HLA-DR and to be chemotactic
and mitogenic for keratinocytes [30,31]. Another group
demonstrated that mRNA levels of the CXCL8 receptors
CXCR1 and CXCR2 were 10-fold elevated in injured pso-
riatic epidermis as compared with normal skin, suggesting
a role for high expression of CXCL8 receptors in epider-
mal hyperplasia, leukocyte infiltration, and increased
HLA-DR expression in psoriasis [7,32]. Moreover, it has
been shown that increased synthesis of CXCL8 is linked
to particular signs and symptoms of RA [33,34].
Chemokines and their receptors probably play important
roles in directing the migration of immunocompetent
cells to sites of inflammation and in determining the
pathohistologic outcome of chronic inflammation and
synovial hyperplasia [4,6]. Th1 cytokines such as IFN-γ
induced chemokines (e.g. CXCL9 and CXCL10, as well
as their receptor CXCR3) are thought to contribute to
the documented morphologic and clinical features of RA
[35,36].
In the present study, DNA oligonucleotide microarray
analysis was performed to search for differentially
expressed genes that might represent diagnostic as well
as therapeutic markers for pathogenesis and treatment
of RA. Transcriptome data, together with our recent
observations, that indicated a shift in the Th1/Th2
balance within synovial tissue of RA patients [37]
prompted us to validate expression and distribution of
selected chemokine receptors, mainly CXCR3, in RA
versus osteoarthritis (OA) synovial tissue. Significantly
increased levels of CXCR1, CXCR2, and CXCR3
mRNA, as well as highly abundant CXCR1 and CXCR3
protein levels, were found in synovial tissue from RA as
compared with that from OA patients. Concomitantly,
significantly increased mRNA levels of CXCL9 and
CXCL10 were also detected in RA synovial tissue. Our
immunohistochemical analysis demonstrated high
expression of CXCR3 protein on tissue MCs within
rheumatoid synovial tissue samples.
Materials and methods
Patients
Synovial membranes from patients with RA (n = 20) and
OA (n = 10) were obtained by synovectomy at the Depart-
ment of Orthopaedic Surgery, University of Leipzig,
Germany. All samples were collected with the approval of
the Ethics Board of the University of Leipzig. Clinical, bio-
logic and demographic characteristics of the patients are
summarized in Table 1.
R243
All RA patients had chronic disease of at least 5 years’
duration and met the American College of Rheumatology
1987 classification criteria [38]. All had active disease
with typical properties (i.e. increased number of infiltrating
immunocompetent cells, characteristic number and size of
lymphatic follicles, proliferating fibroblasts, and extension
of fibrin exudation) [39]. All patients were receiving treat-
ment that included disease-modifying antirheumatic
and/or nonsteroidal anti-inflammatory drugs, as well as
steroids (Table 1). Diagnosis of OA was based on clinical
and radiologic examination, typical symptoms and sero-
logic differences from RA.
All biopsies from RA and OA patients were histopathologi-
cally assessed to confirm the clinical diagnosis and to
ensure typical pathologic characteristics of RA and OA.
Infiltration of T as well as B cells and their organization into
lymphatic aggregates and follicular structures were the
commonest histopathologic characteristics of synovial
tissue from RA patients. In contrast, only a small number
of lymphocytes, sometimes with single plasma cells and
very small lymphocytic aggregates, lack of fibrin exudation
and indications for detritus synovialitis, as well as a mild or
higher degree of fibrosis, were the histopathologic hall-
marks of synovial tissue from patients with OA. Histologic
assessment of RA and OA synovial membranes was con-
ducted by one of the investigators (PS), who has diag-
nosed more than 2500 synovial tissue samples of RA.
DNA microarray analysis
A global expression analysis of synovial tissue from
patients suffering from RA and OA was performed using
Affymetrix GeneChip technology (Affymetrix Inc., Santa
Clara, CA, USA). Patient material was chosen on the basis
of similar patient and disease characteristics. Standard-
ized amounts of total RNA from cryoconserved synovial
Available online />Table 1
Demographic and clinical data for the 20 representative patients included in the study
Patient Age Duration of
number (years) F/M disease (years) Source of synovial tissue CRP (mg/l) RF DMARDs NSAIDs Corticosteroid
Rheumatoid arthritis patients
1 32 M 5 TJR, knee joint left 82.7 + + – +
2 49 F 6 Expiration baker cystis, 32.5 + + – +
knee joint right
3 73 M 10 TJR, knee joint right 74.8 + – + –
4 65 F 16 TJR, thigh joint right 29.5 ? + + +
5 60 M 9 SE, knee joint right 84.6 + – + –
6 55 F 10 TJR, knee joint right 62.2 – – + –
7 57 F 10 TJR, knee joint left 17.4 + – + +
8 55 M 10 TJR, knee joint left 49.5 – – + –
9 46 M 8 SE, wrist joint left 15.9 + + – –
10 49 F 12 SE, wrist joint right 40.7 + + + –
Osteoarthritis patients
1 52 M 2 SE, knee joint left 96.0 ––––
2 31 F 5 SE, knee joint left 36.0 + – – –
3 37 M 1 SE, knee joint right <5.0 ––––
4 70 M 5 TJR, knee joint right <5.0 – – + –
5 77 M 8 TJR, knee joint right <5.0 – – + –
6 62 F 16 TJR, knee joint right <5.0 – – + –
7 74 F 20 TJR, knee joint left <5.0 – – + –
8 69 F 10 TJR, knee joint right 12.2 ? – + –
9 71 F 10 TJR, knee joint left 15.9 + – + –
10 67 F 1.5 TJR, knee joint left <5.0 – – + –
CRP, C-reactive protein; DMARD, disease-modifying antirheumatic drug; F/M, female/male; NSAID, nonsteroidal anti-inflammatory drug; RF,
rheumatoid factor; SE, synovectomy; TJR, total joint replacement.
tissue from either the 10 RA or the 10 OA patients were
pooled. The RNA pools were treated, labelled, and
hybridized to Affymetrix 5600 HuGeneFL Arrays
(Affymetrix Inc.), according to the manufacturer´s instruc-
tions. Scans of the arrays were evaluated using Affymetrix
Microarray Suite 5.0 (Affymetrix Inc.).
RNA isolation and semiquantitative reverse
transcription polymerase chain reaction
All synovial tissue samples were obtained directly during
the surgical procedure. The tissue material was trans-
ferred into liquid nitrogen immediately and stored [40,41].
Total RNA was prepared from 30 mg cryoconserved syno-
vial tissue from each patient using the RNeasy-Mini kit
(Qiagen, Hilden, Germany). All RNA samples were sub-
jected to digestion with 1 U DNase I (Life Technologies,
Eggenstein, Germany). Quality of all total RNA samples
was controlled by a 2100 bioanalyzer according to a RNA
6000 Nano-LabChip Kit procedure (Agilent Technologies,
Palo Alto, CA, USA), using 0.3 µg of each total RNA.
cDNA was synthesized from 1 µg total RNA in a 20 µl
reaction using 200 U Superscript
TM
II reverse transcrip-
tase (Life Technologies), 500 µmol/l of each deoxynu-
cleotide, 5 mmol/l DTT and 0.5 µg of oligo(dT)
15
(Invitek,
Berlin, Germany).
Polymerase chain reaction (PCR) was performed using a
20 µl volume with 0.5 U InViTAQ
TM
DNA polymerase
(Invitek), 1 µl single-stranded cDNA, 100 µmol/l dNTPs,
125 nmol/l of each primer (BioTez, Berlin, Germany) in
50 mmol/l Tris-HCl (pH 8.8), 16mmol/l (NH
4
)
2
SO
4
,
2.5 mmol/l MgCl
2
, and 0.01% Triton X-100. All PCRs were
performed using cDNA samples adjusted to equal glycer-
aldehyde-3-phosphate dehydrogenase (G3PDH) inputs
under conditions that permit exponential accumulation of
PCR products. PCR cycle number was chosen after amplifi-
cation of cDNA derived from samples with the highest con-
centrations of the gene under study. One cycle consisted of
a 30 s denaturation at 94°C, annealing for 30 s at a gene
specific temperature (see below), and extension at 72°C for
1 min. Control samples without reverse transcription (RT)
input RNA were included in all experiments.
The primer sequence and PCR conditions for IL-6 were
5′-TAG CCG CCC CAC ACA GAC AG-3′ and 5′-GGC
TGG CAT TTG TGG TTG GG-3′, used at 68°C annealing
temperature over 36 cycles. CXCR1-specific PCR was
done using 38 cycles with the primers 5′-ACA CAG CAA
AAT GGC GGA TGG-3′ and 5′-CGA TGA AGG CGT
AGA TGA TGG-3′, at 60°C annealing temperature. The
primer pairs 5′-TGG GCA ACA ATA CAG CAA ACT-3′
and 5′-GAG CAG GAA GAT GAG GAC GAC-3′, at 58°C
annealing temperature and for 33 cycles, were used for
CXCR2-specific amplification; and 5′-GCT TTG ACC
GCT ACC TGA ACA-3′ and 5′-GGC CAC CAC GAC
CAC CAC CAC-3′, at 62°C and for 32 cycles, were used
for CXCR3-specific amplification. CXCL9 mRNA was
detected after 29 cycles with the primers 5′-GGA GTG
CAA GGA ACC CCA GTA-3′ and 5′-CTT TTG GCT
GAC CTG TTT CTC-3′, and CXCL10 mRNA was ampli-
fied using 26 cycles with the primers 5′-ATT TGC TGC
CTT ATC TTT CTG-3′ and 5′-GAC ATC TCT TCT CAC
CCT TCT-3′, at annealing temperatures of 52°C and
55°C, respectively.
To determine G3PDH levels, G3PDH cDNA was ampli-
fied with 27 cycles in the presence of a competitor and
the primer pair 5′-GCA GGG GGG AGC CAA AAG GG-
3′ and 5′-TGC CAG CCC CAG CGT CAA AG-3′, at
59°C annealing temperature. The amplified region from
the competitor (851 bp) was 285 bp longer than the ampli-
cons derived from G3PDH cDNA samples.
PCR products were separated by electrophoresis on a
1.8% agarose gel. Ethidium bromide-stained agarose gels
were subjected to densitometry using the documentation
system 1000 (Biorad, Hercules, CA, USA). In order to
facilitate comparison of the results obtained from different
experiments, mRNA levels were expressed in relative
units. Specific mRNA level from each patient is given in
arbitrary units representing integrated peak areas
(adjusted volumes [counts × mm
2
]) of amplified cDNA,
analyzed by densitometric measurement.
Immunohistochemistry
For immunohistologic analysis of distribution of CXCR1,
CXCR2, and CXCR3, synovial tissue from patients with
RA and OA was fixed in 4% formaldehyde immediately
after surgery and subsequently embedded in paraffin wax.
Tissue from patients was cut in 2–5 µm thick sections.
Sections were dewaxed with xylol three times for 5 min
and hydrated with decreasing concentrations of ethanol
(100% for 5 min, 75% for 5 min, and finally aqua destillata
for 5 min). Afterward, the slides were treated with 3%
H
2
O
2
in phosphate buffered saline (PBS) to quench
endogenous peroxidase. For demasking of CXCR1,
CXCR2, CD3, and CD68, sections were subjected to
three 5-min heating cycles in citrate buffer using a
microwave oven at 560 W. Slides stained for prolyl-
4-hydroxylase were covered with the same buffer and
incubated for 30 min in the microwave oven. Pretreatment
for MC tryptase staining involved 5 min incubation with
0.1% pronase (Sigma, St. Louis, MO, USA) in PBS.
All sections were blocked in PBS, 5% goat serum albumin
(blocking buffer) for 20 min, and staining was performed
with the following primary antibodies at the given dilution
in blocking buffer (1 hour, room temperature): mouse
monoclonal antibodies against CXCR1 (Clone
42705.111, 1:40; R&D Systems, Minneapolis, MN, USA),
CXCR2 (Clone 48311.211, 1:10; R&D), CXCR3 (Clone
49801.111, 1:100; R&D), MC tryptase (Clone AA1, 1:50;
Arthritis Research & Therapy Vol 5 No 5 Ruschpler et al.
R244
Dako, Hamburg, Germany), CD68 (Clone KP1, 1:80;
Dako), fibroblast prolyl-4-hydroxylase (Clone 5B5, 1:10;
Dako), and CD3 (Clone F7.2.38, 1:50; Dako). After four
washes of 10 min each with PBS, secondary reagents
were applied for 30 min at room temperature. Primary anti-
bodies were detected in general using a biotinylated goat
antimouse IgG (Biogenex, San Ramon, CA, USA). After
extensive washing in PBS as above, sections were incu-
bated with peroxidase-conjugated streptavidin for 30 min
at room temperature. Antigen–antibody complexes were
visualized by incubation with substrate solution containing
0.5 mg/ml 3-amino-9-ethylcarbazole (Sigma) and 3%
H
2
O
2
in 0.1 mol/l sodium acetate buffer pH 5.2 for 5 min
at room temperature. Subsequently, the slides were rinsed
in distilled water, counterstained with Mayer’s hematoxylin
(Merck, Darmstadt, Germany), and mounted in Aquatex
(Merck). In order to identify the cell type of CXCR-positive
cells, serial sectioning was performed and subsequent
sections were stained for the particular CXCR proteins
and the cell type marker. Antibody staining specificity was
verified using isotype controls. CXCR3 antibody was con-
firmed using IgG
1
isotype matched control (Sigma). The
slides were examined and scored independently by two of
us (PR, PS) without knowledge of the clinical and patho-
logic data for the particular sample.
Western blotting
Protein levels of CXCR1, CXCR2, and CXCR3 in RA
versus OA synovial tissue were examined by Western
blotting of tissue extracts. Extracts were obtained using
Mem-PER
®
mammalian membrane protein extraction kit
(Pierce, Rockford, IL, USA), as detailed in the manufactur-
er’s protocol. Protein concentrations were determined
using the DC protein assay (Biorad). Each sample, equiva-
lent to 10 µg total protein, was separated by 12% sodium
dodecyl sulfate–polyacrylamide gel electrophoresis and
subsequently transferred to Hybond-N nitrocellulose mem-
branes (Amersham Biosciences, Piscataway, NJ, USA) by
standard procedures. The blotting membrane was blocked
for 2 hours with PBS, 6% nonfat milk powder, 0.1%
Tween (for CXCR1 staining) or TBS, 1% bovine serum
albumin, and 0.05% Tween (for CXCR2 and CXCR3).
The primary antibodies against CXCR1, CXCR2, and
CXCR3 were the same as above and used at 1:100
(CXCR1 and CXCR2) and 1:80 (CXCR3) in the respec-
tive blocking buffer at 4°C overnight. To assess equal
loading of protein lysate for each sample, a parallel blot
was incubated with an anti-β-actin antibody (Clone AC-
15, 1:50000; Sigma). Bound primary antibodies were
detected using biotinylated goat antimouse IgG sec-
ondary antibody (Dako) and subsequently incubated with
streptavidin-conjugated peroxidase (Dako), each for 1 hour
at room temperature. After each incubation, blots were
washed with PBS–Tween 0.05%. Signals were devel-
oped with ECL chemiluminescence reagent and recorded
on Hyperfilm
TM
-ECL
TM
(Amersham Biosciences). The
signals were subjected to densitometric measurements
using the Chemi Doc system (Biorad).
Statistical analysis
Statistically significant differences were determined by the
Student’s t-test and Mann–Whitney rank sum test as indi-
cated in the figure legends. P < 0.05 was considered sta-
tistically significant. The analysis was conducted using
SigmaStat for Windows 2.0 (Jandel Cooperation Inc., San
Rafael, CA, USA).
Results
CXCR mRNA expression
To unravel disease-specific differences that are character-
istic for synovial tissue from patients with RA versus OA
disease, total RNA from 30 mg synovial tissue was iso-
lated. Quality of all samples was controlled in a 2100 bio-
analyzer (Fig. 1). In the first pilot experiment we used
Affymetrix HuGene FL DNA oligonucleotide microarrays
(7131 gene sets) and two pools of RNAs from
10 patients, each with RA or OA disease. In total, 101
genes were found to be elevated whereas 300 genes
were decreased in RA in comparison with OA (data not
shown). This initial experiment showed that levels of the
IFN-γ inducible chemokine receptor CXCR3 and of its
ligands CXCL9 and CXCL10 are strongly upregulated in
RA as compared with OA (Table 2). CXCR3 exhibited
2.3-fold, CXCL9 4.6-fold, and CXCL10 9.8-fold increased
levels in RA samples. Signals on the chip for the related
chemokine receptors CXCR1 (IL-8 receptor α) and
CXCR2 (IL-8 receptor β) were either scored as absent in
both situations or scored as not changed.
Because pooled samples may sometimes produce
obscure findings and PCR-based methods are known to
be more sensitive than the Affymetrix gene chip technol-
ogy, semiquantitative RT-PCR was introduced to validate
Affymetrix-derived mRNA expression levels in individual
patient samples (RA, n = 20; OA, n = 10). First, IL-6 mRNA
levels were quantified to provide a positive control for
upregulated gene expression in RA versus OA. As
expected, levels of IL-6 transcript were significantly higher
in RA samples than in those derived from OA synovial
tissue, which apparently did not exhibit detectable IL-6
transcripts (Fig. 1). Then, mRNA levels of chemokine
receptors were investigated. RT-PCR revealed increased
CXCR3 mRNA levels (P < 0.001) in RA as compared with
OA synovial tissue (Fig. 2a). This an increase of 3.6-fold in
CXCR3 transcript levels was found in synovial tissue of
RA patients (Fig. 2a,b). Similarly, levels of CXCR1 and
CXCR2 transcripts were increased by 10-fold (P < 0.05)
and approximately sixfold (P < 0.05) in RA versus OA syn-
ovial samples (Fig. 2b), respectively. RT-PCR analyses for
the CXCR3 ligands CXCL9 and CXCL10 revealed large
increases (i.e. 135-fold [P < 0.001] and 340-fold
[P < 0.05], respectively) in RA as compared with OA syno-
Available online />R245
vial tissue (Fig. 2b). Altogether, we confirmed that the
chemokine receptors CXCR1, CXCR2 and CXCR3, as
well as the CXCR3 ligands CXCL9 and CXCL10, are
more abundantly expressed at the mRNA level in RA syn-
ovial tissue than in OA synovial tissue.
It was previously found that T cells are present in approxi-
mately 50% of RA synovial tissue [42]. According to our
own observations, nearly 20% T cells in the synovial tissue
of RA patients can be readily demonstrated (data not
shown). In order to consider the degree of differential infil-
tration of T lymphocytes as well as their influence on
inflammation-induced CXCR3 expression between RA
and OA, we analyzed the expression of TCR-ζ (CD247).
DNA microarray data (Table 2) and RT-PCR experiments
in individual patient samples (Fig. 2b) clearly corroborated
higher levels of TCR-ζ transcripts within the RA than in the
OA samples. However, calculation of ratios between the
respective mean CXCR mRNA and the mean TCR-ζ
mRNA levels of each disease group revealed higher
values for the three analyzed CXCR transcripts in the RA
synovial tissue (CXCR1, P < 0.05; CXCR2, P < 0.05;
CXCR3, P < 0.01), suggesting higher CXCR expression
levels in non-T cells in RA synovial tissue (Fig. 2c).
Evaluation of CXCR3 protein expression
To confirm the increase in CXCR3 expression at the
protein level, Western blot experiments in selected
Arthritis Research & Therapy Vol 5 No 5 Ruschpler et al.
R246
Table 2
Selected RNA profiling data
Signal Detection Signal Detection Signal Fold
Accession number Gene OA chip OA chip RA chip RA chip log ratio change Change P (for change)
U11870 CXCR1 119.6 A 163.5 A 0.5 NA NC 0.5
U11872 CXCR1splice variant 180.7 A 232.5 A –0.0 NA NC 0.5
L19593 CXCR2 34.9 P 41.3 A –0.2 NA NC 0.5
X95876 CXCR3 478.6 A 1295.6 P 1.2 2.3 I 0.000051
X72755 CXCL9 (Mig) 177.5 P 1988.1 P 3.3 9.8 I <0.000001
X02530 CXCL10 (IP-10) 189.3 P 656.6 P 2.2 4.6 I <0.000001
J04132 TCR-ζ (CD247) 146.3 P 345 P 1.5 2.8 I 0.000133
RNA pools from patients suffering from rheumatoid arthritis (RA) or osteoarthritis (OA) were analyzed using Affymetrix HuGeneFL microarrays. Data
assessment was done using Affymetrix Microarray Suite 5.0. CXCL, Cys–X–Cys ligand; CXCR, Cys–X–Cys receptor; NA, not applicable; TCR, T-
cell receptor.
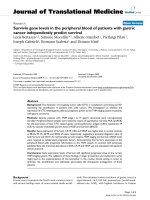
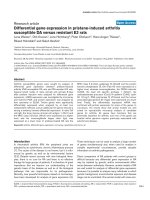
Figure 1
Analysis of IL-6 mRNA levels within synovial tissue from rheumatoid arthritis (RA) as compared with that from osteoarthritis (OA) patients. Upper
panels: quality control of total RNA preparations. Aliquots (300 ng) of total RNA extracted from synovial tissue from RA and OA patients were
plotted on a RNA 6000 Nano-LabChip. Quality of RNA was scanned using a 2100 bioanalyzer. RNA gel electropherograms show the presence of
28S and 18S ribosomal units, indicating intact RNA of the investigated samples. Lower panels: differential IL-6 mRNA levels were determined by
semiquantitative reverse transcription polymerase chain reaction (PCR). The figure shows a representative analysis of eight cDNA samples derived
from patients with RA and of eight cDNA samples from patients with OA. cDNA samples were adjusted to equal glyceraldehyde-3-phosphate
dehydrogenase (G3PDH) levels, performed by competitive PCR using an internal standard (see Materials and methods). Numbered lanes
correspond to individual patients within Table 1.
extracts from synovial tissue of RA and OA patients were
conducted (Fig. 3a). Staining for CXCR1 (P < 0.05) and
CXCR3 (P < 0.01) revealed a higher level of expression
for each protein in RA than in OA synovial tissue (Fig. 3b).
CXCR2 protein levels were rather low, and signals were
not significantly different between the two disease situa-
Available online />R247
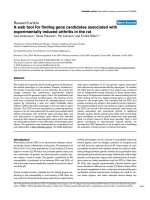
Figure 2
Analysis of mRNA levels of selected genes in synovial tissue from rheumatoid arthritis (RA) as compared to that from osteoarthritis (OA) patients by
semiquantitative reverse transcription polymerase chain reaction (RT-PCR). Bars represent means ± SD of signal intensities after amplification of
samples (see Materials and methods). The data from one representative experiment with one determination per patient sample are shown.
Differences between RA and OA sample groups were statistically evaluated using the Student’s t-test (*P < 0.05, **P < 0.01, ***P < 0.001).
(a) RT-PCR analysis of 10 cDNA samples derived from patients with RA and of 10 cDNA samples from patients with OA. cDNA samples were
adjusted to equal glyceraldehyde-3-phosphate dehydrogenase (G3PDH) levels, performed by competitive PCR using an internal standard (see
Materials and methods). Numbered lanes correspond to individual patients within Table 1. (b) Quantitation of the expression of Cys–X–Cys
receptor (CXCR)1, CXCR2, CXCR3, T-cell receptor (TCR)-ζ, Cys–X–Cys ligand (CXCL)9, and CXCL10 mRNAs in RA and OA synovial tissues.
(c) CXCR/TCR-ζ mRNA ratios in RA versus OA synovial tissues.
tions. Thus, in agreement with differential mRNA expres-
sion, CXCR1 and CXCR3 proteins were expressed in syn-
ovial tissue from patients with RA at higher levels than in
tissues from patients with OA.
Distribution and cellular assignment of CXCR1, CXCR2,
and CXCR3 to different cellular subsets in RA and OA
tissues
Initial immunohistochemical analyses revealed over-
expression of IL-6 protein within RA tissue sections (data
not shown). Next, we investigated cellular distribution of
the CXCR1, CXCR2, and CXCR3 proteins. Among the
RA synovial tissue samples examined for CXCR1,
CXCR2, and CXCR3 immunoreactivity, 8 out of 20 speci-
mens exhibited heterogeneous histologic changes in
terms of inflammatory infiltration in sublining regions.
Twelve samples showed a high number of infiltrating lym-
phocytes as well as macrophages, and exhibited a
destroyed synovial intima, including fibrin exudation. All RA
synovial tissue samples exhibited medium to strong
CXCR1 as well as CXCR3 immunoreactivity. In contrast,
signals for CXCR2 were undetectable in all RA synovial
tissue samples.
CXCR1
+
and CXCR3
+
cells varied from region to region
and from patient to patient (ranging from 20% to 60%) and
were assigned to specific cellular subsets by differential
antibody staining of sequential sections. The CXCR1
protein was weakly expressed on CD68
+
macrophages in
a diffuse manner and showed a consistent distribution
pattern within all sections of RA patients (data not shown).
Unexpectedly, in all samples inspected prominent staining
for CXCR3 was found on scattered MCs within sublining
layers and interstitial areas, as well as in perivascular com-
partments of the rheumatoid synovial tissue (Fig. 4). In
agreement with earlier reports, CXCR3 protein was also
observed on CD3
+
T lymphocytes (data not shown).
Strong staining of MCs suggested a high density of
CXCR3 antigen expression. Longer color development
during immunohistochemical staining revealed weak and
more diffuse signals for CXCR3 protein, appearing in all
areas of the rheumatoid tissue. By sequential sectioning,
these signals could be attributed to synovial fibroblasts,
identified by an antibody against prolyl-4-hydroxylase (data
not shown). In 10 OA samples examined, there was stain-
ing for CXCR1 protein on a few macrophages within subin-
timal regions of OA synovial tissue and a subset of resident
mononuclear phagocytes (synovial macrophages or histo-
cytes) in all areas of synovial tissue. Signals for CXCR3
protein were low and diffuse and could be assigned to syn-
ovial fibroblasts – but not to tissue MCs – in a wide range
of sublining compartments (data not shown).
Discussion
Using differential display of gene expression by microarray
analysis, one set of 101 upregulated RA-related genes
and one set of 300 gene transcripts considered to be
downregulated in RA were detected and are now available
for further research.
A comparative analysis of synovial tissue pools from RA
versus OA patients and our earlier studies on Th1/Th2
balance in RA [37] prompted us to validate and to confirm
the expression of chemokines and their receptors in RA
versus OA synovial tissue.
Arthritis Research & Therapy Vol 5 No 5 Ruschpler et al.
R248
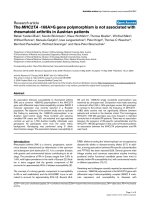
Figure 3
Western blot analysis of Cys–X–Cys receptor (CXCR)1, CXCR2, and
CXCR3 protein expression in selected rheumatoid arthritis (RA) and
osteoarthritis (OA) synovial tissues. (a) Tissue extracts from RA (n =8)
and from OA patients (n = 4) were analyzed. Numbered lanes
correspond to individual patients within Table 1. Staining of the
indicated proteins on parallel blots is shown. Equal loading of tissue
extracts was controlled by β-actin protein staining. MW indicates a
protein from ECL molecular weight markers. (b) Western blot signals
on Hyperfilm
TM
ECL
TM
after the chemiluminescence reactions were
analyzed semiquantitatively using densitometric scanning. Expression
is given in arbitrary units and the means ± SD of the RA and OA
groups are plotted. Differences between RA and OA groups were
assessed statistically using the Student’s t-test (*P < 0.05, **P < 0.01).
Our initial experiments revealed higher levels of
chemokine ligand (CXCL9, CXCL10) and receptor
(CXCR1, CXCR2, CXCR3) mRNAs in RA than in OA
synovial tissue. Similar to other diseases [12,18], high
expression of CXCR3 suggests the presence of an
inflammatory trigger and of chemotactic recruitment of
T-cell subsets to the sites of inflammation in RA. Because
activated CD3
+
T cells have been found to be the major
cell type expressing chemokine receptors, the increase in
CXCR3 expression could be due, at least in part, to
higher levels of T cells in RA than in OA synovial tissue
samples [4,22]. There is an established relationship
between joint-specific manifestations of RA and recruit-
ment of leukocytes derived from the blood in response to
chemokines [5,6,20]. In comparison with OA, more pro-
nounced T cell infiltration can be observed in RA synovial
tissue [43]. Therefore, the present study showed signifi-
cantly increased expression of TCR-ζ mRNA in RA as
compared with OA tissues. However, CXCR3/TCR-ζ
mRNA ratio was higher in RA than in OA. Although
CXCR3 expression was previously demonstrated in syn-
ovial tissue of RA patients, high CXCR3 mRNA levels in
synovial MCs has not yet been described [5,17].
Increased CXCR3 mRNA expression within synovial
tissue from RA versus OA patients is reflected by higher
CXCR3/TCR-ζ mRNA ratios and is apparently associated
with high CXCR3 mRNA levels on MCs within RA syn-
ovial tissue.
At the protein level, we observed abundant expression of
CXCR1 and CXCR3 in RA synovial tissue. Thus, we iden-
tified CXCR1 protein expression on synovial macrophages
in RA as well as in OA patients. In this respect, our report
confirms increased CXCR1 protein expression on synovial
macrophages, which has been considered to cause a
chemotactic influx of mononuclear cells into RA synovial
tissue in response to CXCL8 (IL-8) [33,34].
The most exciting observation was the strong CXCR3
protein expression on tissue MCs in RA synovial tissue.
These data indicate that increasing CXCR3 protein levels
are most likely due to enhanced recruitment of MCs that
express CXCR3 in RA synovial tissue. To our knowledge,
this is the first report to demonstrate expression of CXCR3
in MCs within synovial tissue of RA patients. Additional
expression of CXCR3 protein on synovial fibroblasts in
both RA and OA points possibly to an increased level of
activation among these cells. The chemokine receptor
CXCR3 was previously found to be strongly expressed on
activated T lymphocytes, exhibiting lower or no detectable
expression in resting T cells, B cells, monocytes, or granu-
locytes [6]. Other authors assigned CXCR3 and CCR5
Available online />R249
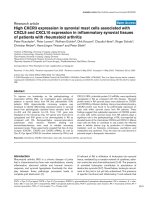
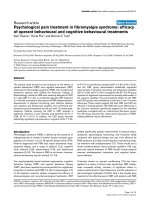
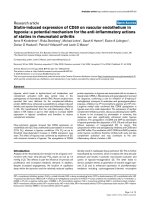
Figure 4
Cellular distribution of Cys–X–Cys receptor (CXCR)3 protein in synovial tissue from rheumatoid arthritis (RA) patients. Localization of strong
CXCR3 protein signals in mast cells within the sublining areas of rheumatoid synovial tissues was found. Sequential sections of paraffin-embedded
tissue were stained for CXCR3 and mast cell tryptase proteins or using an IgG
1
isotype-matched control. Each arrow refers the same cell that was
positively stained for CXCR3 and mast cell tryptase (original magnification: upper panel × 200; lower panel × 400).
proteins predominantly to Th1 lymphocytes, whereas Th2
lymphocytes produced CCR3 and CCR4 [12,13,18,26]. In
RA, CXCR3 expression was also found to be restricted to
lymphocytic cells in perivascular inflammatory infiltrates
within active lesions of synovial tissue [5,20,25]. The
ligands of CXCR3 (CXCL9 and CXCL10) do not chemo-
tactically attract granulocytes, but appear to promote T-cell
adhesion to endothelial cells [44]. A recent report by Qin
and coworkers [5] showed that more than 80% of perivas-
cular T lymphocytes within rheumatoid synovial tissue were
immunoreactive for CXCR3. Disparity in findings may arise
from study of various stages and different histopathologic
subtypes of RA [1,2,36,38].
Similar to another report that implicated recruitment of
eosinophils via CXCR3 [28], we suggest that MC precur-
sors are recruited to sites of inflammation through
CXCR3 by chemoattractants. Indeed, apart from
macrophages, lymphocytes, fibroblasts and neutrophils,
which are considered to be important contributors to the
pathogenesis of RA, increased numbers of MCs are
found in the synovial tissue and synovial fluid of RA
patients [44,45]. MC-associated CXCR3 expression may
indicate that additional mechanism exist that result in an
amplified proinflammatory stimulus, by secretion of pro-
teinases, chemotactic factors, and vasoactive material
[46]. The contributions made by MCs to the events of
inflammation and degradation of extracellular matrix were
recently pointed out [47]. Interestingly, the zymogen
forms of the matrix metalloproteinases prostromelysin and
procollagenase are activated by specific MC subsets that
either express tryptase (MC
T
) or tryptase and chymase
(MC
TC
) [48,49]. Distinct functional differences between
these MC subsets are reflected by differential expression
of IL-4, IL-5 and IL-6 in MC
T
, and IL-4 in MC
TC
, which can
also be observed in rheumatic tissue [50]. The cytokine
profile expressed by different MC subsets, including the
proinflammatory mediators tumor necrosis factor-α and
IL-1β [46,51], fits well into our model of active recruitment
of MC precursors into rheumatoid lesions via CXCR3 [52].
MCs mature from circulating CD34
+
, c-kit
+
, and CD13
+
progenitors after moving into peripheral tissues [35,53,54].
It is likely that MC precursors can also be recruited to sites
of inflammation through their additional CXCR3 surface
expression and support the characteristic features of RA.
The impact on inflammatory and erosive arthritis by MCs
was recently demonstrated in an animal model [55]. There
was no evidence for arthritis in one MC-deficient mice
strain (W/W
V
) after arthritogenic serum was transferred
from K/B×N mice, although control mice exhibited all of the
clinical and histological features of inflammatory and
erosive arthritis. A hallmark of MC activation in the effector
phases of inflammatory arthritis included degranulation
(release of histamine, proteases, tumor necrosis factor-α
and IL-1) in synovial tissue but not in other tissues. The
authors concluded further that tissue MCs exhibit a syn-
ovial tissue-specific role, and that they represent a cellular
link between soluble mediators and both erosive and
degenerative events in inflammatory arthritis. In this context,
the functionality of chemokine receptors was shown by the
decreased recruitment/migration of CXCR3-expressing
mononuclear cells, including MCs, after treatment with self-
specific anti-CXCL10 and antimurine CXCR3 in animal
models [56,57]. Antimurine CXCR3 treatment within a col-
lagen-induced arthritis mouse model should be a valid
model with which to analyze the recruitment/migration of
inflammatory MCs in RA [58].
Our observations suggest that the proinflammatory char-
acter of RA is mediated through continuous recruitment
and activation and/or presence of various immunocompe-
tent cells, including tissue MCs.
The present study suggests that Th1-associated CXCR3
expression in synovial tissue is associated with distinct
biologic functions of MCs in RA. It appears that the
actions of CXCL9 and CXCL10 are not restricted to pro-
moting recruitment of activated T lymphocytes and their
migration to sites of inflammation, but that they may also
serve to recruit MC precursors into rheumatoid synovial
tissue. Finally, we suggest that either vessel-derived MC
precursors express CXCR3 a priori and become recruited
to sites of inflammation, or that mature tissue MCs
become activated within RA synovial tissue and upregu-
late CXCR3 secondarily in response to signals from the
proinflammatory trigger. Activated MCs are characterized
by degranulation of inflammatory and proteolytic mole-
cules (histamine, proteases, tumor necrosis factor-α) and
thus might represent an effector cell subset for degrada-
tion and destruction in RA synovial tissue.
Conclusion
Microarray analysis is a valuable tool with which to detect
differential expression of genes in RA and OA. One gene
whose expression is increased in RA synovial tissue
encodes the chemokine receptor CXCR3. Importantly, the
CXCR3 ligands CXCL9 and CXCL10 are also upregulated
in RA. Tissue MCs are largely responsible for CXCR3
expression. We propose a novel regulatory aspect of joint
destruction comprising MCs that transmit the effects of
soluble cytokines, including chemokines. Thus, MCs may
represent a new target for therapeutic intervention in RA.
Competing interests
None declared.
Acknowledgement
The present study was performed as part of the ‘BMBF-Leitprojekt
Molekulare Medizin: Proteomanalyse des Menschen’ initiative sup-
ported by the German government (Bundesministerium für Forschung
und Technologie, ‘FKZ: 01GG9835/4’). We thank Dr G Aust for the IL-
6 primers. We thank Mrs A Gronemann for skilled technical assistance.
Arthritis Research & Therapy Vol 5 No 5 Ruschpler et al.
R250
References
1. Gay S, Gay RE, Koopman WJ: Molecular and cellular mecha-
nisms of joint destruction in rheumatoid arthritis: two cellular
mechanisms explain joint destruction? Ann Rheum Dis 1993,
52:39-47.
2. Muller-Ladner U: Molecular and cellular interactions in rheuma-
toid synovium. Curr Opin Rheumatol 1996, 8:210-220.
3. Springer TA: Traffic signals for lymphocyte recirculation and
leukocyte emigration: the multistep paradigm. Cell 1994, 76:
301-314.
4. Kunkel SL: Through the looking glass: the diverse in vivo
activities of chemokines. J Clin Invest 1999, 104:1333-1334.
5. Qin S, Rottman JB, Myers P, Kassam N, Weinblatt M, Loetscher
M, Koch AE, Moser B, Mackay CR: The chemokine receptors
CXCR3 and CCR5 mark subsets of T cells associated with
certain inflammatory reactions. J Clin Invest 1998, 101:746-
754.
6. Murdoch C, Finn A: Chemokine receptors and their role in
inflammation and infectious diseases. Blood 2000, 95:3032-
3043.
7. Murray K, Thompson SD, Glass DN: Pathogenesis of juvenile
chronic arthritis: genetic and environmental factors. Arch Dis
Child 1997, 77:530-534.
8. Pitzalis C, Kingsley G, Haskard D, Panayi G: The preferential
accumulation of helper-inducer T lymphocytes in inflamma-
tory lesions: evidence for regulation by selective endothelial
and homotypic adhesion. Eur J Immunol 1988, 18:1397-1404.
9. Godfrey HP, Ilardi C, Engber W, Graziano FM: Quantitation of
human synovial mast cells in rheumatoid arthritis and other
rheumatic diseases. Arthritis Rheum 1984, 27:852-856.
10. Okada Y: The mast cells in synovial membrane of patients
with joint disease. Japanese J Ortho Surg 1973, 47:657-674.
11. Austrup F, Vestweber D, Borges E, Lohning M, Brauer R, Herz U,
Renz H, Hallmann R, Scheffold A, Radbruch A, Hamann A: P- and
E-selectin mediate recruitment of T-helper-1 but not T-helper-
2 cells into inflammed tissues. Nature 1997, 385:81-83.
12. Bonecchi R, Bianchi G, Bordignon PP, D’Ambrosio D, Lang R,
Borsatti A, Sozzani S, Allavena P, Gray PA, Mantovani A, Sini-
gaglia F: Differential expression of chemokine receptors and
chemotactic responsiveness of type 1 T helper cells (Th1s)
and Th2s. J Exp Med 1998, 187:129-134.
13. Sallusto F, Mackay CR, Lanzavecchia A: Selective expression of
the eotaxin receptor CCR3 by human T helper 2 cells. Science
1997, 277:2005-2007.
14. Siveke JT, Hamann A: T helper 1 and T helper 2 cells respond
differentially to chemokines. J Immunol 1998, 160:550-554.
15. Kelner GS, Kennedy J, Bacon KB, Kleyensteuber S, Largaespada
DA, Jenkins NA, Copeland NG, Bazan JF, Moore KW, Schall TJ, et
al.: Lymphotactin: a cytokine that represents a new class of
chemokine. Science 1994, 266:1395-1399.
16. Luster AD, Ravetch JV: Biochemical characterization of a
gamma interferon-inducible cytokine (IP-10). J Exp Med 1987,
166:1084-1097.
17. Suzuki N, Nakajima A, Yoshino S, Matsushima K, Yagita H,
Okumura K: Selective accumulation of CCR5
+
T lymphocytes
into inflamed joints of rheumatoid arthritis. Int Immunol 1999,
11:553-559.
18. Sallusto F, Lenig D, Mackay CR, Lanzavecchia A: Flexible pro-
grams of chemokine receptor expression on human polarized
T helper 1 and 2 lymphocytes. J Exp Med 1998, 187:875-883.
19. Wedderburn LR, Robinson N, Patel A, Varsani H, Woo P: Selec-
tive recruitment of polarized T cells expressing CCR5 and
CXCR3 to the inflamed joints of children with juvenile idio-
pathic arthritis. Arthritis Rheum 2000, 43:765-774.
20. Loetscher M, Gerber B, Loetscher P, Jones SA, Piali L, Clark-
Lewis I, Baggiolini M, Moser B: Chemokine receptor specific for
IP10 and mig: structure, function, and expression in activated
T-lymphocytes. J Exp Med 1996, 184:963-969.
21. Loetscher M, Loetscher P, Brass N, Meese E, Moser B: Lympho-
cyte-specific chemokine receptor CXCR3: regulation,
chemokine binding and gene localization. Eur J Immunol 1998,
28:3696-3705.
22. Farber JM: HuMig: a new human member of the chemokine
family of cytokines. Biochem Biophys Res Commun 1993, 192:
223-230.
23. Piali L, Weber C, LaRosa G, Mackay CR, Springer TA, Clark-
Lewis I, Moser B: The chemokine receptor CXCR3 mediates
rapid and shear-resistant adhesion-induction of effector T
lymphocytes by the chemokines IP10 and Mig. Eur J Immunol
1998, 28:961-972.
24. Ruth JH, Rottman JB, Katschke KJ Jr, Qin S, Wu L, LaRosa G,
Ponath P, Pope RM, Koch AE: Selective lymphocyte chemokine
receptor expression in the rheumatoid joint. Arthritis Rheum
2001, 44:2750-2760.
25. Imai T, Nagira M, Takagi S, Kakizaki M, Nishimura M, Wang J,
Gray PW, Matsushima K, Yoshie O: Selective recruitment of
CCR4-bearing Th2 cells toward antigen-presenting cells by
the CC chemokines thymus and activation-regulated
chemokine and macrophage-derived chemokine. Int Immunol
1999, 11:81-88.
26. Garcia-Lopez MA, Sanchez-Madrid F, Rodriguez-Frade JM,
Mellado M, Acevedo A, Garcia MI, Albar JP, Martinez C,
Marazuela M: CXCR3 chemokine receptor distribution in
normal and inflamed tissues: expression on activated lym-
phocytes, endothelial cells, and dendritic cells. Lab Invest
2001, 81:409-418.
27. Jinquan T, Jing C, Jacobi HH, Reimert CM, Millner A, Quan S,
Hansen JB, Dissing S, Malling HJ, Skov PS, Poulsen LK: CXCR3
expression and activation of eosinophils: role of IFN-gamma-
inducible protein-10 and monokine induced by IFN-gamma. J
Immunol 2000, 165:1548-1556.
28. Kunkel SL, Lukacs N, Kasama T, Strieter RM: The role of
chemokines in inflammatory joint disease. J Leukoc Biol 1996,
59:6-12.
29. Lukacs NW, Kunkel SL: Chemokines and their role in disease.
Int J Clin Lab Res 1998, 28:91-95.
30. Tuschil A, Lam C, Haslberger A, Lindley I: Interleukin-8 stimu-
lates calcium transients and promotes epidermal cell prolifer-
ation. J Invest Dermatol 1992, 99:294-298.
31. Schonbeck U, Brandt E, Petersen F, Flad HD, Loppnow H: IL-8
specifically binds to endothelial but not to smooth muscle
cells. J Immunol 1995, 154:2375-2383.
32. Schulz BS, Michel G, Wagner S, Suss R, Beetz A, Peter RU,
Kemeny L, Ruzicka T: Increased expression of epidermal IL-8
receptor in psoriasis. Down-regulation by FK-506 in vitro. J
Immunol 1993, 151:4399-4406.
33. Kraan MC, Patel DD, Haringman JJ, Smith MD, Weedon H, Ahern
MJ, Breedveld FC, Tak PP: The development of clinical signs of
rheumatoid synovial inflammation is associated with
increased synthesis of the chemokine CXCL8 (interleukin-8).
Arthritis Res 2001, 3:65-71.
34. Baggiolini M, Dewald B, Moser B: Human chemokines: an
update. Annu Rev Immunol 1997, 15:675-705.
35. Dolhain RJ, ter Haar NT, Hoefakker S, Tak PP, de Ley M, Claassen
E, Breedveld FC, Miltenburg AM: Increased expression of inter-
feron (IFN)-gamma together with IFN-gamma receptor in the
rheumatoid synovial membrane compared with synovium of
patients with osteoarthritis. Br J Rheumatol 1996, 35:24-32.
36. Stiehl P: Histologie der Rheumatoid-Arthritis. Beitrag zur diag-
nostischen und pathogenetischen Heterogenität, zur Aktiv-
itätsdiagnose und Prognose. In: Arthritiden, vol 5. Edited by
Sack U. Lengerich: Pabst Science Publishers; 1997:188-200.
37. Ruschpler P, Stiehl P: Shift in Th1 (IL-2 and IFN-gamma) and
Th2 (IL-10 and IL-4) cytokine mRNA balance within two new
histological main-types of rheumatoid-arthritis (RA). Cell Mol
Biol 2002, 48:285-293.
38. Arnett FC, Edworthy SM, Bloch DA, McShane DJ, Fries JF,
Cooper NS, Healey LA, Kaplan SR, Liang MH, Luthra HS, et al.:
The American Rheumatism Association 1987 revised criteria
for the classification of rheumatoid arthritis. Arthritis Rheum
1988, 31:315-324.
39. Geiler G, Stiehl P. Significance of the concepts basic activity and
actual activity in the morphological evaluation of synovial mem-
branes in rheumatoid arthritis. Z Rheumatol 1974, 33:73-86.
40. Heller RA, Schena M, Chai A, Shalon D, Bedilion T, Gilmore J,
Woolley DE, Davis RW: Discovery and analysis of inflammatory
disease-related genes using cDNA microarrays. Proc Natl
Acad Sci USA 1997, 94:2150-2155.
41. Grotzer MA, Patti R, Geoerger B, Eggert A, Chou TT, Phillips PC:
Biological stability of RNA isolated from RNAlater-treated
brain tumor and neuroblastoma xenografts. Med Pediatr Oncol
2000, 34:438-442.
42. Konttinen YT, Reitamo S, Ranki A, Hayry P, Kankaanapaa U,
Wegelius O: Characterization of the immunocompetent cells
Available online />R251
of rheumatoid synovium from tissue sections and eluates.
Arthritis Rheum 1981, 24:71-79.
43. Taub DD, Lloyd AR, Conlon K, Wang JM, Ortaldo JR, Harada A,
Matsushima K, Kelvin DJ, Oppenheim JJ: Recombinant human
interferon-inducible protein 10 is a chemoattractant for
human monocytes and T lymphocytes and promotes T cell
adhesion to endothelial cells. J Exp Med 1993, 177:1809-
1814.
44. Tetlow LC, Woolley DE: Distribution, activation and tryptase/
chymase phenotype of mast cells in the rheumatoid lesion.
Ann Rheum Dis 1995, 54:549-555.
45. Gruber BL, Kaplan AP: Mast cells and rheumatic diseases. In:
Arthritis and Allied Conditions. Edited by McCarty DJ, Koopmann
WJ. Philadelphia: Lea & Febiger; 1993:417-429.
46. Galli SJ: New concepts about the mast cell. N Engl J Med
1993, 328:257-265.
47. Tetlow LC, Woolley DE: Mast cells, cytokines, and metallopro-
teinases at the rheumatoid lesion: dual immunolocalisation
studies. Ann Rheum Dis 1995, 54:896-903.
48. Lees M, Taylor DJ, Woolley DE: Mast cell proteinases activate
precursor forms of collagenase and stromelysin, but not of
gelatinases A and B. Eur J Biochem 1994, 223:171-177.
49. Saarinen J, Kalkkinen N, Welgus HG, Kovanen PT: Activation of
human interstitial procollagenase through direct cleavage of
the Leu83-Thr84 bond by mast cell chymase. J Biol Chem
1994, 269:18134-18140.
50. Gotis-Graham I, McNeil HP: Mast cell responses in rheumatoid
synovium. Association of the MC
TC
subset with matrix
turnover and clinical progression. Arthritis Rheum 1997, 40:
479-489.
51. Woolley DE: Mast cells in rheumatoid lesion: ringleaders or
innocent bystanders? Ann Rheum Dis 1995, 54:533-534.
52. Wang HW, Tedla N, Lloyd AR, Wakefield D, McNeil PH: Mast
cell activation and migration to lymph nodes during induction
of an immune response in mice. J Clin Invest 1998, 102:1617-
1626.
53. Kitamura Y, Go S, Hatanaka K. Decrease of mast cells in W/Wv
mice and their increase by bone marrow transplantation.
Blood 1978, 52:447-452.
54. Kirshenbaum AS, Goff JP, Semere T, Foster B, Scott LM, Met-
calfe DD: Demonstration that human mast cells arise from a
progenitor cell population that is CD34(+), c-kit(+), and
expresses aminopeptidase N (CD13). Blood 1999, 94:2333-
2342.
55. Lee DM, Friend DS, Gurish MF, Benoist C, Mathis D, Brenner
MB: Mast cells: a cellular link between autoantibodies and
inflammatory arthritis. Science 2002, 297:1689-1692.
56. Belperio JA, Keane MP, Burdick MD, Lynch JP 3rd, Xue YY, Li K,
Ross DJ, Strieter RM: Critical role for CXCR3 chemokine
biology in the pathogenesis of bronchiolitis obliterans syn-
drome. J Immunol 2002, 169:1037-1049.
57. Salomon I, Netzer N, Wildbaum G, Schif-Zuck S, Maor G, Karin N:
Targeting the function of IFN-gamma-inducible protein 10
suppresses ongoing adjuvant arthritis. J Immunol 2002, 169:
2685-2693.
58. Kobayashi Y, Okunishi H: Mast cells as a target of rheumatoid
arthritis treatment. Jpn J Pharmacol 2002, 90:7-11.
Correspondence
Peter Ruschpler, PhD, Institute of Pathology, University of Leipzig,
Liebigstr. 26, 04103 Leipzig, Germany. Tel: +49 341 97 15003; fax:
+49 341 97 15029; e-mail:
Arthritis Research & Therapy Vol 5 No 5 Ruschpler et al.
R252