Báo cáo y học: "Differential gene expression in pristane-induced arthritis susceptible DA versus resistant E3 rats" potx
Bạn đang xem bản rút gọn của tài liệu. Xem và tải ngay bản đầy đủ của tài liệu tại đây (394.28 KB, 12 trang )
Introduction
In rheumatoid arthritis (RA) the peripheral joints are
attacked by an autoimmune, chronic inflammatory process
[1]. The cause of the disease is not known, but it is influ-
enced by genetic as well as by environmental factors
[2,3]. Despite recent success with new biological thera-
pies, there is no cure for RA and there is no effective
therapy for large groups of patients. It is therefore of great
importance that we improve our understanding of the
genetic basis of the disease as well as of the biological
pathways that are responsible for its pathogenesis.
Recently, new powerful techniques, based on microarrays,
have been developed for analysis of gene expression [4].
These techniques can be used to analyze a large number
of genes simultaneously and, when used for analysis in
suitable experimental circumstances, provide valuable
information on arthritis pathogenesis.
Direct comparison of RA patients with control groups is
difficult because any differential gene expression in RA
may be masked by genetic and/or environmental differ-
ences between individuals. However, animal models of RA
are well suited for analysis of differential gene expression
because it is possible to analyze many individuals in which
genetic background, environmental exposure and disease
stage can be controlled. One animal model with close sim-
ELISA = enzyme-linked immunosorbent assay; FACS = fluorescence activated cell sorting; NK = natural killer; PCR = polymerase chain reaction;
PIA = pristane-induced arthritis; QTL = quantitative trait locus; RA = rheumatoid arthritis.
Available online />Research article
Differential gene expression in pristane-induced arthritis
susceptible DA versus resistant E3 rats
Lena Wester
1
, Dirk Koczan
1
, Jens Holmberg
2
, Peter Olofsson
2
, Hans-Jürgen Thiesen
1
,
Rikard Holmdahl
2
and Saleh Ibrahim
1
1
Institute für Immunologie, Universität Rostock, Rostock, Germany
2
Medical Inflammation Research, Biomedical Center, Lund University, Lund, Sweden
Corresponding author: Lena Wester (e-mail: )
Received: 28 Apr 2003 Revisions requested: 10 Jul 2003 Revisions received: 21 Jul 2003 Accepted: 4 Aug 2003 Published: 2 Oct 2003
Arthritis Res Ther 2003, 5:R361-R372 (DOI 10.1186/ar993)
© 2003 Wester et al., licensee BioMed Central Ltd (Print ISSN 1478-6354; Online ISSN 1478-6362). This is an Open Access article: verbatim
copying and redistribution of this article are permitted in all media for any purpose, provided this notice is preserved along with the article's original
URL.
Abstract
Arthritis susceptibility genes were sought by analysis of
differential gene expression between pristane-induced
arthritis (PIA)-susceptible DA rats and PIA-resistant E3 rats.
Inguinal lymph nodes of naïve animals and animals 8 days
after pristane injection were analyzed for differential gene
expression. mRNA expression was investigated by microarray
and real-time PCR, and protein expression was analyzed by
flow cytometry or ELISA. Twelve genes were significantly
differentially expressed when analyzed by at least two
independent methods, and an additional five genes showed a
strong a tendency toward differential expression. In naïve DA
rats IgE, the bone marrow stromal cell antigen 1 (Bst1) and
the MHC class II β-chain (MhcII) were expressed at a higher
level, and the immunoglobulin kappa chain (Ig
κ
) was
expressed at a lower level. In pristane-treated DA rats the
MHC class II β-chain, gelatinase B (Mmp9) and the protein
tyrosine phosphatase CL100 (Ptpn16) were expressed at a
higher level, whereas immunoglobulins, the CD28 molecule
(Cd28), the mast cell specific protease 1 (Mcpt1), the
carboxylesterase precursor (Ces2), K-cadherin (Cdh6), cyclin
G1 (Ccng1), DNA polymerase IV (Primase) and the tumour
associated glycoprotein E4 (Tage) were expressed at a lower
level. Finally, the differentially expressed mRNA was
confirmed with protein expression for some of the genes. In
conclusion, the results show that animal models are well
suited for reproducible microarray analysis of candidate
genes for arthritis. All genes have functions that are
potentially important for arthritis, and nine of the genes are
located within genomic regions previously associated with
autoimmune disease.
Keywords: arthritis, differential gene expression, microarray, quantitative trait locus, rat
Open Access
R361
R362
Arthritis Research & Therapy Vol 5 No 6 Wester et al.
ilarity to the human disease is pristane-induced arthritis
(PIA) in rats [5]. It is an erosive arthritis that specifically
affects peripheral joints in a symmetrical manner; rheuma-
toid factors are elevated and it develops into a chronic,
relapsing disease. In addition, it is associated with a
strong acute inflammatory response [6] and fragments of
cartilage oligomeric matrix protein are released into blood
as a reflection of joint erosion [7]. Although autoantigens
in PIA, as in RA, have not been identified, the disease is
MHC class II associated, it is dependent on the activation
of αβ T cells and it can be transferred. The DA rat is
100% susceptible to the disease whereas the E3 rat is
resistant. The DA and E3 combination has been exten-
sively analyzed for genetic susceptibility, and many loci
that are linked to various inflammatory diseases have been
identified [8,9]. In both PIA and experimental autoimmune
encephalomyelitis it has been demonstrated that different
loci control different disease subtrates, such as onset,
severity and chronicity.
In the present study, inguinal lymph nodes from the PIA-
susceptible DA rat and from the PIA-resistant E3 strain
were analyzed for differential gene expression using
Affymetrix technology (Affymetrix, Inc., Santa Clara, CA,
USA). Both naïve rats and rats 8 days after pristane
injection were studied. The postinjection time point was
selected at 2–6 days before onset of PIA. The reason for
this was that by then an immune reaction has started but
no secondary effects of disease have yet occurred. The
draining inguinal lymph nodes were chosen because we
believe that they are important in the early phases of
disease. Optimally, microarray analysis should be con-
ducted in isolated populations of cells so that differential
gene expression may be directly correlated with tran-
scription of the genes; however, as discussed elsewhere
[10], in complex diseases such as RA the important cell
types are not known, and therefore analysis of a complex
tissue increases the probability of analyzing differential
gene expression in cells of importance for pathogenesis.
By fluorescence activated cell sorting (FACS) analysis of
the composition of the most important immunological
cell types in the lymph nodes, we attempted to identify
eventually apparent differential expressions caused by
differences in cell numbers. Differential mRNA expres-
sions in the lymph nodes were detected by Affymetrix
and validated by custom-made oligomer glass arrays.
Some of the detected genes were also analyzed by real-
time PCR for confirmation of the microarray results.
Finally, the mRNA expression levels of some of the
genes were correlated with protein expression, which
was determined either by FACS or ELISA. To investigate
further an eventual role of the differentially expressed
genes in arthritis pathogenesis, the genomic locations of
the genes were compared with the locations of previ-
ously reported quantitative trait loci (QTLs) for arthritis
and other autoimmune diseases.
Materials and method
Rats
DA and E3 rat strains (from Zentralinstitut für Versuch-
stierzucht, Hannover, Germany) were kept in the animal
facility of Medical Inflammation Research with 12-hour
light–dark cycles; they were housed in polystyrene cages
containing wood shavings and were fed standard rodent
chow and given free access to water. All experiments
were conducted in male rats aged 8 weeks. The ethics
committee for animal experiments at Lund University
approved all experiments.
Arthritis induction
To induce the immune reaction that leads to arthritis in the
DA rat, 150 µl pristane (2,6,10,14-tetramethylpentade-
cane) was injected intradermally at the base of the tail.
The pristane was purchased from Aldrich (Milwaukee, WI,
USA).
RNA isolation
The inguinal lymph nodes from both sides of untreated
rats and rats 8 days after pristane injection were removed
and stored in RNAlater™ (Ambion, Austin, TX, USA) at
–80°C until homogenization. The homogenate was
phenol:chloroform:isoamylalcohol (Ambion) extracted
before total RNA isolation using the RNeasy kit (Qiagen,
Valencia, CA, USA). The purity and concentration of RNA
was determined by A
260/280
analysis and the RNA quality
was analyzed by agarose gel electrophoresis.
Affymetrix analysis
Total RNA (20 µg/chip) was synthesized to cRNA and
labelled according to GeneChip
®
expression analysis
(technical manual provided by Affymetrix). For pooled
samples, total RNA from six rats was combined before
labelling. Pooled samples were analyzed for naïve rats and
rats 8 days after pristane injection. For the pristane-treated
rats, chips with three individual rats per strain were also
analyzed. The samples were hybridized to the rat genome
chip RG_U34A, and washed and stained according to
protocols indicated by Affymetrix.
Custom-made chip analysis
Custom-made, 50mer oligomer chips were produced by
MWG Biotech AG (Ebersberg, Germany). For selection of
the optimal oligomers, the bioinformatic service of MWG
Biotech AG was used and the oligomers were chosen in
nonpolymorphic regions. Total RNA was labelled by direct
incorporation of Cy3 or Cy5 during cDNA synthesis.
Briefly, 40 µg total RNA from naïve animals and 50 µg
from pristane-treated animals were pre-annealed with a
poly dT primer, mixed with reverse transcriptase, deoxy-
nucleotides, RNase inhibitors and dUTP-Cy3 or dUTP-
Cy5. After labelling, the RNA was hydrolyzed and the Cy3
and Cy5 labelled probes were washed, combined and
hybridized to the chips according to the MWG Biotech
R363
AG manual ( The hybridized
chips were scanned in a laser confocal scanner (Virtek
ChipReader™, Waterloo, Ontario, Canada). Five individual
DA rats were compared with a pool of five E3 rats. For each
comparison, a dye-swap experiment was done.
Taqman analysis
To examine the reliability of the microarray method, a selec-
tion of five genes, differentially expressed according to
Affymetrix, were selected for Taqman analysis (Applied
Biosystems, Foster City, CA, USA). The genes chosen were
as follows: Primase, Ccng1, Ig rearranged γ-chain variable
region, Mmp9 and Bst1. Primers and Taqman probes were
chosen by the Primer Express
TM
1.5 software (PE Applied
Biosystems, CA, USA) and synthesized by PE Applied
Biosystems. The probes were FAM6/TAMRA labelled. Five
animals from each group were analyzed individually.
Flow cytometry analysis
The cell type composition and level of protein expression
for some genes in the inguinal lymph nodes were analyzed
by flow cytometry. Single cell suspensions were washed
and stained for various phenotypes using FITC, PE, or
biotinylated conjugated mouse antirat monoclonal antibod-
ies purchased from Pharmingen (San Diego, CA, USA),
American Type Culture Collection (Manassas, VA, USA)
and kindly donated by Dr Torres-Nagel (Institute for Virol-
ogy and Immunobiology, University of Wurzburg,
Germany). The lymph nodes were analyzed for the total
numbers of leucocytes (OX-1
+
), granulocytes (HIS48
+
), B
cells (OX-33
+
), αβ T cells (R73
+
), CD4
+
cells of αβ T cells
(OX-35
+
gated on R73
+
), CD8
+
cells of αβ T cells (OX8
+
gated on R73
+
), γδ T cells (V65
+
, OX-19
+
), NK cells
(3.2.3
+
, R73
–
) and NK T cells (3.2.3
+
, R73
+
). The differen-
tial geometric mean values were analyzed for RT1.B (OX-
6
+
), RT1.D (OX-17
+
), CD28 (JJ319
+
), B7.2 (24F
+
),
CD45RC (OX-22
+
), anti-IgM (MAR18.5
+
) and interferon-γ
(DB-1). Acquisition was made using FACSort (Becton
Dickinson, Franklin Lakes, NJ, USA), using the BD Cell-
Quest
TM
Pro, Version 4.0.1 software (Becton Dickinson).
Three individuals per time point and strain were analyzed.
Enzyme-linked immunosorbent assay analysis
The concentration of total IgG, total IgM and total IgE in
plasma from DA and E3 rats on days 0 and 8 after pris-
tane injection were analyzed by ELISA. Plasma from
heparinized blood were separated by centrifugation and
stored at –20°C until analysis. Total IgG and IgM were
analyzed by coating with 5 µg/ml purified goat antirat IgG
(Southern Biotechnology Associates Inc., Birmingham, AL,
USA) or mouse antirat IgM (Pharmingen), followed by
incubation with 10,000 × diluted plasma, secondary per-
oxidase conjugated goat antirat IgG or IgM (Jackson
ImmunoResearch Inc., West Grove, PA, USA) and sub-
strate ABTS
®
tablets (Roche Diagnostics GmbH,
Mannheim, Germany). The total IgE ELISA followed the
main protocol; plates were coated with 5 µg/ml mouse
antirat IgE (Pharmingen), followed by incubation with
6000 × diluted plasma, 2 µg/ml biotin conjugated mouse
antirat IgE secondary antibody (Pharmingen), extravidin-
peroxidase and substrate incubation. The ELISA findings
were analyzed in a Titertek Multiskan
®
Plus ELISA plate
reader (Molecular Devices Corporation, Sunnyvale, CA,
USA) at 405 nm. Four rats per group were analyzed and
all ELISA samples were run in duplicate.
Statistical analysis
The Affymetrix data were analyzed by the Microarray Suit
Software Version 4.0. To normalize the chips the global
scaling option was used. Statistical analysis of individual
animal per strain chips was done using the dChip soft-
ware [11]. The probe sets were sorted by the absolute t-
statistic. The custom-made chips data were analyzed
using the ImaGene
TM
software (BioDiscovery Inc., Los
Angeles, CA, USA). The data were processed using the
‘local background subtraction’ and normalized using the
‘all spot’ option. The signal for each gene was calculated
as the average signal of each spot of the three oligomers
from both dye-swap chips. The mean signal from the five
individual DA rats was divided by the corresponding E3
pool signal. These ratios were tested by one group t-test
using the null hypothesis that the DA/E3 ratio was equal
to one (i.e. no difference). Statistical analysis on the
Taqman findings was done by comparison of the two
groups of individual DA and E3 rats using Mann–Whitney
U-test. Statistical analysis of the flow cytometry data was
done by analysis of the cell numbers and expression of
certain molecules between the groups of individual DA
and E3 rats using Mann–Whitney U-test. Statistical analy-
sis of the immunoglobulin ELISAs was done by calculating
the average of the ELISA duplicates and analyzing these
values between the individuals in the DA and E3 groups
by Mann–Whitney U-test. For statistical analysis, the
StatView software was used (SAS Institute Inc., Cary, NC,
USA).
Differentially expressed genes: quantitative trait locus
association
The mapping of the differentially expressed genes to QTLs
for autoimmune disease was investigated. The genomic
location of the genes were searched for using Map Viewer
( />chr=rat.inf). The genomic positions were compared with
reported positions of QTLs for arthritis and multiple sclero-
sis using RatQTL ( />Results
Cell composition of the inguinal lymph nodes of the DA
and E3 rat strains.
To distinguish between true differential gene expression
and apparent differential gene expression caused by dif-
ference in cell numbers, the cell compositions of the
Available online />inguinal lymph nodes from the DA and E3 rats were inves-
tigated by flow cytometry. Several interesting differences
between the DA and E3 rats were found (Table 1). In
naïve rats (day 0), the number of granulocytes and NK T
cells was significantly lower in the DA rats than in the E3
rats. Furthermore, the number of αβ T cells was signifi-
cantly higher in the DA rats. These cells were probably
CD4
+
cells because this number was higher in the DA rat
whereas no difference could be detected in the numbers
of CD8
+
T cells. Also, a marginally lower number of γδ T
cells were detected in DA rats. Eight days after pristane
injection, the numbers of NK T cells and γδ T cells were
significantly lower in the DA rats than in the E3 rats, but
the most striking difference in cell composition was the
markedly lower number of B cells in DA rats 8 days after
pristane injection. The low number of B cells contributed
to the general lower level of immunoglobulin gene expres-
sion in the DA rats 8 days after pristane injection (see
below), but no other clearcut correlation was observed
between cell numbers and differential gene expression.
Experimental design
First, the mRNA expression was analyzed by Affymetrix in
pooled samples of naïve animals, and in both pooled and
individual samples for pristane-treated rats. However, the
results from the pooled and individual samples of pristane-
treated animals were not regarded as independent obser-
vations because the biological samples were partly the
same. An independent method, employing custom-made
oligomer glass chips, was used to confirm the differential
mRNA expression of both naïve and pristane-treated
animals. In these custom-made chips there were spotted
oligomers for 170 genes, which had been found to be dif-
ferentially expressed in various Affymetrix analyses or were
regarded as potentially interesting for arthritis. (For the
complete list of genes on these chips, see Additional file
5.) Sequences of the selected oligomers are available on
request from the corresponding author.
All annotated genes differentially expressed with a change
greater than threefold in the pristane-treated rats and
approximately half of the genes differentially expressed in
the naïve rats were represented on the chips. The chips
were used to analyze individual DA rats and compare them
with a pool of E3 rats. For the pristane-treated rats a
selection of five genes was also analyzed by real-time
PCR. The differential mRNA expression of some genes of
interest was compared with the expression of the
encoded protein using either FACS or ELISA. The statistic
significance threshold values for differential expression
with the individual methods were set as follows: Affymetrix
pooled samples, fold change >3.0; Affymetrix individual
samples (among the 30 most probably differentially
expressed genes), t-test P < 0.002; and custom-made
chips, real time PCR, FACS and ELISA, P < 0.05. To be
regarded as differentially expressed between the DA and
E3 rat, a gene should differ in the same direction between
two different biological samples (taken at two time points)
when analyzed by at least two different methods. These
genes are denoted ‘S’ in the Tables 3 and 4. An additional
set of genes showed a strong tendency toward differential
expression. These genes were differentially expressed in
two biological samples and fulfilled the threshold values
for significance for one method and fulfilled the following
threshold value for at least one additional method: pooled
sample Affymetrix fold change values, >1.9; Affymetrix
Arthritis Research & Therapy Vol 5 No 6 Wester et al.
R364
Table 1
Total number of cells in lymph nodes in DA and E3 naïve rats and rats 8 days after pristane injection
Total cell number (millions)
Difference between Difference between
Cell type DA day 0* E3 day 0* DA and E3 on day 0** DA day 8 E3 day 8 DA and E3 on day 8**
Leucocytes 10 ± 1.5 8 ± 0.79 NC, P < 0.1 27 ± 3.6 45 ± 21 NC, P < 0.3
Granulocytes 0.034 ± 0.01 0.052 ± 0.01 D, P < 0.04 0.48 ± 0.14 0.92 ± 0.62 NC, P < 0.5
B cells 1.8 ± 0.64 2.3 ± 0.29 NC, P < 0.25 6.3 ± 1.2 24 ± 13 D, P < 0.03
αβ T cells 7.9 ± 0.7 5.4 ± 0.3 I, P < 0.02 20 ± 1.3 19 ± 2.8 NC, P < 1
CD4
+
/αβ T cells 6.2 ± 0.5 4.3 ± 0.2 MI, P < 0.08 14 ± 0.9 13 ± 1.7 NC, P < 0.3
CD8
+
/αβ T cells 2.2 ± 0.2 1.7 ± 0.1 NC, P < 0.2 6.1 ± 0.7 7.5 ± 1.4 NC, P < 0.3
γδ T cells 0.024 ± 0.013 0.038 ± 0.0086 MD, P < 0.1 0.048 ± 0.018 0.24 ± 0.16 D, P < 0.03
NK cells 0.095 ± 0.034 0.12 ± 0.01 NC, P < 0.4 0.46 ± 0.07 1.51 ± 1.0 NC, P < 0.2
NK T cells 0.054 ± 0.019 0.12 ± 0.024 D, P < 0.02 0.19 ± 0.035 2 ± 1.2 D, P < 0.03
*Mean total cell number (in millions) ± standard deviation (SD) determined by fluorescence activated cell sorting (FACS) analysis. Data based on
three DA and E3 naïve rats and three DA and E3 rats 8 days after pristane injection. **Difference in cell number: DA versus E3. P values calculated
by Mann–Whitney nonparametric test. D, decrease; I, increase; MD, marginally decrease; MI, marginally increase; NC, no change.
individual samples (among the 30 most probably differen-
tially expressed genes), t-test P < 0.002; and custom-
made chip, real-time PCR, FACS and ELISA, P < 0.1.
These genes are denoted ‘T’ in Tables 3 and 4.
Differential gene expression between naïve DA and E3
rats
The differential mRNA expressions between naïve DA and
E3 rats were analyzed and compared with protein cell
surface expression or plasma protein levels. The numbers
of statistically significant differentially expressed genes for
the individual methods are indicated in Table 2. (The com-
plete lists of genes are provided in Additional files 1, 6, 8
and 9.) Genes that were differentially expressed in two dif-
ferent biological samples of naïve rats, as observed using
at least two independent methods, and fulfilling the thresh-
old values for the ‘S’ group and ‘T’ group’, as defined
above, are shown in Table 3.
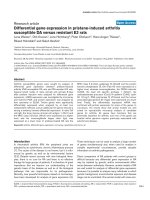
Only one gene, namely the IgM κ-chain variable region,
exhibited significantly lower expression in DA rats. In addi-
tion, one gene – the IgE heavy chain – was significantly
highly expressed in the DA rat, and the MHC class II
antigen RT1.B β-chain and Bst1 showed a strong ten-
dency toward higher expression. FACS analyses confirmed
the higher expression of MHC class II antigen RT1.B β-
chain in the DA rat, but failed to confirm the differential
expression of the κ-chain (Table 3, Fig. 1). Furthermore, it
was interesting to note that, although lymph nodes are not
the main source for immunoglobulin secretion into plasma,
the differential expression of IgE was reflected in the secre-
tion of IgE into plasma (Table 3, Fig. 1).
Differential gene expression between DA and E3 rats
8 days after pristane injection
The differential mRNA expressions between DA and E3
rats 8 days after pristane injection were analyzed and
compared with cell surface expression of some proteins
and secretion of immunoglobulins into plasma. mRNA
expression was analyzed by Affymetrix, custom-made
chips and real-time PCR for a selection of genes. The
protein expressions of cell surface molecules and the
plasma concentrations of immunoglobulins were analyzed
using FACS and ELISA. The numbers of significantly dif-
ferentially expressed genes for the individual methods are
indicated in Table 2. (The complete lists of genes are pro-
vided in Additional files 2–4 and 7–9.) Genes that were
differentially expressed in two different biological samples
of pristane-treated rats, as observed using at least two
independent methods, and fulfilling the threshold values
for the ‘S’ group and ‘T’ group, as defined above, are
shown in Table 4.
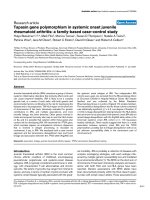
One gene, namely the MHC class II RT1.B β-chain
(MhcII), had significantly higher expression in the DA rat
using the X56596 oligomer sets in Affymetrix; two addi-
tional genes – the gelatinase B (Mmp9) and the CL100
protein tyrosine phosphatase (Ptpn16) genes – exhibited
a strong tendency toward higher expression. For the MHC
class II RT1.B β-chain, Affymetrix analysis yielded a contra-
dictory result when the ‘U65217_i_at’ probe set was
used. Affymetrix indicated a highly significant lower
expression in the DA rat than in the E3 rat, with unrealistic
fold change values, whereas custom-made chips and
FACS data indicated a higher expression (Table 4, Fig. 2).
The reason for this was an unfortunate placement of the
‘U65217_i_at’ oligomers in a highly polymorphic part of
the MHC gene (see below), and therefore only findings
with the ‘X56596_at’ set were regarded as reliable. Fur-
thermore, a number of genes were found to have signifi-
cantly lower expression in the DA rat: six immunoglobulin
genes, the costimulatory molecule Cd28, mast cell pro-
tease 1 (Mcpt1), K-cadherin (Cdh6), the carboxylesterase
precursor (Ces2), and the cell cycle related genes cyclin
Available online />R365
Table 2
The number of statistically significant differentially expressed genes in naïve and pristane-treated rats according to the individual
methods
Higher in Lower in Higher in Lower in
Method naïve DA rats naïve DA rats pristane-treated DA rats pristane-treated DA rats
Affymetrix (pooled samples) 15 (8800) 24 (8800) 38 (8800) 65 (8800)
Custom-made chips 19 (170) 2 (170) 2 (170) 23 (170)
Real-time PCR 0 0 0 (5) 3 (5)
FACS 4 (7) 3 (7) 3 (7) 2 (7)
ELISA Total IgE and IgM (3) 0 (3) Total IgM (3) Total IgG (3)
To be regarded as differentially expressed with statistical significance, a gene had to fulfil the following threshold values: Affymetrix (pooled
samples), differentially expressed with a fold change >3.0; custom-made oligomer glass chips, differentially expressed with one group t-test P <
0.05; real time PCR, differential expression with Mann–Whitney P < 0.05; FACS, differential geometric mean values with a Mann–Whitney P <
0.05; ELISA, differential plasma concentrations with a Mann–Whitney P < 0.05. The values within parenthesis represent the total number of genes
analyzed using the method. ELISA, enzyme linked immunosorbent assay; FACS, fluorescence activated cell sorting.
G (Ccng1) and Primase. One more gene, the tumour-
associated glycoprotein E4 gene (Tage), showed a ten-
dency toward lower expression in the DA rat. The lower
mRNA expression of immunoglobulins was reflected in
plasma as a significantly lower total IgG concentration and
a tendency toward lower IgE concentration (Table 4,
Fig. 2), and flow cytometry confirmed the lower expression
of Cd28. The lower expression level of immunoglobulins
Arthritis Research & Therapy Vol 5 No 6 Wester et al.
R366
Table 3
Genes differentially expressed in naïve (day 0) DA versus E3 rats
Accession no. Gene ID Significance Affymetrix Custom-made FACS ELISA
Upregulated
X56596 MHC class II antigen RT1.B-1 β-chain (MhcII)T I (56.8) NC I (1.2); ND
P < 0.08
X00923 IgE heavy chain (Ig
ε
)SI (3.6) I (1.9); ND I (1.4);
P < 0.1 P < 0.05
D49955 Bone marrow stromal cell antigen 1 (Bst1)TI (3.7) I (2.0); ND ND
P < 0.1
Downregulated
S81289 IgM κ chain variable region S D (–3.6) D (–1.6); NC ND
(CDR1 to CDR3 region; Ig
κ
) P < 0.0005
To be regarded as differentially expressed a gene must be differentially expressed in two biological samples analyzed by a minimum of two
independent methods. Differential expression values in bold text are statistically significant by that particular method. Genes significantly
differentially expressed by a minimum of two independent methods are denoted ‘S’. Another subset of genes showed a strong tendency toward
differential expression; these are denoted ‘T’. ELISA, enzyme linked immunosorbent assay; FACS, fluorescence activated cell sorting; NC, no
change (for these genes, no statistically significant differential expression could be shown); ND, not determined.
Figure 1
Differential expression of some proteins between naïve DA and E3 rats was investigated by fluorescence activated cell sorting (FACS) or ELISA.
Differential κ-chain and MHC class II RT1.B expression was investigated using FACS. Inguinal lymph node cells from three DA and E3 rats were
stained with anti-Igκ or OX-6 and analyzed on FACSort using the BD CellQuest™Pro Version 4.0.1 software (Becton Dickinson, Franklin Lakes, NJ,
USA). In the histogram, the black peak represents the negative control, the filled grey peak the DA rats, and the unfilled peak the E3 rats. The
horizontal line represent the area used for calculation of the geometric mean values. In the histogram the κ-chain and RT1.B expression of the DA
and E3 rats with individual values closest to the group mean value are shown. The total plasma concentration of IgE was analyzed by ELISA.
Plasma samples from four DA and E3 rats were analyzed. The data are presented as DA and E3 mean values, and the error bars represent the
standard error of the mean.
was most likely caused by the decreased number of B
cells in the DA rat as compared with the E3 rat (Table 1).
Sequence alignment revealed problems with Affymetrix
oligomer set
A discrepancy between Affymetrix and custom-made chip
data for the MHC class II RT1.B β-chain and some other
genes of immunological importance was observed. For the
MHC class II RT1.B β-chain a simple but intriguing expla-
nation was identified. The MHC, like many key genes of
the immune system, is polymorphic; the DA rat is of the a-
haplotype and the E3 rat is of the u-haplotype. To investi-
gate the cause of the contradictory data observed for the
MHC, careful sequence alignments were made. The
Affymetrix and custom-made chip oligomer sets for
U65217 (u-haplotype) and X56596 (l-haplotype) were
aligned to the U65217, X56596 and the a-haplotype exon
2 (M76780) sequences. This revealed that the Affymetrix
oligomers for the U65217 gene were all placed in the
same region, covering a total of 44 bases. In this area
there is a high degree of polymorphism between different
haplotypes, making it unlikely that U65217 (u-haplotype)
would also bind a-haplotype coded RNA. Accordingly, this
would give the false result of a much lower expression of
the MHC class II RT1.B β-chain in the DA rat than in the
E3 rat. On the other hand, the Affymetrix oligomers for
X56596 were spread out, covering 150 bases in a basi-
cally nonoverlapping manner, and the custom-made chip
oligomer sets were placed so that at least two oligomers
per gene were not overlapping. Accordingly, these
oligomer sets are less sensitive to polymorphism and more
likely to provide reliable results.
Differentially expressed genes: quantitative trait locus
association
Thirteen unique genes fulfilled the threshold values for sig-
nificance of differential expression or showed a strong ten-
dency toward being differentially expressed. To further
investigate the possibility that these genes play a vital role
in arthritis pathogenesis, their genomic locations were
compared with those of rat QTLs that have been reported
to be associated with arthritis (PIA, collagen-induced
arthritis, adjuvant-induced arthritis and oil-induced arthritis,
anticollagen antibody titres), and experimental allergic
encephalomyelitis. Interestingly, nine of the genes were
found to be located within autoimmune disease QTLs, as
identified previously in various rat crosses (Fig. 3). Four
genes are within PIA QTLs: MhcII (the Pia1/Eae1/
Aia1/Cia1/Ciaa1 locus [8,9,12,13]), the immunoglobulin
heavy chain (the Pia3/Eae9 locus [8,9]), the immuno-
Available online />R367
Figure 2
Differential expression of some proteins between pristane-treated DA and E3 rats was investigated by fluorescence activated cell sorting (FACS)
or ELISA. Differential MHC class II RT1.B and Cd28 expression was investigated using FACS. Inguinal lymph node cells from three DA and E3 rats
were stained with OX-6 or JJ319 and analyzed on FACSort using the BD CellQuest™Pro Version 4.0.1 software (Becton Dickinson, Franklin
Lakes, NJ, USA). In the histogram the black peak represents the negative control, the filled grey peak the DA rats, and the unfilled peak the E3 rats.
The horizontal line represent the area used for calculation of the geometric mean values. In the histogram the RT1.B and Cd28 expression of the
DA and E3 rats with individual values closest to the group mean value are shown. The total plasma concentration of IgG and IgE was analyzed by
ELISA. Plasma samples from four DA and E3 rats were analyzed. The data are presented as DA and E3 mean values and the error bars represent
the standard error of the mean.
globulin κ-chain (the Pia5/Pia7/Cia13/Ciaa4/Cia3/Aia3
locus [8,12–16]) and Bst1 (the Piax locus [17]). In addi-
tion, five more genes (Tage, Ces2, Cd28, Ptpn16 and
Ccng1) are mapped to QTLs of other autoimmune
disease models (the Cia2 [13], Eae6 [9], Ciaa3 [15],
Cia16/Eae3 [16,18] and Aia5 [19] loci, respectively).
Discussion
By using microarray and real-time PCR, we investigated
differential gene expression in the draining inguinal lymph
nodes between the arthritis-susceptible DA and arthritis-
resistant E3 rats before and after pristane injection. This
resulted in a list of 17 (13 different) genes that were differ-
Arthritis Research & Therapy Vol 5 No 6 Wester et al.
R368
Table 4
Genes differentially expressed in DA versus E3 rats 8 days after pristane injection
Affymetrix
Accession no. Gene ID Significance Pooled Individual Taqman Custom-made FACS
Upregulated
X56596 MHC class I antigen RT1.B-1 β-chain (MhcII)SI (47.4) I (43.4); ND I (2.8); I (1.9);
P < 0.0001 P < 0.1 P < 0.03
U24441 Metalloproteinase 9 (Mmp9)TI (5) I (1.5); I (1.9); NC
‡
ND
P < 0.001 P < 0.08
S81478 CL100 protein tyrosine phosphatase (Ptpn16) T I (2.4) NC* ND I (1.6); ND
P < 0.02
Downregulated
L07399 (Hybridoma 56R-7) immunoglobulin rearranged S D (–6.4) NC* ND D (–2.0); ND
γ-chain variable (Ig
γ
) P < 0.02
L07401 (Hybridoma 57R-1) immunoglobulin rearranged S D (–62.4) NC* D (–2.1); NC
‡
ND
γ-chain variable (Ig
γ
) P < 0.03
M14434 Immunoglobulin active κ-chain VJC region from S D (–34.7) NC* ND D (–1.9); ND
immunocytoma IR2 (Ig
κ
) P < 0.003
X00923 IgE heavy chain (Ig
ε
)SD (–28) NC* ND D (–2.0); ND
P < 0.05
S81289 IgM κ-chain variable (Ig
κ
)SD (–9.3) NC* ND D (–2.5); ND
P < 0.0003
M15402 Immunoglobulin active κ-chain VJ region from S D (–3.9) NC* ND D (–3.0); ND
immunocytoma IR162 (Ig
κ
) P < 0.006
nm_013121 CD28 (Cd28) S NC NC* ND D (–2.2); D (–9.8);
P < 0.01 P < 0.03
S69206 Mast cell protease 1 (Mcpt1)SD (–4.7) NC* ND D (–2.1); ND
P < 0.002
AB010635 Carboxylesterase precursor (Ces2)SD (–4.1) NC* ND D (–2.5) ; ND
P < 0.003
D25290 K-cadherin (Cdh6)SD (–4.1) NC* ND D (–1.7) ; ND
P < 0.01
X70871 Cyclin G
1
(Ccng1)SD (–9.6) D (–4.8); D
†
NC
‡
ND
P < 0.001
AJ011608 DNA polymerase α-subunit IV (Primase)SD (–3.3) D (–2.6); D (–3.5); NC
‡
ND
P < 0.001 P < 0.03
L12025 Tumour-associated glycoprotein E
4
(Tage)TD (–3.1) NC* ND D (–1.8); ND
P < 0.1
To be regarded as differentially expressed a gene must be differentially expressed in two biological samples analyzed by a minimum of two
independent methods. Differential expression values in bold text are statistically significant by that particular method. Genes significantly
differentially expressed by a minimum of two independent methods are denoted ‘S’. Another subset of genes showed a strong tendency toward
differential expression; these are denoted ‘T’. FACS, fluorescence activated cell sorting; NC, no change; ND, not determined. *These genes were
not included among the 30 genes with highest probability of differential expression (t-test P < 0.002).
†
This gene was only detectable in the E3 rat.
‡
For these genes, no statistically significant differential expression could be shown.
entially expressed or exhibited a strong tendency toward
being so in at least two different biological samples ana-
lyzed using at least two independent methods. In order to
produce reliable data, we conducted an initial scan with
Affymetrix followed by statistical analysis and confirmation
of the data with independent custom-made chips. Alterna-
tively, statistical analysis could have been conducted by
running a large number of Affymetrix chips, but this
approach is rather expensive and would not have excluded
artefacts such as those illustrated by the MHC class II
gene example. In addition, Affymetrix often appears to
yield unrealistic fold change values, which may be caused
by an unfortunate placement of oligomers and/or the algo-
rithm for calculating them. Custom-made chips, on the
other hand, give more realistic fold change values and are
not likely to produce the same artefacts because the
selection of oligomers, labelling and scanning procedures
are independent of Affymetrix. Accordingly, a strategy in
which Affymetrix and custom-made chips are used in com-
bination is likely to produce more reliable data than when
either technique is used alone. In addition, real-time PCR
was used to confirm the microarray data for a few genes.
Clearly, this approach employing several methods dimin-
ishes the number of differentially expressed genes, but it is
more likely to result in a list of genes that are truly differen-
tially expressed. Efficient exclusion of false positives early
in the process saves time and effort later.
The cell composition of the inguinal lymph nodes was ana-
lyzed to determine whether an apparent differential expres-
sion was caused by differential gene transcription or by an
altered cell number. A strain dependent difference in a few
cell types was observed in naïve rats. The DA rats had
more αβ T cells than did the E3 rats, and had fewer granu-
locytes and NK T cells. By comparing the cell compositions
of pristane-treated and naïve rats, several interesting con-
clusions could be made. The differences in numbers of
some cell types (e.g. the NK T cells and γδ T cells) became
more pronounced in pristane-treated rats. For other cell
types (e.g. granulocytes and CD4
+
αβ T cells) the differ-
ence in cell number had disappeared after pristane treat-
ment, and for B cells a huge difference in number of B cells
became apparent. The large differences in cell composi-
tions of inguinal lymph nodes between naïve and pristane-
treated rats argues for an important role for this tissue in
the early events that take place after pristane challenge.
Furthermore, the differential cell composition between the
DA and E3 rats is interesting per se and highlights ongoing
mechanisms. The disappearing difference in CD4
+
αβ T
cells is interesting because these cells are believed to play
an important role in both adjuvant arthritis and RA [20–22].
The more pronounced difference in number of NK T cells
and γδ T cells is in agreement with data from oil-induced
arthritis resistant and susceptible rat strains [23]. Finally,
the large difference in B cells between pristane-treated DA
and E3 rats is highly interesting. Clearly, the E3 rat
responds to pristane challenge with a substantial increase
in the number of B cells; this reaction is much smaller in
the DA rat. What consequences this will have for the rat’s
ability to counteract an arthritic inflammation is yet
unknown and should be further investigated.
The differential gene expression of naïve rats is strain
dependent and not necessarily related to arthritis.
However, the MHC class II molecule has a huge record of
correlation with arthritis [24,25], and a high density of this
molecule on blood cells in early RA leads to greater
disease activity later [26]. In addition, MHC haplotypes
associated with RA are more densely expressed on the
Available online />R369
Figure 3
Thirteen genes were found to be differentially expressed between the
DA and E3 rats before and/or 8 days after pristane injection. The
genomic location of these genes (found using Map Viewer:
was
mapped to various quantitative trait loci (QTLs) for autoimmune
disease found in rat crosses. The figure shows QTLs on the same
chromosome as the differentially expressed genes. The position of the
flanks of the QTLs reported in ratQTL ( />were used to set the borders.
cell surface than haplotypes that are not associated [26].
Our data indicate that this is also true for the rat. The other
genes that are expressed to a greater degree in naïve DA
rat than in E3 rat, namely Bst1 and IgE, are not expressed
to a higher degree in pristane-treated DA rats. The change
in expression pattern indicates an involvement in arthrito-
genic mechanisms. The Bst1 molecule may be involved in
the same mechanism as the recently cloned arthritis con-
trolling gene Ncf1 [27] because it supports NADPH
oxidase catalyzed superoxide generation [28], among
several other interesting functions. In addition, a higher
expression of Bst1 has been associated with severe RA in
patients [29]. The lower expression of the immunoglobulin
κ-chain in naïve animals could reflect a marginally lower B
cell number between naïve rats, but this is not in agree-
ment with a higher IgE mRNA and protein expression.
All molecules, except for the MHC class II RT1.B β-chain,
that were found to be differentially expressed between
pristane-treated DA and E3 rats were not differentially
expressed between naïve rats. This strongly argues for
that they are involved in the different responses of the two
strains to pristane injection, which results in arthritis in the
DA rat but not in the E3 rat. It is therefore tempting to
speculate on their potential role in the early events that
lead to arthritis.
Two genes, in addition to MHC, were expressed at a
higher level in the pristane-treated DA rats, Mmp9 and
Ptpn16. Mmp9 is a granulocyte-secreted type IV collage-
nase and Ptpn16 is induced by oxidative stress and
inflammation [30,31] to act as a negative feedback regula-
tor of mitogen-activated protein kinases [32]. Mmp9 has
the potential to promote arthritis in many ways and its role
in early autoimmune disease is supported by Mmp9
knockout mice, which show less susceptibility to experi-
mental autoimmune encephalomyelitis [33]. The higher
expression of the Ptpn16 gene, instead of directly promot-
ing arthritis, could represent an unsuccessful attempt by
the DA rat to switch off the pristane-induced reaction.
The largest group of differentially expressed genes in pris-
tane-treated rats were expressed at a lower level in the DA
rat. Several of the genes are intimately associated with an
active immune defence, which indicates that the arthritis
resistance of the E3 rat is not caused by lack of response
but rather by a strong immune reaction against insults
such as pristane that protects the body from autoimmune
disease. The large difference in B cell numbers, and sub-
sequent immunoglobulin expression, indicates that the
response is B cell mediated, and several of the differen-
tially expressed genes can provide clues as to the path-
ways involved. The Cd28 molecule, as a costimulator of T
cells, may be essential for the (protective) B cell response
of the E3 rat. Interestingly, this molecule has also been
found to be downregulated in RA patients [34]. The lower
expression of Mcpt1 [35] supports recent observations
that mast cells are important for arthritis. Interestingly, at
least two subgroups of mast cells with different roles in
arthritis have been identified, and these subgroups are
distinguished by their differential Mcpt1 expression [36].
The adhesion between immune cells also appears to be
important for the process because the cell adhesion mole-
cule Cdh6 [37] is expressed to a lower degree in the DA
rat. In addition to a direct association with the immune
system, a differential regulation of apoptosis between the
DA and E3 rat is indicated because Ccng1 is differentially
expressed. Ccng1 has been suggested as a negative
feedback regulator of p53 [38], and therefore lower
expression of Ccng1 in the DA rat would lead to more
apoptosis in the lymph nodes just before arthritis onset.
This stands in contradiction to observations in chronically
inflamed synovium in which defective apoptosis was sug-
gested to drive the inflammation [39]. The exact role
played by Ccng1 in the cell cycle and various phases of
arthritis must therefore be further investigated. Finally, the
lower expression of a carboxylesterase in the DA rat may
reflect another interesting issue – a defective drug and
lipid metabolizing system. A defect in such a system
would lead to an impaired ability to handle lipophilic,
potentially harmful substances, which may lead to devel-
opment of arthritis. If this turns out to be true, then it will
nicely reflect how genetic and environmental factors inter-
act in diseases such as arthritis.
Finally, 9 out of 13 identified candidate genes were
mapped to genomic regions previously reported to be
QTLs for autoimmune diseases. Although it is premature
to suggest that the nine genes are candidate genes for
these QTLs, the data indicate that gene expression profil-
ing will be useful to assist in cloning of genes from QTLs.
Most of the QTLs were isolated in congenic strains
[40–45] and work is ongoing to clone the genes position-
ally. Gene expression profiling will clearly speed up the
cloning of genes by assisting in selection of recombinants,
and will give additional valuable information regarding the
pathways in which the genes are operating.
Conclusion
We showed that a rather simple microarray analysis is
useful in identifying interesting pathways and candidate
genes that operate early in animal models of arthritis.
Several of the identified genes could be mapped to QTLs,
and therefore microarray analysis may be a valuable tool
for cloning arthritis controlling genes and improving our
understanding of their biological pathways. Therefore,
microarray analysis of animal models has the potential to
significantly improve our understanding of arthritis patho-
genesis and contribute to better treatment of RA.
Competing interests
None declared.
Arthritis Research & Therapy Vol 5 No 6 Wester et al.
R370
Additional files
Acknowledgement
The authors wish to acknowledge Mrs Toth at the Department of
Immunology in Rostock for technical assistance, the animal personnel
at the animal facilities in Medical Inflammation Research in Lund, and
Dr Ingemar Berglund at Arexis for sharing his expertise on Affymetrix
analysis. This work was supported by grants from EU (EUROME
QLG1-CT2001-01407) and Trygg Hansa, The Swedish Rheumatism
Association, the Foundations of Crafoord, Professor Nanna Svartz,
Nilsson-Ehle and King Gustaf V’s 80-year Foundation. Dr Lena Wester
is supported by a Marie Curie Fellowship (MCFH-1999-0130).
References
1. Lee DM, Weinblatt ME: Rheumatoid arthritis. Lancet 2001, 358:
903-911.
2. Silman AJ, MacGregor AJ, Thomson W, Holligan S, Carthy D,
Farhan A, Ollier WE: Twin concordance rates for rheumatoid
arthrtis: results from a nationwide study. Br J Rheumatol 1993,
32:903-907.
3. Aho K, Koskenvuo M, Tuominen J, Kaprio J: Occurrence of
rheumatoid arthritis in a nationwide series of twins. J Rheuma-
tol 1986,13:899-902.
4. Duggan DJ, Bittner M, Chen Y, Meltzer P, Trent JM: Expression
profiling using cDNA microarrays. Nat Genet 1999, 21:10-14.
5. Vingsbo C, Sahlstrand P, Brun JG, Jonsson R, Saxne T, Holmdahl
R: Pristane-induced arthritis in rats: a new model for rheuma-
toid arthritis with a chronic disease course influenced by both
major histocompatibility complex and non-major histocom-
patibility complex genes. Am J Pathol 1996,149:1675-1683.
6. Olofsson P, Nordquist N, Vingsbo-Lundberg C, Larsso, A, Falken-
berg C, Pettersson U, Åkerström B, Holmdahl R: Genetic links
between the acute-phase response and arthritis development
in rats. Arthritis Rheum 2002,46:259-268.
7. Vingsbo-Lundberg C, Saxne T, Olsson H, Holmdahl R: Increased
serum levels of cartilage oligomeric matrix protein in chronic
erosive arthritis in rats. Arthritis Rheum 1998,41:544-550.
8. Vingsbo-Lundberg C, Nordquist N, Olofsson P, Sundvall M, Saxne
T, Pettersson U, Holmdahl R: Genetic control of arthritis onset,
severity and chronicity in a model for rheumatoid arthritis in
rats. Nat Genet 1998, 20:401-404.
9. Bergsteinsdottir K, Yang HT, Pettersson U, Holmdahl R: Evi-
dence for common autoimmune disease genes controlling
onset, severity, and chronicity based on experimental models
for multiple sclerosis and rheumatoid arthritis. J Immunol
2000, 164:1564-1568.
10. Eaves IA, Wicker LS, Ghandour G, Lyons P, Peterson LB, Todd JA,
Glynne RJ: Combining mouse congenic strains and microarray
gene expression analyses to study a complex trait: the NOD
model of type 1 diabetes. Genome Res 2002, 12:232-243.
11. Li C, Wong WH: Model-based analysis of oligonucleotide
arrays: expression index computation and outlier detection.
Proc Natl Acad Sci USA 2001, 98:31-36.
12. Kawahito Y, Cannon GW, Gulko PS, Remmers EF, Longman RE,
Reese VR, Wang J, Griffiths MM, Wilder RL: Localization of
quantitative trait loci regulating adjuvant-induced arthritis in
rats: evidence for genetic factors common to multiple autoim-
mune diseases. J Immunol 1998, 161:4411-4419.
13. Remmers EF, Longman RE, Du Y, O’Hare A, Cannon GW, Grif-
fiths MM, Wilder RL: A genome scan localizes five non-MHC
loci controlling collagen-induced arthritis in rats. Nat Genet
1996, 14:82-85.
Available online />R371
The following Additional files will be made available with
the fulltext version of this article:
Additional file 1, Additional file 2, Additional file 3
Tables listing genes that are differentially expressed or
have a tendency to be differentially expressed in DA
versus E3 rats based on affymetrix data from pooled
RNA samples.
See />supplementary/ar993-s1.pdf
/>ar993-s2.pdf and
/>ar993-s3.pdf
Additional file 4
Results of Taqman analysis performed on five selected
genes in pristane-injected DA and E3 rats.
See />supplementary/ar993-s4.pdf
Additional file 5
The complete gene list of the custom-made glass
oligomer chips.
See />supplementary/ar993-s5.pdf
Additional file 6
List of which of the genes listed in Additional file 5 are
differentially expressed or have a tendency to be
differentially expressed in DA rats versus E3 rats that are
naïve.
See />supplementary/ar993-s6.pdf
Additional file 7
List of which of the genes listed in Additional file 5 are
differentially expressed or have a tendency to be
differentially expressed in DA rats versus E3 rats that are
pristane treated.
See />supplementary/ar993-s7.pdf
Additional file 8
Results of fluorescence activated cell sorting in which
samples from naïve and immunized rats from each rat
strain were analyzed by flow cytometry to determine
whether differential detection at the mRNA level was
correlated with protein level.
See />supplementary/ar993-s8.pdf
Additional file 9
Results of ELISAs in which plasma from naïve and
immunized individuals from each rat strain were analyzed
to determine whether the differential detection of
immunoglobulins at the mRNA level was correlated with
the immunoglobulin concentrations.
See />supplementary/ar993-s9.pdf
14. Nordquist N, Olofsson P, Vingsbo-Lundberg C, Petterson U,
Holmdahl R: Complex genetic control in a rat model for
rheumatoid arthritis. J Autoimmunity 2000, 15:1-8.
15. Griffiths MM, Wang J, Joe B, Dracheva S, Kawahito Y, Shepard
JS, Reese VR, McCall-Vining S, Hashiramoto A, Cannon GW,
Remmers EF, Wilder RL: Identification of four new quantitative
trait loci regulating arthritis severity and one new quantitative
trait locus regulating autoanitbody production in rats with col-
lagen-induced arthritis. Arthritis Rheum 2000, 43:1278-1289.
16. Furuya T, Salstrom JL, McCall-Vining S, Cannon GW, Joe B,
Remmers EF, Griffiths MM, Wilder RL: Genetic dissection of a
rat model for rheumatoid arthritis: significant gender influ-
ences on autosomal modifier loci. Hum Mol Genet 2000, 9:
2241-2250.
17. Lu S, Nordquist N, Holmberg J, Olofsson P, Pettersson U, Holm-
dahl R: Both common and unique susceptibility genes in dif-
ferent rat strains with pristane-induced arthritis. Eur J Hum
Genet 2002, 10:475-483.
18. Roth MP, Viratelle C, Dolbois L, Delverdier M, Borot N, Pelletier L,
Druet P, Clanet M, Coppin H: A genome-wide search identifies
two susceptible loci for experimental autoimmune
encephalomyelitis on rat chromosomes 4 and 10. J Immunol
1999, 162:1917-1922.
19. Joe B, Cannon GW, Griffiths MM, Dobbins DE, Gulko PS, Wilder
RL, Remmers EF: Evaluation of quantitative trait loci regulating
severity of mycobacterial adjuvant-induced arthritis in mono-
congenic and polycongenic rats: identification of a new regu-
latory locus on rat chromosome 10 and evidence of overlap
with rheumatoid arthritis susceptibility loci. Arthritis Rheum
2002, 46:1075-1085.
20. Fox DA: The role of T cells in the immunopathogenesis of
rheumatoid arthritis: new perspectives. Arthritis Rheum 1997,
40:598-609.
21. Holmdahl R, Goldschmidt TJ, Kleinau S, Kvick C, Jonsson R:
Arthritis induced in rats with adjuvant oil is a genetically
restricted, alpha beta T-cell dependent autoimmune disease.
Immunol 1992, 76:197-202.
22. Pelegri C, Morante MP, Castellote C, Franch A, Castell M: Treat-
ment with an anti-CD4 monoclonal antibody strongly amelio-
rates established rat adjuvant arthritis. Clin Exp Immunol
1996, 103:273-278.
23. Jansson ÅM, Lorentzen JC, Bucht A: CD8
+
cells suppress oil
induced arthritis. Clin Exp Immunol 2000, 120:532-536.
24. Weyand CM, Goronzy JJ: Association of MHC and rheumatoid
arthritis. HLA polymorphisms in phenotypic variants of
rheumatoid arthritis. Arthritis Res 2000, 2:212-216.
25. MacKay K, Eyre S, Myerscough A, Milicic A, Barton A, Laval S,
Barrett J, Lee D, White S, John S, Brown MA, Bell J, Silman A,
Ollier W, Wordsworth P, Worthington J: Whole-genome linkage
analysis of rheumatoid arthritis susceptibility loci in 252
affected sibling pairs in the United Kingdom. Arthritis Rheum
2002, 46:632-639.
26. Czerwony G, Alten R, Gromnica-Ihle E, Hagemann D, Reuter U,
Sörensen H, Müller B: Differential surface expression of HLA-
DRB1 and HLA-DRB4 among peripheral blood cells of DR4
positive individual. Hum Immunol 1999, 60:1-9.
27. Olofsson P, Holmberg J, Tordsson J, Lu S, Åkerström B and
Holmdahl R: Postitional identification of Ncf1 as a gene that
regulates arthritis severity in rats. Nat Genet 2003, 33:25-32.
28. Shimaoka Y, Attrep JF, Hirano T, Ishihara K, Suzuki R, Toyosaki T,
Ochi T, Lipsky PE: Nurse-like cells from bone marrow and syn-
ovium of patients with rheumatoid arthritis promote survival
and enhance function of human B cells. J Clin Invest 1998,
102:606-618.
29. Lee BO, Ishihara K, Denno K, Kobune Y, Itho M, Muraoka O,
Kaisho T, Sasaki T, Ochi T, Hirano T: Elevated levels of the
soluble form of bone marrow stromal cell antigen 1 in the
sera of patients with severe rheumatoid arthritis. Arthritis
Rheum 1996, 39:629-637.
30. Tournier C, Thomas G, Pierre J, Jaquemin C, Pierre M, Saunier B:
Mediation of arachidonic acid metabolites of the H
2
O
2
-
induced stimulation of mitogen-activated protein kinases
(extracellular-signal-regulated kinase and c-jun NH
2
-terminal
kinase). Eur J Biochem 1997, 244:587-595.
31. Kasid U, Wang FH, Whiteside TL: Ionizing radiation and TNF-
alpha stimulate gene expression of a Thr/Tyr-protein phos-
phatase HVH1 and inhibitory factor IkappaBalpha in human
squamous carcinoma cells. Mol Cell Biochem 1997, 173:193-
197.
32. Sohaskey ML, Ferrell JE Jr: Activation of p42 mitogen-activated
protein kinase (MAPK), but not c-jun NH
2
-Terminal kinase,
induces phosphorylation and stabilization of MAPK phos-
phatase XCL100 in Xenopus oocytes. Mol Biol Cell 2002, 13:
454-468.
33. Dubois B, Masure S, Hurtenbach U, Paemen L, Heremans H, van
den Oord J, Sciot R, Meinhardt T, Hämmerling G, Opdenakker G,
Arnold B: Resistance of young gelatinase B-deficient mice to
experimental autoimmune encephalomyelitis and necrotizing
tail lesions. J Clin Invest 1999, 104:1507-1515.
34. Bryl E, Vallejo AN, Weyand CM, Goronzy JJ: Down-regulation of
CD28 expression by TNF
αα
. J Immunol 2001, 167:3231-3228.
35. Lützelschwab C, Pejler G, Aveskogh M, Hellman L: Secretory
granule proteases in rat mast cells. Cloning of 10 different
serine proteases and a carboxypeptidase A from various rat
mast cell populations. J Exp Med 1997, 185:13-29.
36. McNeil HP, Gotis-Graham I: Human mast cell subsets: distinct
functions in inflammation? Inflamm Res 2000, 49:3-7.
37. Munro SB, Duclos AJ, Jackson AR, Baines MG, Blaschuk OW:
Charecterization of cadherins expressed by murine thymo-
cytes. Cell Immunol 1996, 169:309-312.
38. Ohtsuka T, Ryu H, Minamishima YA, Ryo A, Lee SW: Modulation
of p53 and p73 levels by cyclin G: implication of a negative
feedback regulation. Oncogene 2003, 22:1678-1687.
39. Tak PP, Zvaifler NJ, Green DR, Firestein GS: Rheumatoid arthri-
tis and p53: how oxidative stress might alter the course of
inflammatory diseases. Immunol Today 2000, 21:78-82.
40. Holmdahl R, Lorentzen JC, Lu S, Olofsson P, Wester L, Holmberg
J, Pettersson U: Arthritis induced in rats with non-immuno-
genic adjuvants as models for rheumatoid arthritis. Immunol
Rev 2001, 184:184-202.
41. Remmers EF, Joe B, Griffiths MM, Dobbins DE, Dracheva SV,
Hashiramoto A, Furuya T, Salström JL, Wang J, Gulko PS, Cannon
GW, Wilder RL: Modulation of multiple experimental arthritis
models by collagen-induced arthritis quantitative trait loci iso-
lated in congenic rat lines: different effects of non-major his-
tocompatibility complex quantitative trait loci in males and
females. Arthritis Rheum 2002, 46:2225-2234.
42. Joe B, Remmers EF, Dobbins DE, Salström JL, Furuya T, Dracheva
S, Gulko PS: Genetic dissection of collagen-induced arthritis
in chromosome 10 quantitative trait locus speed congenic
rats: evidence for more than one regulatory locus and sex
influences. Immunogenetics 2000, 51:930-944.
43. Jagodic M, Kornek B, Weissert R, Lassman H, Olsson T, Dahlman
I: Congenic mapping confirms a locus on rat chromosome 10
conferring strong protection against myelin oligodendrocyte
glycoprotein-induced experimental autoimmune encephalo-
myelitis. Immunogenetics 2001, 53:410-415.
44. Backdahl L, Ribbhammar U, Lorentzen JC: Mapping and func-
tional characterization of rat chromosome 4 regions that reg-
ulate arthritis models and phenotypes in congenic strains.
Arthritis Rheum 2003, 48:551-559.
45. Holm BC, Xu HW, Jacobsson L, Larsson A, Luthman H, Lorentzen
JC: Rats made congenic for Oia3 on chromosome 10 become
susceptible to squalene-induced arthritis. Hum Mol Genet
2001,10:565-572.
Correspondence
Dr Lena Wester, Medical Inflammation Research, BMC, Lund
University, Lund, Sweden (present address). E-mail:
Arthritis Research & Therapy Vol 5 No 6 Wester et al.
R372