Báo cáo khoa học: "Genomic alterations of primary tumor and blood in invasive ductal carcinoma of breast" pdf
Bạn đang xem bản rút gọn của tài liệu. Xem và tải ngay bản đầy đủ của tài liệu tại đây (997.88 KB, 11 trang )
RESEARC H Open Access
Genomic alterations of primary tumor and blood
in invasive ductal carcinoma of breast
Ja Seong Bae
1
, Jin Soo Choi
2
, Seung Ho Baik
2
, Woo Chan Park
1
, Byung Joo Song
1
, Jeong Soo Kim
1
, Young Lim
3
,
Sang Seol Jung
1*
Abstract
Background: Genomic alterations are important events in the origin and progression of various cancers, with DNA
copy number changes associated with progression and treatment response in cancer. Array CGH is potentially
useful in the identification of genomic alterations from primary tumor and blood in breast cancer patients. The aim
of our study was to compare differences of DNA copy number changes in blood and tumor tissue in breast
cancer.
Methods: DNA copy number changes in blood were compared to those in tumor tissue using array-comparative
genomic hybridization in samples obtained from 30 breast cancer patients. The relative degree of chromosomal
changes was analyzed using log2 ratios and data was validated by real-time polymerase chain reaction.
Results: Forty-six regions of gains present in more than 30% of the tissues and 70 regions of gains present in
more than 30% of blood were identified. The most frequently gained region was chromosome 8q24. In total,
agreement of DNA copy numbers between primary tumor and blood was minimal (Kappa = 0.138, p < 0.001).
Conclusion: Although ther e was only a slight agreement of DNA copy number alterations between the primary
tumor and the blood samples, the blood cell copy number variation may have some clinical significance as
compared to the primary tumor in IDC breast cancer patients.
Background
Breast cancer is the most frequently occurring malig-
nancy in Korean women [1]. Even with advances in
diagnosis and treatment of breast cancer, the prognosis
and survival of patients with breast cancer remains
unsatisfactory. Histological and molecular heterogeneity
of breast cancer, even in the same stage, hampers the
use of standardi zed treatment. Many wome n might ben-
efit from more aggressive therapy while others unneces-
sarily receive treatment. With the aim of indi vidualizing
therapy and to refine predictive prognosis, studies have
sought to identify biomolecular markers and candidate
genes [2-6]. Thus, it is crucial to elucidate the mechan-
isms involved in breast cancer carc inogenesis at the
genetic and molecular levels.
Genomic instability including gain or loss of the
region-specific genomic DNA copy number is associated
with cancer development and pro gression [7]. These
DNA copy number alterations may result in overexpres-
sion of oncogenes with DNA amplification or deletion
of tumor suppressor genes [8]. Analysis of DNA copy
number changes have been performed using karyotyp-
ing, fluorescence in situ hybridization (FISH), compara-
tive genomic hybridization (CGH), and loss of
heterozygosity (LOH). However, these methods are lim-
ited by their resolution and inability to assess genetic
information.
Array-comparative CGH (array-CGH) has been per-
formed to localize DNA copy number changes asso-
ciated with various human cancers [9-12] and to
compare the abundance of specific genomic sequences
in whole-tumor DNA relative to normal reference g en-
omes. Array CGH can provide high resolution and
dynamic range with more accurate mapping of regions
[13-15], and has been used successfully as a tool for the
identification of aberrations in breast cancer [16,17].
Array CGH utilizes fresh frozen or formalin-fixed,
paraffin-embedded tissue (FFPE) to detect chromosomal
alterations in tumor DNA. Although FFPE has been
* Correspondence:
1
Department of Surgery, The Catholic University, Seoul, Korea
Bae et al. World Journal of Surgical Oncology 2010, 8:32
/>WORLD JOURNAL OF
SURGICAL ONCOLOGY
© 2010 Bae et al; licensee BioMed Central Ltd. This is an Open Access article distributed under the terms of the Creative Commons
Attribution License ( which permits unrestricte d use, distribution, and reproduction in
any medium, provided the original work is properly cited.
widely used to archive sampl es obtained from various
human cancer, characterization is mainly limited to
cytogenetic techniques that analyze genetic changes at
the chromosomal level [18,19]. On the other han d, fresh
frozen tissues provide the highest quality nucleic acid
for analysis. But, clinical availability is often limited. A
possible alternative is whole blood samples, since array
CGH using whole blood samples has been used for diag-
nostic testing of patients with mental retardation, birth
defects, and behavioral problems [20].
The aim of our study was to compare the chromoso-
mal abnormalities in DNA between fresh frozen tissue
and peripheral blood to determine if peripheral blood
rather than fresh frozen tissue can be applied for clinical
assessment in breast cancer patients.
Methods
Sample acquisition
Fresh tissue and peripheral blood samples w ere each
obtained from 30 patients with histologically confirmed
breast cancer at the Department of General Surgery at
Kangnam St. Mary’s Hospital, the Catholic University of
Korea following their informed consent. The clinico-
pathological charact eristics of the samples are shown in
Table 1. gDNA was extracted from a frozen fragment of
the tumor tissue, using a micro-dissection technique to
reduce contamination with non-neoplastic tissue. Each
tissue sample was incubated overnight at 55°C with cell
lysis buffer and 10 μl p roteinase K (>600 mAU/ml)
(Qiagen, Germany). PBMC was obtained by fycoll hypa-
que density gradient. Whole genomic DNA was
extracted using a Puregene DNA isolation kits (Gentra
Systems, USA). The reference sample was used from
commercial DNA source (Promega, USA).
Array CGH analysis
The array used in this study consisted of 4,030 bacterial
artificial chromosome (BAC) clones representing dupli-
cates of regions of the whole human genome yielding a
resolution of about 1 Mbp. DNA was labeled using the
Bioprime labeling kit (Invitrogen, USA). Genomic DNA
samples (500~700 ng) with random primers were boiled
at 98-100°C for 5 min for denaturation and then cooled
on ice for 5 min. The denatured DNA was differentially
labeled with 3 μl of 1 mM Cy3 and Cy5 conjugated
dCTP (Perkin-Elmer, USA) by random primer labeling,
and 1 μl Klenow fragments were added to the mixture.
DNA was incubated at 37°C overnight. After labeling,
unincorporated nucleotides were removed using Micro-
Spin G-50 columns (Amersham Biosciences, England).
Cy3 and Cy5 labeled test DNA and reference DNA were
mixed with 50 μg of human Cot-1 DNA to block repeat
sequences. After purification, the mixture was resolved
in hybridization buffer containing yeast tRNA to block
binding of non-specific nucleotides. MACArray
™
-Karyo
4 K BAC-chips (Macrogen, Korea) were prehybridized
in hybridization buffer with salmon sperm DNA for
30 min prior to hybridization with the purification mix-
ture and incubat ed for 72 h in a 37°C hy bridization
chamber. After h ybridization was complete, array chips
were washed in 50% formamide-2× SSC at 46°C for 15
min, and then 0.1% sodium dodecyl sulfate-2× sodium
chloride-sodium citrate (SSC) buffer at 46°C for 30 min.
In the next step, the c hips were wash ed in 50% sodium
phosphate 0.1% NP40 for 15 min followed by washing
in 2× SSC buffer for 5 min at room temperature. After
spin drying, hybridized arrays were scanned with a
MAC Viewer2
™
(Macrogen).
Data analyses
The scanned images were analyzed using MAC viewer
v.2 Software (Macrogen) to determine the Cy3:Cy5 ratio
for each array element. Data were depicted as log
2
(Cy3
Table 1 Demographics of patients and tumor
characteristics
Characteristic No. of patients (n = 30)
Mean age (years) ± SD (range) 49.2 ± 8.6 (35–70)
Histological subtype
Invasive ductal carcinoma 30
Tumor status
T1 15
T2 13
T3 2
Lymph node status
N0 17
N1 7
N2 4
N3 2
TNM stage
I15
II 9
III 6
Tumor differentiation
Well 4
Moderate 18
Poor 8
Hormone receptor status
Estrogen receptor
Positive 21
Negative 9
Progesterone receptor
Positive 13
Negative 17
HER-2 receptor status
Positive 9
Negative 21
Bae et al. World Journal of Surgical Oncology 2010, 8:32
/>Page 2 of 11
intensity/Cy5 intensity ratios) plotted against the posi-
tion of clones within the particular chromosome as per
the current version of the genome. Based on the ratios
of clones mapping to chromosome X in a hybridization
of normal female DNA, a specific amplicon was deter-
mined (Fig. 1). A ratio of 1.0 indicated a balanced stage
of DNA with respect to gain and lo ss between tissue or
blood samples and reference samples; the log
2
ratio
value was plotted as the zero value. A threshold level
for determining significant DNA loss was defined as
log
2
ratio < -0.5, while log
2
ratio > 0.5 represented
significant gains. The threshold corresponded to two
standard deviations (SD). Centromere regions were
excluded from the analysis, which averaged 10 Mb in all
chromosomes. The information on each individual clone
was obtained from the University of California at
Santa Cruz (UCSC) Genome Bioinformatics database
.
Real time-quantitative polymerase chain reaction (PCR)
To confirm genomic imbalances identified by array
CGH, DNA samples with obvious genomic changes were
analyzed using real time PCR. Prime rs for clones were
selected and the position of each clone was obtained
from the UCSC genome database. For relative quantifica-
tion, the reactions were performed in a total volume o f
25 μlthatincluded12.5μlof2×IQ
™
SYBR Green®
Supermix (Bio-Rad, USA), 1 μlofDNA(10ng/μl), and
1 μl of each primer (10 pmol/μl). The PCR amplification
and detection steps were carri ed out in an iCyc ler (Bio-
Rad) with 30 s at 95°C, 60°C, and 72°C for 30 cycles after
the initial 5 min denaturation step at 94°C. The thresh-
old cycle (C
T
) value was calculated using the compara-
tive C
T
method (Poropat et al. 1998). C
T
for e ach gene
was determined using thermocycler software and an
average of three independent experiments was calcu-
lated. The N-value of the t arget gene was normalized to
an endogenous reference, glyceraldehyde 3-phosphate
dehydrogenase, which shows no significant changes in
each genome [21,22].
Results
Initially, we reviewed the existing literature on onco-
genes associated with human breast cancer in breast
cancer tissues and compared our results (Table 2). For
example, chromosome 8 alterations including a gain of
8q24 are commonly observed in breast cancer [23,24].
The MYC oncogene in the 8q24 region is associated
with a worsened prognosis or more aggressive clinical
features [25]. This region was amplified in 90% of the
presently studied tumors.
We identified 46 regions of gain present in more than
30% of the primary tumor samples and 70 regions of gain
present in more than 30% of blood samples. The most
frequently gained region was chromosome 8q24. This
region was present in 20/30 (67%) of the tumor samples
and 23/30 (77%) o f the blood samples. The frequency of
copy number loss was lower than that of copy number
gains. There were 11 regions of loss found in more than
13% of the primary tumors and 16 regions of loss found
in more than 13% of blood (Tables 3 and 4).
Thirty other regions of copy number gain were
detected in at least 30% of both primary tumors and
blood (Table 5). Among these, seven regions of copy
number gain were found in more than 50% of both pri-
mary tumors and blood. A gain of 5p15.33 was evident
in 24/30 (80%) of t he primary tumors and 17/30 (57%)
blood sample s. The region on 5p15.33 was f ound to
contain AHRR, EXOC3 and SLC9A3. A gain at 8q24.3
was frequently detected. This region was found to con-
tainHSF1,DGAT1,SCRT1,FBXL6,GPR172Aand
ADCK5. A gain of 17q11.2 was evident in 19/30 (63%)
of the primary tumors and 17/30 (57%) of the blood
samples. The region on 17q11.2 was found to contain
MYO18A. A gain of 20q13.33 was detected in 16/30
(53%) of the primary tumors and 19/30 (63%) of the
blood samples. This regio n was found to contain
LAMA5, RPS21, CABLES2 and C20orf151. Gain of
22q13.33 was detected in 50% of both primary tumors
and blood. This region on 22q13.33 was found to con-
tain MOV10L1, PAN X2, TUBGCP6, HDAC10,
MAPK12, MAPK11, and PLXNB2.
Genomic losses o f blood were most often present in
2q (23%), 10q (27%), 14q (27%), 18p (27%) and 22q
(47%). Chiefly tumor observed a berration of DNA loss
regions in 14q (27%), 17p (40%) and 22q (37%). Only
one region of copy number loss was detected in more
than 30% of both primary tumors and blood. This
region comprised chromosome 22q11.21, and was
detected in 11/30 (37%) of primary tumors and 14/30
(47%) of blood. The region on 22q11.21 was found to
contain GGT2.
To confirm the array CGH results, DNA copy num-
bers between primary tumor and blood samples were
evaluated by real time PCR. As for the array CGH
results, several frequently altered loci were found. We
selected four related genes that might represent putative
candidate genes involved in breast cancer (Fig. 2).
Primers for the three genes are presented in Table 6.
The clone positions were retrieved from the UCSC gen-
ome database (Table 6).
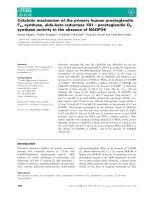
In the comparison of the results of array CGH with
thoseofrealtimePCR,thearrayCGHvalueswere
represented by linear-ratios and the N-value was deli-
neated by real time PCR (Fig. 2). The relative fold
increases by real time PCR of three genes were consis-
tent with those obtained from array CGH. A parallel
examination demonstrated that the gene copy n umber
Bae et al. World Journal of Surgical Oncology 2010, 8:32
/>Page 3 of 11
Control
1 1 12 2 2 23 3 3 4 4 4 5 556 6 67 7 78 8 89 9101011 12 12131415 16 17 18192021 22
A
Tumor
Blood
B
4p 5p 8q 16p17q 20q
C
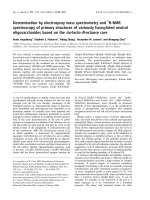
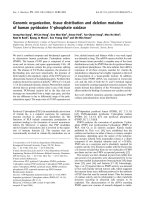
Figure 1 DNA copy numb er changes in a representative 30 IDC of each blood and tumor tissue. Results of array CGH analysis of 30 IDC
human breast cancer tumor tissues and blood. The copy number fold change is shown on the y-axis and the genomic location is shown on
the x-axis of panels A and B.
Bae et al. World Journal of Surgical Oncology 2010, 8:32
/>Page 4 of 11
differences between primary tumor and blood were gen-
erally larger when evaluated by real time PCR compared
to array CGH. Array CGH and real time PCR corre-
sponded well with respect to chromosomal copy num-
ber alterations delineated in each sample.
Discussion
In this study, we screened for chromosomal aberrations
in primary tumors and blood samples obtained fr om 30
patients diagnosed with breast cancer. Chromosomal
abnormalities were evident, with DNA aberrations hav-
ing a similar tendency to be located at specific chromo-
somal regions in both sample types.
Genomic DNA copy number changes occur frequently
in solid tumors [16] and in association with various
human cancers. Recent research has been aimed at
determining the phenotype of specific copy number
changes [26]. Thus, it has become important to investi-
gate region-specific DNA copy number changes asso-
ciated with tumor carcinogenesis and prognosis.
Several techniques including FISH, real time PCR,
LOH, and CGH have been used to detect DNA copy
number changes. Array-CGH is a powerful technique
that allows determination of DNA copy number analysis
of all regions of large genomes. Unlike conventional
CGH, array CGH can provide better resolution and
quantitative information at the level of chromosomal
gain or loss. Whichever methods are used in the analysis
of array CGH data, it is very important that the large
volume of data to be validated with various methods
including FISH and real time PCR [27,28]. In our study,
the latter technique provided the confirmation.
The use of convent ional and array CGH for DNA copy
number changes in breast cance r is well established, and
regions of frequent gain (1q, 8q, 11q, 16p, 17q, 19q and
20q) and loss (6q, 13q, 16q, 17p and 22q) have been iden-
tified [13,29-34]. Presently, DNA copy number changes
were frequently identified in both primary tumo rs and
blood samples. A large number of regions throughout the
genome were altered. DNA copy number alterations of
both primary tumor and blood samples were not random.
Common DNA gains were more frequently found in 1q,
3q, 4p, 5p, 8q, 10q, 11p, 12p, 12q, 14q, 15q, 16p, 16q,
17p, 17q, 19p, 19q, 20q and 22q, with DNA losses
detected in 6p, 7q, 14q and 22q. Seven regions more fre-
quently displayed gain in more than 50% of both the pri-
mary tumor and blood samples (Figure 1). Gain on
5p15.33 was identified in 17 cases (57%) of blood samples
and 24 prim ary tumor samples (80%). The region
included four genes (AHRR, EXOC3, SLC9A3, and
CEP72). AHRR encodes an aryl hydrocarbon receptor
repressor, which is a bHLS/Per-ARNT-Sim transcription
factor. It was rece ntly reported that AHRR is a putative
new tumor suppressor gene in multiple types of human
cancers including breast cancer [35].
Other candidate genes have been described as fre-
quently imbalance d in the genomes of the breast cancer
cell s (Figure 3). Gain on 8q24.3 and 20q13.33 was iden-
tified in more than 50% of the samples. Gain on
17q11.2 was seen in 19 of the primary tumors (63%)
and in 17 of the blood samples (57%). The region
included the myosin XVIII A (MYO 18 A) gene that is a
memb er of the myosin superfamily, and which has been
implicated in atypical myelodysplatic syndrome/prolif-
erative disease [36]. Gain on 17q25.3, which was
observed in 17 of the p rimary tumors (57%) and 18
blood samples (60%), concerns genes encoding solute
carrier family 16 member 3 (SLC16A3) and casein
kinase 1 delta (CSNGK1D). SLC16A3 is a hypoxia-regu-
lated gene that is expressed in bladder and breast cell
lines [37]. CSNK1D is associated with metastasis and
relapse of breast cancer, and is overexpressed in lymph
node positive breast cancer [38]. Gain on 22q13.33 was
over represented in 15 primary tumor and 15 blood
samples (50% each). The region includes MOV10L1,
PANX2, TUBGCP6, HDAC1 0, MAPK12, MAPK11, and
Table 2 Recurrent gains in breast cancer tissues with examples of some candidate oncogenes
specimens Chr. BAC_Start
(bp)
BAC_End
(bp)
Size
(bp)
Cancer
Genes
BC-1;BC-2;BC-5;BC-8;BC-14;BC-17;BC-18; BC-19 1 58958809 59044901 86092 JUN
BC-1;BC-2;BC-3;BC-4;BC-5;BC-6;BC-7;BC-8;BC-9;BC-10;BC-11;BC-13;BC-14;BC-17;BC-18;BC-19;BC-20;
BC-21;BC-22;BC-23;BC-25;BC-26;BC-28;BC-30
8 128800101 128877465 77364 MYC
8 134244673 134344801 100128 WISP1
BC-1;BC-2;BC-5;BC-7;BC-8;BC9;BC-10; BC-17; BC-21;BC-23;BC-25;BC-26;BC-29;BC-30 10 103483027 103545553 62526 FGF8
BC-14;BC-16;BC-17;BC-26;BC-30 11 499204 651925 152721 HRAS
BC-22;BC-26;BC-28 11 69236764 69325605 88841 FGF4
BC-1;BC-10;BC-18;BC-23;BC-29 17 34989583 35061419 71836 STARD3
BC-28 17 31081633 31171045 89412 MMP28
BC-1;BC-4;BC-6;BC-9;BC-10;BC-14;BC19;BC-26;BC-28 17 59297086 59423954 126868 GH1;GH2
BC-26 17 59067300 59150930 83630 MAP3K3
Bae et al. World Journal of Surgical Oncology 2010, 8:32
/>Page 5 of 11
Table 3 Summary of the most frequent aberrant regions of DNA gain and loss (Blood)
Chromosome Cytoband No.of patients
(n = 30)
Frequency (%) Chromosome Cytoband No. of patients
(n = 30)
Frequency (%)
Copy number Gain
1p 1p36.12 13 13/30 (43) 12q 12q21.2 10 10/30 (33)
1p36.13 12 12/30 (40) 14q 14q32.12 13 13/30 (43)
1p36.31 10 10/30 (33) 15q 15q11.2 11 11/30 (37)
1p35.1 13 13/30 (43) 15q12 10 10/30 (33)
1q 1q23.1 11 11/30 (37) 15q25.2 10 10/30 (33)
2p 2p11.2 11 11/30 (37) 16p 16p11.2 11 11/30 (37)
2p13.1 14 14/30 (47) 16p13.3 16 16/30 (53)
3p 3p22.1 10 10/30 (33) 16q 16q22.1 12 12/30 (40)
3p22.2 11 11/30 (37) 16q24.1 13 13/30 (43)
3q 3q21.1 12 12/30 (40) 16q24.3 11 11/30 (37)
3q21.3 15 15/30 (50) 17p 17p11.2 13 13/30 (43)
3q27.1 10 10/30 (33) 17p12 11 11/30 (37)
4p 4p16.3 15 15/30 (50) 17p13.2 10 10/30 (33)
5p 5p13.3 12 12/30 (40) 17p13.3 14 14/30 (47)
5p15.33 17 17/30 (57) 17q 17q11.2 17 17/30 (57)
5q 5q33.1 12 12/30 (40) 17q12 13 13/30 (43)
7q 7q11.23 12 12/30 (40) 17q21.1 10 10/30 (33)
7q36.3 10 10/30 (33) 17q21.2 11 11/30 (37)
8p 8p21.2 11 11/30 (37) 17q21.32 13 13/30 (43)
8q 8q24.3 20 20/30 (67) 17q25.3 18 18/30 (60)
9p 9p12 11 11/30 (37) 18q 18q23 10 10/30 (33)
9q 9q34.11-9q34.12 17 17/30 (57) 19p 19p13.11 15 15/30 (50)
10p 10p15.3 11 11/30 (37) 19p13.3 16 16/30 (53)
10q 10q22.3 11 11/30 (37) 19q 19q13.2 11 11/30 (37)
10q26.3 11 11/30 (37) 19q13.33 11 11/30 (37)
11p 11p11.2 12 12/30 (40) 19q13.43 11 11/30 (37)
11p15.4 12 12/30 (40) 20p 20p12.2 10 10/30 (33)
11p15.5 18 18/30 (60) 20q 20q13.12 10 10/30 (33)
11p15.5-11p15.4 12 12/30 (40) 20q13.33 16 16/30 (53)
11q 11q12.3 13 13/30 (43) 22q 22q12.2 19 19/30 (63)
11q23.1 10 10/30 (33) 22q13.31 15 15/30 (50)
11q23.3 11 11/30 (37) 22q13.33 15 15/30 (50)
12p 12p13.31 18 18/30 (60) Xp Xp11.22 14 14/30 (47)
12p13.33 12 12/30 (40) Xp11.23 10 10/30 (33)
12q 12q13.13 10 10/30 (33) Xq Xq23 11 11/30 (37)
Copy number Loss
1q 1q44 5 5/30 (17) 11q 11q25 6 6/30 (20)
2p 2p25.3 5 5/30 (17) 13q 13q34 6 6/30 (20)
2q 2q37.3 7 7/30 (23) 14q 14q32.33 8 8/30 (27)
3p 3p26.3 5 5/30 (17) 16q 16q21 5 5/30 (17)
5q 5q13.2 6 6/30 (20) 18p 18p11.32 8 8/30 (27)
6p 6p25.3 6 6/30 (20) 21q 21q21.1 5 5/30 (17)
7q 7q22.1 6 6/30 (20) 22q 22q11.1 7 7/30 (23)
10q 10q11.22 8 8/30 (27) 22q11.21 14 14/30 (47)
Bae et al. World Journal of Surgical Oncology 2010, 8:32
/>Page 6 of 11
PLXNB2. Among them, histone deacetylase 10
(HDAC10), a member of class II HDACS, may play a
role as a transcriptional modulator in the nucleus and is
responsible for lung cancer progression and poor prog-
nosis [39]. In addition, HDACs may also play important
roles in cancer development by regulating several genes
and causing abnormal gene silencing. A HDAC inhibitor
is associated with growth arrest and apoptosis in breast
cancer cells [40].
The strength of agreement of DNA copy numbers
between primary tumor and blood was slight (Kappa =
0.138, p < 0.0 01). But we anticipated this result, th at
the copy number variant size would not be that large
nor would it show specific patterns like the private
tumor. We have also identified that b lood mainly
altered regions. Nevertheless, we have also identified the
main altered regions in blood samples. 3p22.2 is a
region frequently amplified in our blood samples and
this region including the MLH1 (mutL ho molog 1) is
known to be associated with colorectal cancer genes.
Gain of 8p21.2 and 9q34.11-12 were also found in
blood each about 37% and 57% out of a total of 30
samples (11/30, 17/30). These sites include NKX3-1
(8p21.2) and ABL1 ( 9q34.11-12) genes that are also
known to be associated with prostate tumor suppressor
gene and translocation mutation relatively in acute non-
lymphocytic leukemia.
Array CGH has been successfully utilized on DNA
extracted from fresh-frozen tissues, as these produce
high quality nucleic acids [17,34]. However, sometimes
fresh-frozen tissues are hard to get and store; more
than 70% of the 100-200mg of tissue typically required
needs to be comprised with tumor cells. Because the
availability of fresh-frozen tissue is limited, the use of
Table 4 Summary of the most frequent aberrant regions of DNA gain and loss (Tissues)
Chromosome Cytoband No. of patients
(n = 30)
Frequency (%) Chromosome Cytoband No. of patients
(n = 30)
Frequency (%)
Copy number Gain
1p 1p36.33 12 12/30 (40) 11p 11p15.5-11p15.4 13 13/30 (43)
1q 1q21.2 12 12/30 (40) 12p 12p13.31 10 10/30 (33)
1q23.1 14 14/30 (47) 12p13.33 12 12/30 (40)
1q23.3 12 12/30 (40) 12q 12q21.2 10 10/30 (33)
1q24.3 12 12/30 (40) 14q 14q32.12 11 11/30 (37)
1q44 11 11/30 (37) 15q 15q11.2 11 11/30 (37)
2p 2p11.1 13 13/30 (43) 15q12 10 10/30 (33)
2p25.1 11 11/30 (37) 15q26.3 12 12/30 (40)
3q 3q21.1 12 12/30 (40) 16p 16p13.2 10 10/30 (33)
4p 4p16.3 11 11/30 (37) 16p13.3 23 23/30 (77)
4q 4q32.1 10 10/30 (33) 16q 16q22.1 11 11/30 (37)
4q35.2 10 10/30 (33) 17p 17p13.3 10 10/30 (33)
5p 5p15.33 24 24/30 (80) 17q 17q11.2 19 19/30 (63)
7p 7p14.1 10 10/30 (33) 17q12 11 11/30 (37)
8q 8q11.1 12 12/30 (40) 17q21.1 11 11/30 (37)
8q11.21 10 10/30 (33) 17q25.3 18 17/30 (57)
8q21.3 13 13/30 (43) 18q 18q23 15 15/30 (50)
8q22.2 17 17/30 (57) 19p 19p13.3 13 13/30 (43)
8q24.3 23 23/30 (77) 19q 19q13.43 10 10/30 (33)
10p 10p15.3 10 10/30 (33) 20q 20q13.33 21 21/30 (70)
10q 10q26.3 15 15/30 (50) 21q 21q11.2 11 11/30 (37)
11p 11p15.4 10 10/30 (33) 22q 22q13.33 15 15/30 (50)
11p15.5 14 14/30 (47) Xp Xp11.23 10 10/30 (33)
Copy number Loss
3p 3p21.31 5 5/30 (17) 16q 16q23.1 4 4/30 (13)
4q 4q35.2 6 6/30 (20) 17p 17p11.2 12 12/30 (40)
6p 6p25.3 5 5/30 (17) 22q 22q11.1 5 5/30 (17)
7q 7q22.1 6 6/30 (20) 22q11.21 11 11/30 (37)
14q 14q32.33 8 8/30 (27) 22q11.23 7 7/30 (23)
16q 16q22.3 4 4/30 (13)
Bae et al. World Journal of Surgical Oncology 2010, 8:32
/>Page 7 of 11
Table 5 Most frequently detected regions in both blood and tissue group by array CGH
Cytoband Bac_position
(Start-End)
Gene Blood frequency Tissue frequency
copy number gain
1q23.1 155045002-155148010 SH2D2A, NTRK1, INSRR 11/30(37%) 14/30(47%)
3q21.1 124077821-124170592 DIRC2, SEMA5B 12/30(40%) 12/30(40%)
4p16.3 2729092-2810076 SH3BP2 15/30(50%) 10/30(33%)
5p15.33 388661-566921 AHRR, EXOC3, SLC9A3 17/30(57%) 24/30(80%)
5p15.33 557250-688780 SLC9A3, CEP72 14/30(47%) 24/30(80%)
8q24.3 145649003-145759358 CYHR1, KIFC2, FOXH1, PPP1R16A, GPT,
MFSD3, RECQL4, LRRC14, LRRC24
10/30(33%) 23/30(76%)
8q24.3 145298570-145384455 20/30(67%) 18/30(60%)
8q24.3 145499155-145579895 HSF1, DGAT1, SCRT1, FBXL6, GPR172A, ADCK5 16/30(53%) 19/30(63%)
10q26.3 134654530-134754530 GPR123 11/30(37%) 12/30(40%)
11p15.4 2812494-2941798 KCNQ1, KCNQ1DN, CDKN1C, SLC22A18AS, SLC22A18,
PHLDA2, NAP1L4
12/30(40%) 10/30(33%)
11p15.5 499204-651925 HRAS, LRRC56, C11orf35, RASSF7, IRF7, MUCDHL, SCT,
DRD4, DEAF1
18/30(60%) 11/30(37%)
11p15.5 982365-1053559 AP2A2, MUC6 13/30(43%) 14/30(47%)
11p15.5-11p15.4 2759787-2881783 KCNQ1, KCNQ1DN, CDKN1C, SLC22A18AS, SLC22A18 12/30(40%) 13/30(43%)
12p13.31 6232178-6365032 PLEKHG6, TNFRSF1A, SCNN1A, LTBR 18/30(60%) 10/30(33%)
12p13.33 183679-257363 SLC6A12, SLC6A13 12/30(40%) 12/30(40%)
12q21.2 74611385-74763510 PHLDA1, NAP1L1 10/30(33%) 10/30(33%)
14q32.12 91451809-91569634 FBLN5, TRIP11, PTMAP7 13/30(43%) 11/30(37%)
15q12 24429411-24553848 GABRB3 10/30(33%) 10/30(33%)
16p13.3 979471-1055445 16/30(53%) 23/30(76%)
16p13.3 3369954-3513708 HS3ST4, ZNF434, ZNF174, ZNF597, CLUAP1 12/30(40%) 11/30(37%)
16q22.1 65485602-65560334 CDH16, RRAD, FAM96B, CES2 12/30(40%) 11/30(37%)
17p13.3 907028-1022423 ABR, MRPL14P1 14/30(47%) 10/30(33%)
17q11.2 24429872-24521087 MYO18A 17/30(57%) 19/30(63%)
17q21.1 35466169-35565677 THRA, NR1D1, CASC3 10/30(33%) 11/30(37%)
17q25.3 78432676-78562724 TBCD, B3GNTL1 11/30(37%) 18/30(60%)
17q25.3 77755881-77849251 SLC16A3, CSNK1D 18/30(60%) 17/30(57%)
19p13.3 5809230-5915258 FUT5, NDUFA11, CAPS, RANBP3 14/30(47%) 13/30(43%)
19q13.43 63514606-63629648 HKR2, A1BG, ZNF497, RPS5, ZNF584 11/30(37%) 10/30(33%)
20q13.33 60334240-60438865 LAMA5, RPS21, CABLES2, C20orf151 16/30(53%) 19/30(63%)
22q13.33 48930979-49068912 MOV10L1, PANX2, TUBGCP6, HDAC10, MAPK12,
MAPK11, PLXNB2
15/30(50%) 15/30(50%)
copy number loss
6p25.3 202426-307948 DUSP22 6/30(20%) 5/30(17%)
7q22.1 100407386-100480418 MUC12, MUC17 6/30(20%) 6/30(20%)
14q32.33 105821330-105907464 IGHVIII-25-1, IGHV2-26, IGHVIII-26-1, IGHVII-26-2,
IGHV7-27, IGHV4-28, IGHVII-28-1, IGHV3-29, IGHV3-30,
IGHVII-30-1, IGHV3-30-2, IGHV4-31, IGHVII-31-1, IGHV3-32,
IGHV3-33, IGHVII-33-1, IGHV3-33-2, IGHV4-34, IGHV7-34-1
8/30(27%) 8/30(27%)
22q11.1(Cross-Hybridized) 14461738-14573360 DUXAP8 7/30(23%) 5/30(17%)
22q11.21 17158480-17233217 GGT2 14/30(47%) 11/30(37%)
Bold text indicates genes associate with many different carcinoma including breast.
Bae et al. World Journal of Surgical Oncology 2010, 8:32
/>Page 8 of 11
FFPE tissue has been explored [19,41]. To date, how-
ever, the use of FFPE tissues has been hampered by
increased degradation, reduction in the yield of total
genomic DNA, and decrease in reliability of DNA
[18,42,43].
TheresultsdemonstratetheutilityofarrayCGHfor
detecting DNA copy number changes f rom primary
tumors and peripheral blood, therefore showing the
potential use of blood s amples in cancer patients in
the absence of fresh-frozen tissue. There was a slight
agreement of DNA copy number alterations between
primary tumor an d blood in breast cancer patients.
Therefore, further research is necessary for a definitive
confirmation of the use of the peripheral blood as a
support for primary tumors in identifying putative
breast cancer genes through investigation of DNA
copy number alterations in a large number of primary
tumor and blood samples.
Figure 2 Comparison of array-CGH with Real-time PCR analysis. Each sample is depicted on the x-axis, fold change of array CGH is depicted
by linear-ratios, and RT-PCR (y-axis) is delineated applying N-value. A threshold level >1 (linear-ration and N-value) indicates significant DNA copy
number gain.
Table 6 Primers used for real time PCR analysis
Gene Forward sequence Reverse sequence Region CNV status
DIRC2 CAGGCAATGGTGAGATCCTG CCCGAAAACAGGAGGAGAAG 3q21.1 gain
SCRT1 GTGGGGAAGAGGATCAGGAA CCAGGCTTCAGGGAAGAGAC 8q24.3 gain
MYO18A GATATCCCCTTGGGCCTGTA CAGAATGGTGATGCCTCTGG 17q11.2 gain
GGT2 TGGTAGCTTATCCTGGGCCT ATGGGAGAAGACAGGGATGC 22q11.21 loss
006 March: UCSC genome browser.
Bae et al. World Journal of Surgical Oncology 2010, 8:32
/>Page 9 of 11
Acknowledgements
This study was supported by a grant from the Korean Health 21 R&D Project,
Ministry of Health Welfare, Republic of Korea (01-PJ3-PG6-01GN07-0004 ).
Author details
1
Department of Surgery, The Catholic University, Seoul, Korea.
2
Catholic
Neuroscience Center, The Catholic University, Seoul, Korea.
3
Department of
Occupational and Environmental Medicine, St. Mary’s Hospital, The Catholic
University, Seoul, Korea.
Authors’ contributions
JSB drafted the manuscript and contributed to conception and design. CJS
contributed to acquisition and analysis of data. WCP, BJS, JSK and YL
participated in the design of the study and revised ir critically for important
intellectual content. SHB participated in the design of study and performed
the statistical analysis. SSJ conceived of the study and pariticipated in its
design and coordination. All authors read and approved the final manuscript
Competing interests
The authors declare that they have no competing interests.
Received: 26 December 2009 Accepted: 21 April 2010
Published: 21 April 2010
References
1. Choi Y, Kim YJ, Shin HR, Noh DY, Yoo KY: Long-term prediction of female
breast cancer mortality in Korea. Asian Pac J Cancer Prev 2005, 6:16-21.
2. Cleator S, Ashworth A: Molecular profiling of breast cancer: clinical
implications. Br J Cancer 2004, 90:1120-1124.
3. Cowell JK, LaDuca J, Rossi MR, Burkhardt T, Nowak NJ, Matsui S: Molecular
characterization of the t(3;9) associated with immortalization in the
MCF10A cell line. Cancer Genet Cytogenet 2005, 163:23-29.
4. Morabito A, Magnani E, Gion M, Sarmiento R, Capaccetti B, Longo R,
Gattuso D, Gasparini G: Prognostic and predictive indicators in operable
breast cancer. Clin Breast Cancer 2003, 3:381-390.
5. Sorlie T, Perou CM, Tibshirani R, Aas T, Geisler S, Johnsen H, Hastie T,
Eisen MB, Rijn van de M, Jeffrey SS, Thorsen T, Quist H, Matese JC,
Brown PO, Botstein D, Eystein Lønning P, Børresen-Dale AL: Gene
expression patterns of breast carcinomas distinguish tumor subclasses
with clinical implications. Proc Natl Acad Sci USA 2001, 98:10869-10874.
6. van ‘t Veer LJ, Dai H, Vijver van de MJ, He YD, Hart AA, Mao M, Peterse HL,
Kooy van der K, Marton MJ, Witteveen AT, Schreiber GJ, Kerkhoven RM,
Roberts C, Linsley PS, Bernards R, Friend SH: Gene expression profiling
predicts clinical outcome of breast cancer. Nature 2002, 415:530-536.
7. Lengauer C, Kinzler KW, Vogelstein B: Genetic instabilities in human
cancers. Nature 1998, 396:643-649.
8. Weber BL: Cancer genomics. Cancer Cell 2002, 1:37-47.
9. Callagy G, Pharoah P, Chin SF, Sangan T, Daigo Y, Jackson L, Caldas C:
Identification and validation of prognostic markers in breast cancer with
the complementary use of array-CGH and tissue microarrays. J Pathol
2005, 205:388-396.
10. Garnis C, Lockwood WW, Vucic E, Ge Y, Girard L, Minna JD, Gazdar AF,
Lam S, MacAulay C, Lam WL: High resolution analysis of non-small cell
lung cancer cell lines by whole genome tiling path array CGH. Int J
Cancer 2006, 118:1556-1564.
11. Weiss MM, Kuipers EJ, Postma C, Snijders AM, Pinkel D, Meuwissen SG,
Albertson D, Meijer GA: Genomic alterations in primary gastric
adenocarcinomas correlate with clinicopathological characteristics and
survival. Cell Oncol 2004, 26:307-317.
12. Wolf M, Mousses S, Hautaniemi S, Karhu R, Huusko P, Allinen M,
Elkahloun A, Monni O, Chen Y, Kallioniemi A, Kallioniemi OP: High-
resolution analysis of gene copy number alterations in human prostate
cancer using CGH on cDNA microarrays: impact of copy number on
gene expression. Neoplasia 2004, 6:240-247.
13. Pinkel D, Segraves R, Sudar D, Clark S, Poole I, Kowbel D, Collins C, Kuo WL,
Chen C, Zhai Y, Dairkee SH, Ljung BM, Gray JW, Albertson DG: High
resolution analysis of DNA copy number variation using comparative
genomic hybridization to microarrays. Nature Genetics
1998, 20:207-211.
14. Snijders AM, Nowak N, Segraves R, Blackwood S, Brown N, Conroy J,
Hamilton G, Hindle AK, Huey B, Kimura K, Law S, Myambo K, Palmer J,
Ylstra B, Yue JP, Gray JW, Jain AN, Pinkel D, Albertson DG: Assembly of
microarrays for genome-wide measurement of DNA copy number. Nat
Genet 2001, 29:263-264.
15. Solinas-Toldo S, Lampel S, Stilgenbauer S, Nickolenko J, Benner A,
Dohner H, Cremer T, Lichter P: Matrix-based comparative genomic
hybridization: biochips to screen for genomic imbalances. Genes
Chromosomes Cancer 1997, 20:399-407.
16. Albertson DG, Collins C, McCormick F, Gray JW: Chromosome aberrations
in solid tumors. Nat Genet 2003, 34:369-376.
17. Loo LW, Grove DI, Williams EM, Neal CL, Cousens LA, Schubert EL,
Holcomb IN, Massa HF, Glogovac J, Li CI, Malone KE, Daling JR, Delrow JJ,
Trask BJ, Hsu L, Porter PL: Array comparative genomic hybridization
analysis of genomic alterations in breast cancer subtypes. Cancer Res
2004, 64:8541-8549.
18. Mc Sherry EA, Goldrick AM, Kay EW, Hopkins AM, Gallagher WM, Dervan PA:
Formalin-fixed paraffin-embedded clinical tissues show spurious copy
number changes in array-CGH profiles. Clinical genetics 2007, 72:441-447.
19. van Beers EH, Joosse SA, Ligtenberg MJ, Fles R, Hogervorst FB, Verhoef S,
Nederlof PM: A multiplex PCR predictor for aCGH success of FFPE
samples. Br J Cancer 2006, 94:333-337.
20. Stankiewicz P, Beaudet AL: Use of array CGH in the evaluation of
dysmorphology, malformations, developmental delay, and idiopathic
mental retardation. Current opinion in genetics 2007, 17:182-192.
21. Morgan BL, Chao CR: The effects of hypoxia on growth cones in the
ovine fetal brain. J Matern Fetal Neonatal Med 2004, 16:55-59.
22. Williams TD, Gensberg K, Minchin SD, Chipman JK: A DNA expression array
to detect toxic stress response in European flounder (Platichthys flesus).
Aquat Toxicol 2003, 65:141-157.
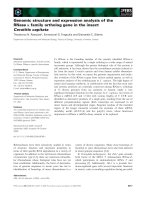
Figure 3 Frequency of g ene copy number abnormalities in
some chromosomal regions. Frequencies of significant genes
increased or decreased in copy number at 30 IDC breast cancer
samples.
Bae et al. World Journal of Surgical Oncology 2010, 8:32
/>Page 10 of 11
23. Escot C, Theillet C, Lidereau R, Spyratos F, Champeme MH, Gest J,
Callahan R: Genetic alteration of the c-myc protooncogene (MYC) in
human primary breast carcinomas. Proc Natl Acad Sci USA 1986,
83:4834-4838.
24. Visscher DW, Wallis T, Awussah S, Mohamed A, Crissman JD: Evaluation of
MYC and chromosome 8 copy number in breast carcinoma by
interphase cytogenetics. Genes Chromosomes Cancer 1997, 18:1-7.
25. Varley JM, Swallow JE, Brammar WJ, Whittaker JL, Walker RA: Alterations to
either c-erbB-2(neu) or c-myc proto-oncogenes in breast carcinomas
correlate with poor short-term prognosis. Oncogene 1987, 1:423-430.
26. Fridlyand J, Snijders AM, Ylstra B, Li H, Olshen A, Segraves R, Dairkee S,
Tokuyasu T, Ljung BM, Jain AN, McLennan J, Ziegler J, Chin K, Devries S,
Feiler H, Gray JW, Waldman F, Pinkel D, Albertson DG: Breast tumor copy
number aberration phenotypes and genomic instability. BMC Cancer
2006, 6:96.
27. Ginzinger DG: Gene quantification using real-time quantitative PCR: an
emerging technology hits the mainstream. Experimental hematology 2002,
30:503-512.
28. Hackett CS, Hodgson JG, Law ME, Fridlyand J, Osoegawa K, de Jong PJ,
Nowak NJ, Pinkel D, Albertson DG, Jain A, Jenkins R, Gray JW, Weiss WA:
Genome-wide array CGH analysis of murine neuroblastoma reveals
distinct genomic aberrations which parallel those in human tumors.
Cancer research 2003, 63:5266-5273.
29. Albertson DG: Profiling breast cancer by array CGH. Breast Cancer Res
Treat 2003, 78:289-298.
30. Nishizaki T, Chew K, Chu L, Isola J, Kallioniemi A, Weidner N, Waldman FM:
Genetic alterations in lobular breast cancer by comparative genomic
hybridization. Int J Cancer 1997, 74:513-517.
31. Persson K, Pandis N, Mertens F, Borg A, Baldetorp B, Killander D, Isola J:
Chromosomal aberrations in breast cancer: a comparison between
cytogenetics and comparative genomic hybridization. Genes,
chromosomes 1999, 25:115-122.
32. Pollack JR, Perou CM, Alizadeh AA, Eisen MB, Pergamenschikov A,
Williams CF, Jeffrey SS, Botstein D, Brown PO: Genome-wide analysis of
DNA copy-number changes using cDNA microarrays. Nature Genetics
1999, 23:41-46.
33. Rennstam K, Ahlstedt-Soini M, Baldetorp B, Bendahl PO, Borg A, Karhu R,
Tanner M, Tirkkonen M, Isola J: Patterns of chromosomal imbalances
defines subgroups of breast cancer with distinct clinical features and
prognosis. A study of 305 tumors by comparative genomic
hybridization. Cancer Res 2003, 63:8861-8868.
34. Tirkkonen M, Tanner M, Karhu R, Kallioniemi A, Isola J, Kallioniemi OP:
Molecular cytogenetics of primary breast cancer by CGH. Genes
Chromosomes Cancer 1998, 21:177-184.
35. Zudaire E, Cuesta N, Murty V, Woodson K, Adams L, Gonzalez N, Martnez A,
Narayan G, Kirsch I, Franklin W, Hirsch F, Birrer M, Cuttitta F: The aryl
hydrocarbon receptor repressor is a putative tumor suppressor gene in
multiple human cancers. Journal of Clinical Investigation 2008, 118:640-650.
36. Walz C, Chase A, Schoch C, Weisser A, Schlegel F, Hochhaus A, Fuchs R,
Schmitt-Graff A, Hehlmann R, Cross NC, Reiter A: The t(8;17)(p11;q23) in
the 8p11 myeloproliferative syndrome fuses MYO18A to FGFR1.
Leukemia
2005, 19:1005-1009.
37. Ord JJ, Streeter EH, Roberts IS, Cranston D, Harris AL: Comparison of
hypoxia transcriptome in vitro with in vivo gene expression in human
bladder cancer. Br J Cancer 2005, 93:346-354.
38. Abba MC, Sun H, Hawkins KA, Drake JA, Hu Y, Nunez MI, Gaddis S, Shi T,
Horvath S, Sahin A, Aldaz CM: Breast cancer molecular signatures as
determined by SAGE: correlation with lymph node status. Mol Cancer Res
2007, 5:881-890.
39. Osada H, Tatematsu Y, Saito H, Yatabe Y, Mitsudomi T, Takahashi T:
Reduced expression of class II histone deacetylase genes is associated
with poor prognosis in lung cancer patients. International journal of
cancer 2004, 112:26-32.
40. Fuino L, Bali P, Wittmann S, Donapaty S, Guo F, Yamaguchi H, Wang HG,
Atadja P, Bhalla K: Histone deacetylase inhibitor LAQ824 down-regulates
Her-2 and sensitizes human breast cancer cells to trastuzumab, taxotere,
gemcitabine, and epothilone B. Mol Cancer Ther 2003, 2:971-984.
41. Devries S, Nyante S, Korkola J, Segraves R, Nakao K, Moore D, Bae H,
Wilhelm M, Hwang S, Waldman F: Array-based comparative genomic
hybridization from formalin-fixed, paraffin-embedded breast tumors.
J Mol Diagn 2005, 7:65-71.
42. Little SE, Vuononvirta R, Reis-Filho JS, Natrajan R, Iravani M, Fenwick K,
Mackay A, Ashworth A, Pritchard-Jones K, Jones C: Array CGH using whole
genome amplification of fresh-frozen and formalin-fixed, paraffin-
embedded tumor DNA. Genomics 2006, 87:298-306.
43. Serth J, Kuczyk MA, Paeslack U, Lichtinghagen R, Jonas U: Quantitation of
DNA extracted after micropreparation of cells from frozen and formalin-
fixed tissue sections. Am J Pathol 2000, 156:1189-1196.
doi:10.1186/1477-7819-8-32
Cite this article as: Bae et al.: Genomic alterations of primary tumor and
blood in invasive ductal carcinoma of breast. World Journal of Surgical
Oncology 2010 8:32.
Submit your next manuscript to BioMed Central
and take full advantage of:
• Convenient online submission
• Thorough peer review
• No space constraints or color figure charges
• Immediate publication on acceptance
• Inclusion in PubMed, CAS, Scopus and Google Scholar
• Research which is freely available for redistribution
Submit your manuscript at
www.biomedcentral.com/submit
Bae et al. World Journal of Surgical Oncology 2010, 8:32
/>Page 11 of 11