Báo cáo y học: "Characterization of histopathology and gene-expression profiles of synovitis in early rheumatoid arthritis using targeted biopsy specime" pot
Bạn đang xem bản rút gọn của tài liệu. Xem và tải ngay bản đầy đủ của tài liệu tại đây (1.55 MB, 12 trang )
Open Access
Available online />R825
Vol 7 No 4
Research article
Characterization of histopathology and gene-expression profiles
of synovitis in early rheumatoid arthritis using targeted biopsy
specimens
Takahito Tsubaki
1
, Norimasa Arita
1
, Takuma Kawakami
2
, Takayuki Shiratsuchi
2
,
Haruyasu Yamamoto
1
, Nobuo Takubo
3
, Kazuhito Yamada
3
, Sanpei Nakata
3
, Sumiki Yamamoto
3
and Masato Nose
1
1
Ehime University School of Medicine, Ehime, Japan
2
Otsuka Pharmaceutical Co Ltd, Tokushima, Japan
3
Center for Rheumatic Diseases, Matsuyama Red Cross Hospital, Ehime, Japan
Corresponding author: Masato Nose,
Received: 30 Sep 2004 Revisions requested: 27 Oct 2004 Revisions received: 17 Mar 2005 Accepted: 29 Mar 2005 Published: 25 Apr 2005
Arthritis Research & Therapy 2005, 7:R825-R836 (DOI 10.1186/ar1751)
This article is online at: />© 2005 Tsubaki et al.; licensee BioMed Central Ltd.
This is an Open Access article distributed under the terms of the Creative Commons Attribution License ( />2.0), which permits unrestricted use, distribution, and reproduction in any medium, provided the original work is properly cited.
Abstract
The disease category of early rheumatoid arthritis (RA) has been
limited with respect to clinical criteria. Pathological
manifestations of synovitis in patients whose disease is clinically
classified as early RA seem to be heterogeneous, with regular
variations. To clarify the relation between the molecular and
histopathological features of the synovitis, we analyzed gene-
expression profiles in the synovial lining tissues to correlate them
with histopathological features. Synovial tissues were obtained
from knee joints of 12 patients with early RA by targeted biopsy
under arthroscopy. Surgical specimens of long-standing RA
(from four patients) were examined as positive controls. Each
histopathological parameter characteristic of rheumatoid
synovitis in synovial tissues was scored under light microscopy.
Total RNAs from synovial lining tissues were obtained from the
specimens selected by laser capture microdissection and the
mRNAs were amplified by bacteriophage T7 RNA polymerase.
Their cDNAs were analyzed in a cDNA microarray with 23,040
cDNAs, and the levels of gene expression in multilayered lining
tissues, compared with those of normal-like lining tissues in
specimens from the same person, were determined to estimate
gene-expression profiles characteristic of the synovial
proliferative lesions in each case. Based on cluster analysis of all
cases, gene-expression profiles in the lesions in early RA fell into
two groups. The groups had different expression levels of genes
critical for proliferative inflammation, including those encoding
cytokines, adhesion molecules, and extracellular matrices. One
group resembled synovitis in long-standing RA and had high
scores for some histopathological features – involving
accumulations of lymphocytes and plasma cells – but not for
other features. Possible differences in the histopathogenesis
and prognosis of synovitis between the two groups are
discussed in relation to the candidate genes and
histopathology.
Introduction
Synovial lesions in rheumatoid arthritis (RA) show complex his-
topathological manifestations, involving several diagnostic
hallmarks such as multilayered synovial lining tissues associ-
ated with a palisading structure of the intimal lining cells and
the presence of non-foreign-body-type giant cells, formation of
lymphoid follicles, and massive accumulation of plasma cells
and macrophages [1]. Mesenchymoid transformation and fibri-
noid degeneration are definite histopathological features of
RA [2]. These lesions are specific to the synovium in the pro-
gression stage of RA and their developmental processes
remain unclear.
'Early RA' is a clinical term referring to the early stage of RA
used to predict the eventual progression stage of RA. The
American College of Rheumatology (ACR) 1987 classification
criteria for RA [3] have often been used as a diagnostic tool in
patients with recent-onset arthritis. However, these criteria
ACR = American College of Rheumatology; IFN = interferon; IL = interleukin; LCM = laser capture microdissection; OA = osteoarthritis; RA = rheu-
matoid arthritis; SAM = significance analysis of microarrays; SSC = saline sodium citrate; TNF = tumor necrosis factor.
Arthritis Research & Therapy Vol 7 No 4 Tsubaki et al.
R826
were developed in a population of patients selected according
to their disease status to classify rather than to diagnose RA.
Thus, the diagnostic usefullness of these criteria in early arthri-
tis is probably not optimal. Likewise, previous histopathologi-
cal studies have been inconclusive with respect to elucidating
histological features typical of early RA [4-6]. Therefore, stud-
ies of potential molecular changes in the synovium of patients
with early RA may improve our understanding of this disease
entity and aid diagnosis in the future.
Biopsy targeting of articular lesions in synovial tissues should
be a powerful tool for clarifying the initial events of synovitis in
RA. Immunohistochemical analyses of synovitis in RA using
targeted biopsy specimens have shown that the histopatho-
logical features of synovium in early RA are representative of
those in long-standing RA [7,8], suggesting quantitative rather
than qualitative differences between various forms of synovitis
in RA [9,10]. Laser capture microdissection (LCM) and extrac-
tion of total RNA followed by a cDNA microarray are tech-
niques that have been developed mainly in molecular oncology
and are used for clarifying molecular markers that have the
potential to predict metastasis, sensitivity to drugs, and prog-
nosis [11,12]. The use of these techniques to study the his-
topathogenesis of the initial step of synovitis in RA and its
progression should improve our understanding at the molecu-
lar level.
In this study, we focused on the analysis of gene-expression
profiles characteristic of proliferative lesions in the synovial lin-
ing tissues, which are one of the initial histopathological
events of synovitis in early RA. That is, we prepared synovial
specimens from early RA by targeted biopsy under arthros-
copy, and analyzed gene-expression profiles in the synovial lin-
ing tissues selected by LCM in a cDNA microarray by
comparing those in multilayered lining tissues with those in
normal-like lining tissues in each case. On the basis of a clus-
ter analysis, we propose that the synovial proliferative lesions
in early RA can be classified into at least two groups. We dis-
cuss the histopathological manifestations characteristic of
rheumatoid synovitis in these two groups and also the possible
differences in pathogenesis and prognosis of synovitis
between them.
Materials and methods
Patients and tissue samples
We studied 12 patients with early RA (duration of less than 1
year before the diagnosis), and 4 with long-standing RA (dura-
tion of more than 3 years before the diagnosis). Not all patients
with early RA could be accurately diagnosed at the time of tar-
geted biopsy, although diagnosis was possible with follow-up
assessments. All patients had arthritis of the knee and fulfilled
the ACR criteria for RA [3] except E-09 (early RA case no. 9)
(see Table 1). Written, informed consent was obtained from
each patient before they were entered into the study.
Synovial specimens in early RA were obtained from knee joints
by targeted biopsy under arthroscopy, and specimens from
long-standing RA were obtained by total knee arthroplasty at
the Center for Rheumatic Disease, Matsuyama Red Cross
Hospital. The number of specimens obtained from each
patient and the macroscopic signs of synovitis with the maxi-
mum inflammatory activity at biopsy sites are shown in Table
1. For intraindividual comparison, normal-like synovial speci-
mens that were macroscopically thin and translucent and con-
tained only a few vessels were also obtained from each patient
[13].
Histopathology
One-half of each synovial specimen was used for histopatho-
logical analysis. The tissue specimens were fixed with 10%
formalin in 0.01 mol/l phosphate buffer, pH 7.2, and embed-
ded in paraffin wax. They were stained with hematoxylin and
eosin for examination by light microscopy. Histopathological
parameters of synovitis were evaluated in accordance with
established criteria [14], with modifications involving the
degree of proliferation of synovial cells, typical palisading of
synovial cells in the intimal lining layers, non-foreign-body-type
giant cells in the lining regions, lymphoid and plasma cell infil-
tration, neovascularization, mesenchymoid transformation, and
fibrinoid necrosis in synovium. Of these features, the degree of
proliferation of synovial cells was scored as follows: fewer than
three layers (0), three to four layers (1), five to six layers (2), or
more than six layers (3). Lymphoid cell infiltration was scored
as follows: none to diffuse infiltration (0), lymphoid cell aggre-
gates (1), lymphoid follicles (2), or lymphoid follicles with ger-
minal center formation (3). The other features were evaluated
using a quantitative grading system consisting of a 4-point
scale: none (0), mild (1), moderate (2), or severe (3). The max-
imum score with this system was 24. The results of scoring of
each histopathological feature are presented as the highest
score among all the specimens for the patient. The remaining
half of the synovial specimen showing the highest score in the
feature 'proliferation of synovial cells' was used as multilayered
lining tissue for LCM. Nearly normal synovial tissues from the
same patient that had no inflammatory lesions and received a
score of 0 for all of the histopathological features were used
as 'normal-like lining tissue' for LCM.
Laser capture microdissection
The tissue samples were placed in embedding medium (Tis-
sue-Tek OCT Compound, Sakura Finetechnical, Tokyo, Japan)
and immediately snap frozen in acetone/dry ice in the operat-
ing room before transport to the laboratory. All cryoblocks
were stored at -80°C until 7-µm-thick cryosections were pre-
pared and mounted on a 1.35-µm-thick polyethylene mem-
brane (PALM, Wolfratshausen, Germany). The sections were
immediately fixed for 3 min with acetone and for 1 min with
70% ethanol and then stained rapidly for 1 min with His-
toGene™ staining solution (Arctrus, BM Equipment Co Ltd,
Tokyo, Japan). They were washed with distilled water and
Available online />R827
were then dehydrated with 100% ethanol and air-dried with a
fan for 3 min.
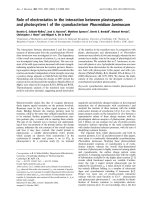
LCM was done to collect small regions from a specimen using
a Robot-Microbeam (PALM) and an inverted microscope (Carl
Zeiss, Oberkochem, Germany) [15]. In brief, the specimen
was set on a computer-controlled microscope stage and
observed from the upper side with a charged-coupling device
(CCD) camera. The image was displayed, and the multilayered
lining tissue and the normal-like lining tissue of the same case
were selected using the computer mouse (Fig. 1a,d). We
traced around the lining and then dissected it to the bottom of
the specimen together with the thin membrane, using a laser
microbeam through the objective lens (Fig. 1b,e). The selected
tissue was then catapulted with a single laser shot into a
microcentrifuge cap (0.6 ml), which was held by the microma-
nipulator (Fig. 1c,f). More than 5,000 cells in each specimen
were dissected and pooled for RNA extraction.
RNA extraction and T7-based RNA amplification
Total RNA was extracted from the samples collected by LCM
using an RNeasy spin column purification kit (Qiagen, Hilden,
Germany) in accordance with the manufacturer's procedure.
To remove possible genomic DNA contamination, RNase-free
DNase (Qiagen) was used during the RNA purification steps.
Messenger RNA was then amplified by bacteriophage T7
RNA polymerase using a RiboAmp™RNA amplification kit
(Arctrus). Two or three rounds of in vitro amplification were
done with the samples. The amplified RNAs from each multi-
layered lining tissue and normal-like lining tissue of each case
were reverse-transcribed using the SuperScript preamplifica-
tion system (Life Technologies, Rockville, MD, USA) with ran-
dom hexamers in the presence of Cy5-dCTP and Cy3-dCTP
(Amersham Biosciences Co, Piscataway, NJ, USA),
respectively.
cDNA microarray
A cDNA microarray was fabricated with 23,040 cDNAs
selected from the UniGene database of the National Center
for Biotechnology />. The cDNAs
were amplified by RT-PCR using poly(A) + RNAs isolated from
various human organs as templates. The PCR products were
spotted in duplicate on type VII glass slides (Amersham Bio-
Table 1
Characteristics of studied patients with early (E) and long-standing (L) rheumatoid arthritis (RA)
Patient Age Sex Disease duration ACR criterion nos.
fulfilled
a
Number of samples Macroscopic signs
of synovitis
With early RA
E-01 51 F 11 months 1, 2, 3, 4 13 Vi, Ve
E-02 50 F 2 months 1, 2, 3, 4, 6 8 Vi, Ve
E-03 34 F 4 months 1, 2, 3, 4, 7 8 Vi, Ve
E-04 34 F 3 months 1, 2, 3, 4, 6, 7 13 Vi, Ve
E-05 77 F 2 months 1, 2, 3, 4, 7 11 Vi
E-06 50 M 4 months 1, 2, 3, 4 11 Vi, Ve
E-07 37 F 7 months 1, 2, 3, 4, 6 6 Ve
E-08 61 F 2 months 1, 2, 3, 4 7 Vi
E-09 75 F 4 months 1, 4, 6 12 Vi, Ve, Gr
E-10 25 F 12 months 1, 2, 3, 4 12 Vi, Ve, Gr
E-11 54 M 12 months 1, 2, 3, 4, 6 11 Ve
E-12 60 F 4 months 1, 2, 3, 4, 6 13 Vi, Ve, Gr
With long-standing RA
L-01 54 M 9 years 1, 2, 3, 4, 6, 7 6 Vi, Ve, Gr
L-02 77 M 5 years 1, 2, 3, 4, 5, 6, 7 8 Vi, Ve, Gr
L-03 54 F 7 years 1, 2, 3, 4, 6, 7 6 Vi, Ve
L-04 55 F 3 years 1, 2, 3, 4, 6, 7 11 Vi, Ve, Gr
a
ACR (American College of Rheumatology) criteria: 1, morning stiffness; 2, arthritis of three or more joint areas; 3, arthritis of hand joints; 4,
symmetric arthritis; 5, rheumatoid nodules; 6, serum rheumatoid factor; 7, radiographic changes. F, female; Gr, granulation; M, male; Ve, increased
number of vessels; Vi, villi.
Arthritis Research & Therapy Vol 7 No 4 Tsubaki et al.
R828
sciences) with a Microarray Spotter Generation III (Amersham
Biosciences).
Labeled probes were mixed with Microarray Hybridization
Solution Version 2 (Amersham Biosciences) and formamide
(Sigma Chemical Co, St Louis, MO, USA) to a final concentra-
tion of 50%. After hybridization for 14 to 16 hours at 42°C, the
slides were washed for 10 min at 55°C in 2 X saline sodium
citrate (SSC) and 1% SDS, for 10 min at 55°C in 0.2 X SSC
and 0.1% SDS, and for 1 min at room temperature in 0.1 X
SSC. They were then scanned using an Array Scanner Gener-
ation III (Amersham Biosciences). The fluorescence intensities
of Cy5 and Cy3 for each target spot were evaluated photomet-
rically by the ArrayVision computer program (Amersham Bio-
sciences). Since data derived from low signal intensities are
less reliable, a cutoff value for signal intensities of 10,000 was
used.
Cluster analysis
To obtain reproducible clusters for classifying the 16 samples,
we selected 1,035 genes for which valid expression data were
obtained in all the experiments, and which included an up-reg-
ulated (Cy5/Cy3 >2) or down-regulated gene (Cy5/Cy3 <0.5)
in at least two of all samples. The analysis was performed
using Cluster 3.0 and TreeView software written by M Eisen
and updated by Michiel de Hoon, and available on the World
Wide Web />restech.shtml. Before the clustering algorithm was applied, the
fluorescence ratio for each spot was log-transformed (base 2).
Then the data were median-centered and normalized for each
sample, to remove experimental biases.
Statistical analysis
Euclidean distance was used to determine the differences
between expression levels of individual genes. Statistical anal-
ysis on microarray data was performed using the significance
analysis of microarrays (SAM) method, available on the World
Wide Web />.
The fold change in expression was calculated for each gene
between groups, and significance levels were indicated by the
Q value. A Q value less than 5% was considered significant.
A t-test was used to confirm the results by SAM. A P value less
than 0.05 was considered significant. The Mann–Whitney U
test was used to test for differences in histological scores and
disease duration between groups.
Results
Histopathological features of synovitis with variations
The histopathology of the early RA specimens showed regular
variations. The histological score for each lesion is summa-
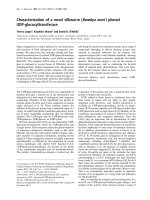
rized in Table 2. For example, as shown in Fig. 2, in E-02 the
proliferation of synovial lining cells resulted in fewer than four
layers (score 1), and a typical palisading structure of the lining
cells was not clear (score 1); there was diffuse infiltration of
lymphocytes in the sublining regions (score 0). In E-07, the
proliferative lining contained fewer than four layers (score 1)
but showed a typical palisading structure (score 2).
Figure 1
Laser capture microdissection of synovial lining regions with normal-like lining or multilayered liningLaser capture microdissection of synovial lining regions with normal-like lining or multilayered lining. (a,d)before microdissection; (b,e) after
tracing around the lining regions together with the intimal lining layer, using a laser microbeam; (c,f) catapulted into a microcentrifuge tube by the
micromanipulator with a single, precisely aimed laser shot.
Available online />R829
Some cases of early RA manifested synovitis, in which the his-
topathological features were similar to those of long-standing
RA such as L-01. In E-12, the specimen showed proliferation
of synovial lining cells, forming 5 to 6 layers (score 2), associ-
ated with a typical palisading structure (score 2), and there
were foci of lymphocyte aggregates in the sublining regions,
resembling lymphoid follicles but lacking germinal centers
(score 1). Many plasma cells were involved in these lesions
(score 3) (Fig. 2). Partial fibrinoid necrosis was also present
(score 1).
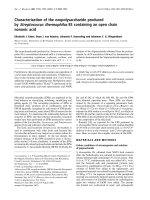
Gene-expression profiles and clustering
As shown in Fig. 3, 18 samples from 16 cases were clustered
into two major groups based on their gene-expression profiles.
The dendrogram shown at the top of Fig. 3 represents similar-
ities in expression patterns among individual cases, with
shorter branches indicating greater similarities. Two cases (E-
07 and E-08), which were examined with two and three rounds
of amplification, were clustered most closely, supporting the
reliability of our RNA amplification procedures. Of the 16
cases, ten (L-01, L-04, L-02, E-01, E-10, E-04, L-03, E-06, E-
12, and E-09) clustered into one group (I) and the other six (E-
03, E-02, E-08, E-07, E-05, and E-11) clustered into another
group (II). The clustering analysis of only the cases with early
RA, not including those with long-standing RA, gave results
similar to those shown in Fig. 3. (The result is attached as
Additional file 1). Moreover, there was no significant difference
in disease duration of the cases with early RA in groups I and
II (P = 0.34 on the Mann–Whitney test). Each group appeared
to have a specific gene-expression profile that should explain
the molecular nature of their etiological differences.
Candidate gene profiles in each group
Using the SAM software, we examined 1,035 genes to find
which were expressed significantly differently in groups I and
II. We found that the expression of 180 genes was significantly
increased and that of 235 was significantly decreased in
group II versus group I (Q value <5%). From these genes, we
Table 2
Histological scores in patients with early (E) and long-standing (L) rheumatoid arthritis (RA)
Group I Group II
Histological
feature
L-01 L-04 L-02 E-01 E-10 E-04 L-03 E-06 E-12 E-09 E-03 E-02 E-08 E-07 E-05 E-11
Proliferation of
synovial cells
3211122222112121
1.80 ± 0.63 (1.67 ± 0.52) 1.33 ± 0.52
Typical palisading3332222123112220
2.30 ± 0.68*(2.00 ± 0.63) 1.33 ± 0.82
Non-foreign-body
giant cells
2331211121131200
1.70 ± 0.82 (1.33 ± 0.52) 1.17 ± 0.48
Lymphoid cell
infiltration
3130212112000000
1.60 ± 0.97
†
(1.17 ± 0.75*) 0.00 ± 0.00
Plasma cell
infiltration
3330323133001000
2.40 ± 1.08
†
(2.00 ± 1.27*) 0.17 ± 0.41
Neovascularizatio
n
2222223223332213
2.20 ± 0.42 (2.17 ± 0.41) 2.33 ± 0.82
Mesenchymoid
transformation
1120001003000000
0.80 ± 1.03 (0.50 ± 1.23) 0.00 ± 0.00
Fibrinoid necrosis1320001012001010
1.00 ± 1.05 (0.50 ± 0.84) 0.33 ± 0.52
Total 18 18 19 6 12 10 15 8 13 19 6 8 9 7 6 4
13.80 ± 4.76
†
(11.33 ± 4.37*) 6.67 ± 1.75
The value in the upper row is the histological score of each case. More than 6 samples were taken from each patient for the feature studied. The
value in the lower row is the mean ± standard deviation for the group. Values in parentheses (group I) are those for only the patients with early RA.
†
P <0.01, *P <0.05 versus group II on the Mann–Whitney test. ACR, American College of Rheumatology.
Arthritis Research & Therapy Vol 7 No 4 Tsubaki et al.
R830
selected ones that were of interest on the basis of the data
previously reported regarding the mechanisms of rheumatoid
synovitis and on the positional candidate genes obtained from
our genome data from arthritis models as described in the Dis-
cussion. As shown in Table 3A, the genes encoding caspase
9 (CASP9), p53 induced gene 11 (TP53I11, also called
PIG11), cathepsin G (CTSG), colony-stimulating factor 2
receptor, β (CSF2RB), tumor necrosis factor receptor
superfamily member 1A (TNFRSF1A), and interleukin-10
receptor, β (IL10RB) were expressed more abundantly in
group II than in group I (Q < 5%, P <0.05). On the other hand,
the genes encoding fibronectin 1 (FN1), β2-microglobulin
(B2M), syndecan 2 (SDC2), cathepsin B (CTSB), signal
transducer and activator of transcription 1 (STAT1), integrin,
β2 (ITGB2), and interferon γ receptor 2 (IFNGR2) were
expressed more abundantly in group I than in group II (Q <
5%, P <0.05) (Table 3B).
Comparative study of histopathological features
There were significant differences in the histological scores of
groups I and II (Table 2). The mean total score for group I
(13.80) was significantly higher than that for group II (6.67).
The mean group I scores for 'typical palisading', 'lymphoid cell
infiltration', and 'plasma cell infiltration' were all significantly
Figure 2
Histopathological features of synovium in patients with early (E) or long-standing (L) rheumatoid arthritisHistopathological features of synovium in patients with early (E) or long-standing (L) rheumatoid arthritis. (E-02) The proliferation of synovial
lining cells resulted in fewer than four layers. There is diffuse infiltration of macrophages in the sublining regions. (E-07) The proliferative lining layer
shows a typical palisading structure of the intimal lining layer. (E-12) The specimen shows proliferation of synovial lining cells, in places to more than
five layers, associated with a typical palisading structure and several non-foreign-body-type giant cells. The lesions manifest underlying proliferation
of blood vessels at the arteriole level, associated with many cell infiltrates composed of lymphocytes and plasma cells in the sublining regions. There
are foci of lymphocyte aggregates, close to postcapillary venules, resembling lymphoid follicles, but lacking germinal centers. (L-01) In contrast to E-
12, there are lymphoid follicles with germinal centers.
Available online />R831
Figure 3
Dendrogram of two-dimensional hierarchical clustering analysis of 1,035 genes from patients with rheumatoid synovitisDendrogram of two-dimensional hierarchical clustering analysis of 1,035 genes from patients with rheumatoid synovitis. Red represents rel-
ative expression greater than the median expression level among all samples, and green represents relative expression lower than the median expres-
sion level. The color intensity represents the magnitude of the deviation from the median. Black indicates unchanged expression. On the horizontal
axis, 18 samples from rheumatoid synovitis were clustered into two major groups. On the vertical axis, the 1,035 genes were clustered in different
branches according to similarities in their relative expression ratios.
Arthritis Research & Therapy Vol 7 No 4 Tsubaki et al.
R832
higher than those for group II. Moreover, in the comparative
study of only the cases with early RA, the mean total score and
the mean scores for 'lymphoid cell infiltration' and 'plasma cell
infiltration' in were significantly higher in group I than in group
II. There were no differences between groups I and II in other
histopathological features.
Discussion
There are several reports about gene-expression profiles in
rheumatoid synovitis. The analysis by Zanders and colleagues
[16] showed an overall increased expression of inflammation-
related genes in synovial tissues in RA compared with normal
synovium. However, those authors performed the analysis on
pooled RA synovial tissues and pooled tissues from healthy
controls. Their approach did not consider disease heterogene-
ity, which may have obscured differences between tissues.
Van der Pouw Kraan and colleagues [17] reported that RA
synovial tissues could be separated into two patterns of gene
expression. The first one had a gene-expression profile con-
sistent with inflammation and active immunity, and the second,
which was histopathologically similar to that in osteoarthritis
(OA) tissues, exhibited a low level of expression of inflamma-
tory and immune system genes and instead expressed genes
related to tissue remodeling. However, their study was per-
formed with whole synovial tissues obtained at synovectomy
from long-standing RA and OA patients. Therefore, it may be
difficult to use these results to elucidate the developmental
process of rheumatoid synovitis.
In this study, we analyzed gene-expression profiles in prolifer-
ative lesions of the synovial lining tissues in early RA using tar-
geted biopsy of synovial tissues and LCM, followed by a cDNA
microarray. We showed that synovitis in early RA could be
divided into at least two different groups based on the gene-
expression profiles, although their histopathologies were com-
plex. Group I included the cases with long-standing RA, and
some of its synovitis histopathological features were signifi-
cantly different from those of group II, including lymphoid cell
and plasma cell infiltration. Features that seemed to be char-
acteristic of RA, such as synovial cell proliferation in the lining
layers, palisading structure of the intimal lining layers, non-for-
eign-body-type giant cells in the lining regions, neovasculariza-
tion, and fibrinoid necrosis, were not significantly different in
the two groups. On the basis of these findings, we speculate
that the two groups may reflect differences in the pathogene-
sis of synovitis. The different expression profiles of several can-
didate genes for RA reported previously may support this idea.
Cytokine networks
Synovial macrophages and fibroblasts in the lining tissue pro-
duce factors that activate adjacent cells and enhance synovial
inflammation in both paracrine and autocrine fashion [18].
Table 3
Comparison of the expression of selected genes in two groups of patients with rheumatoid arthritis
a
Candidate gene Group I
b
Group II
b
Q (%) P
c
A – Expressed at higher levels in group II than in group I
CASP9 -0.029 ± 0.018 0.020 ± 0.014 0.25 <0.001
PIG11 -0.025 ± 0.021 0.024 ± 0.017 0.25 <0.001
CTSG -0.018 ± 0.024 0.031 ± 0.021 0.25 0.001
CSF2RB -0.020 ± 0.024 0.019 ± 0.021 0.61 0.006
TNFRSF1A -0.023 ± 0.029 0.015 ± 0.016 0.77 0.010
IL10RB -0.021 ± 0.027 0.017 ± 0.021 0.90 0.012
B – Expressed at higher levels in group I than in group II
FN1 0.023 ± 0.018 -0.030 ± 0.019 0.25 <0.001
B2M 0.020 ± 0.023 -0.028 ± 0.022 0.25 0.001
SDC2 0.023 ± 0.024 -0.024 ± 0.021 0.25 0.001
CTSB 0.006 ± 0.019 -0.036 ± 0.026 0.84 0.002
STAT1 0.021 ± 0.031 -0.020 ± 0.014 1.19 0.008
ITGB2 0.021 ± 0.025 -0.018 ± 0.023 1.51 0.008
IFNGR2 0.019 ± 0.026 -0.016 ± 0.026 3.28 0.022
a
Statistical analysis on microarray data was performed using the significance analysis of microarrays (SAM) method (see Materials and methods).
Q, which is the lowest false discovery rate, was considered significant at less than 5%. It is similar to the familiar P value, but adapted to the
analysis of a large number of genes.
b
Means ± standard deviations for the group, using log-transformed and median-centered microarray data.
c
Values calculated by t-test. P <0.05 was considered significant.
Available online />R833
Synovial macrophages activated by tumor necrosis factor α
(TNF-α) can increase the production of IL-10. This interleukin
has anti-inflammatory effects through its receptor, IL-10R,
which is up-regulated on synovial macrophages by TNF-α. IL-
10R signaling suppresses the production of IL-1β and TNF-α.
The presence of IL-10 may suppress the production of IFNγ by
T cells in the synovial tissue [19]. Our study suggests that a
negative feedback mechanism by anti-inflammatory cytokines
such as IL-10 is predominant in group II, in light of the higher
expression of TNFRSF1A and IL10RB (Table 3A). Thus, IL-10
may play regulatory roles in the progression of synovitis in the
early stage of RA.
Synovial macrophages and fibroblasts are strongly activated
to express high amounts of IFNγ-inducible genes, despite a
low concentration of extracellular IFNγ [20,21]. STAT1 is one
of the IFNγ-inducible genes. Recently, it was reported that
STAT1 protein expression was elevated in rheumatoid synovi-
tis, especially in the lining layer containing highly activated
macrophages [17,22]. IFNγ, even in a low concentration, can
induce sustained expression of STAT1 through its het-
erodimeric receptor complex consisting of IFNγ receptors 1
and 2 (IFNGR1 and IFNGR2) [23]. In our study, the signal
intensity of IFNG itself was very low in all samples (data not
shown), while IFNγ-inducible genes such as STAT1 and B2M
were more abundantly expressed in group I (Table 3B). Thus,
the effect of IFNγ in rheumatoid synovitis may be evaluated
indirectly by the expression profiles of these IFNγ-inducible
genes. Considering that infiltrating T cells in the rheumatoid
synovium in the early stage of RA are predominantly T helper
type 1 cells [8], our findings that the degree of lymphoid cell
infiltration was significantly different in the two groups (Table
2) may support this idea.
Adhesion molecules
There are several histological studies showing the expression
of extracellular matrices and integrins in rheumatoid synovitis
[24-27]. These adhesion molecules may contribute to a posi-
tive feedback mechanism in the cytokine networks [27-29]. In
our study, fibronectin 1 was more abundantly expressed in
group I than in group II (Table 3B). In the whole genome anal-
ysis of rheumatic-disease-susceptibility loci in MRL/lpr mice,
Sdc2 (encoding syndecan 2) was a candidate gene for pro-
gressive arthritis [30]. This was highly expressed in group I in
this study. Itgb2 was a candidate gene for enthesopathy [31]
and coincidentally for sialoadenitis [32], and was also highly
expressed in group I.
Cathepsins
CTSB, the gene for cathepsin B, one of the cysteine pro-
teases, was more abundantly expressed in group I than in
group II (Table 3B). This protease, which can cleave collagens
and proteoglycans, is thought to have a prominent role in
destructive arthropathies [33]. It is spontaneously expressed
in cultured synovial fibroblasts and can be increased by TNF-
α, IL-1, and IFNγ [34,35]. Immunolocalization studies showed
cathepsin B to be expressed predominantly in synovial cells
attached to the cartilage and bone at sites of rheumatoid joint
erosion [33,36]. Taken together, these observations suggest
the development of cartilage degeneration and bone resorp-
tion in group I, possibly in the progression stage.
On the other hand, CTSG, the gene for cathepsin G, one of
the serine proteases, was more abundantly expressed in
group II than in group I (Table 3A). This protease is normally
associated with myeloid cells such as neutrophils and macro-
phages and can be induced by TNF-α [37]. It has been shown
that cathepsin G proteolytically activates caspase 7 [38], an
intracellular cysteine proteinase, and, more recently, that it has
a role in apoptosis through cleavage of substrates regulating
chromatin conformation [39]. This suggests that apoptosis
may be impaired in group I.
p53 tumor suppressor gene
Although RA has many features of autoimmunity, nonimmuno-
logic factors also play a significant role, especially in the pro-
gression stage [40-42]. Rheumatoid synovial tissues and
synovial fibroblasts exhibit some features of transformation,
including autonomous invasion into cartilage, expression of
oncogenes, loss of contact inhibition, and insufficient apopto-
sis [41-44]. p53 protein is induced by many genotoxic
stresses, which leads to cell cycle arrest and apoptosis of the
injured cells [45]. In our study, CASP9 [46] and PIG11 [47],
which encode proteins involved in apoptosis as downstream
targets of p53, were abundantly expressed in group II, but not
in group I (Table 3A).
Reactive oxygen and nitrogen species produced at chronic
inflammatory sites may damage DNA. If the p53 gene itself
gets damaged, apoptosis may be impaired. The p53 mutations
are dominant negative and can interfere with endogenous
wild-type p53 function [48]. Significantly higher expression of
p53 is detected in rheumatoid synovial tissues than in those
tissues in patients with OA or reactive arthritis [49]. Of inter-
est, p53 was found in early RA and also in clinically uninvolved
joints in RA patients [50]. Yamanishi and colleagues [51]
showed that abundant p53 transition mutations, which are
characteristic of the DNA damage caused by oxidative stress,
were located mainly in the lining tissues, in studies using
microdissected rheumatoid synovial tissues. Considering
these findings, mutant p53 may be over expressed in the mul-
tilayered lining in group I, which fails to induce CASP9 and
PIG11, while wild-type p53 in group II may induce these
genes in group II.
The results of the study suggest that a combination of histopa-
thology and gene-expression profiling is a useful tool for diag-
nostic and prognostic studies of early RA. For example,
patients E-01 and E-06 had a few histopathological features
specific for RA and showed lower total scores in histopatho-
Arthritis Research & Therapy Vol 7 No 4 Tsubaki et al.
R834
logical features (Table 2), despite the fact that the villous syn-
ovial tissues were targeted and examined. However, these
patients belonged to group I with respect to their gene-expres-
sion profiles. Their disease might advance to the progression
stage, the same as the cases of long-standing RA, but differ-
ent from those in group II. Patient E-05 was a 77-year-old
woman who had polyarthralgia associated with marked pitting
edema of the dorsum of the hands. The serological tests gave
negative results except for mild elevation of erythrocyte
sedimentation rate and C-reactive protein. These clinical man-
ifestations could not rule out the possibility of remitting seron-
egative symmetrical synovitis with pitting edema syndrome
(RS3PE) originally described by McCarty and colleagues [52].
This case had a few histopathological features specific for RA
except for the proliferation of synovial lining cells associated
with a typical palisading structure and it had lower total scores
and belonged to group II.
Additional studies will be needed to compare gene-expression
profiles of such a case in group II with those of other synovitis
diseases such as reactive arthritis and OA, especially with
respect to the candidate genes described above. Follow-up
studies will be conducted to investigate potential differences
in the clinical course of cases in groups I and II.
Conclusion
In this study, we analyzed gene-expression profiles in the syn-
ovial lining tissues in situ in early RA using synovial specimens
obtained by targeted biopsy, followed by LCM and cDNA
microarray analyses. Based on cluster analysis, we found at
least two groups in synovitis in early RA, one of which resem-
bled that in long-standing RA. This grouping may reflect differ-
ences in the histopathogensis of synovitis in early RA. Different
expression profiles of the several candidate genes may pro-
vide useful information for future studies of the diagnosis and
prognosis of early RA.
Competing interests
The author(s) declare that they have no competing interests.
Authors' contributions
TT carried out critical examinations in this study, especially
synovial targeted biopsy, histopathological analyses, laser
capture microdissection, and cluster analysis, and drafted the
manuscript as a part of his doctoral thesis, with the assistance
of the coauthors. NA prepared histological specimens and
carried out laser capture microdissection. TK and TS carried
out RNA extraction, the amplification, and a cDNA microarray.
HY gave critical suggestions concerning orthopedics. NT, KY,
SN, and SY carried out the clinical studies of each case and
performed targeted biopsy of synovial tissues with the
informed consent of the patients. MN conceived of the study,
participated in its design and coordination, and is the corre-
sponding author. All authors read and approved the final
manuscript.
Additional files
Acknowledgements
We wish to thank Dr Herbert M Schulman for critically reviewing the
manuscript.
References
1. Zvaifler NJ: The immunopathology of joint inflammation in
rheumatoid arthritis. Adv Immunol 1973, 16:265-336.
2. Fassbender HG: Histomorphological basis of articular carti-
lage destruction in rheumatoid arthritis. Coll Relat Res 1983,
3:141-155.
3. Arnett FC, Edworthy SM, Bloch DA, McShane DJ, Fries JF, Cooper
NS, Healey LA, Kaplan SR, Liang MH, Luthra HS, et al.: The Amer-
ican Rheumatism Association 1987 revised criteria for the
classification of rheumatoid arthritis. Arthritis Rheum 1988,
31:315-324.
The following Additional files are available online:
Additional File 1
A PDF showing a dendrogram of two-dimensional
hierarchical clustering analysis of 1,035 genes among
12 patients with early rheumatoid arthritis (RA), not
including the cases with long-standing RA. On the
horizontal axis, 12 samples from early RA are clustered
into two major groups. The results were similar to those
shown in Fig. 3. This may indicate that there was no
influence of the cases with long-standing RA in the
cluster analysis.
See />supplementary/ar1751-S1.pdf
Additional File 2
A PDF file showing the results of RT-PCR of multilayered
lining tissues. (A) Signal intensity of candidate genes in
microarray of the four cases of early RA; (B) their RT-
PCR results. The expression levels of these genes
themselves seemed to be well correlated in the two
assays.
See />supplementary/ar1751-S2.pdf
Additional File 3
A PDF file showing dendrograms of two-dimensional
hierarchical clustering analysis with two different
similarity measures and with two kinds of cutoff value for
signal intensities among 18 samples from the 16 cases
of rheumatoid synovitis. (Similarity measures: Euclidean
distance and Pearson correlation coefficient. Cutoff
value for signal intensities: 10,000 and 20,000.) There
was no major difference between them regarding the
cases belonging to each group.
See />supplementary/ar1751-S3.pdf
Available online />R835
4. Schumacher HR, Kitridou RC: Synovitis of recent onset: a clin-
icopathologic study during the first month of disease. Arthritis
Rheum 1972, 15:465-485.
5. Konttinen YT, Bergroth V, Nordstrom D, Koota K, Skrifvars B, Hag-
man G, Friman C, Hamalainen M, Slatis P: Cellular immunohis-
topathology of acute, subacute, and chronic synovitis in
rheumatoid arthritis. Ann Rheum Dis 1985, 44:549-555.
6. Kraan MC, Versendaal H, Jonker M, Bresnihan B, Post WJ, Hart
BA, Breedveld FC, Tak PP: Asymptomatic synovitis precedes
clinically manifest arthritis. Arthritis Rheum 1998,
41:1481-1488.
7. Goldenberg DL, Cohen AS: Synovial membrane histopathology
in the differential diagnosis of rheumatoid arthritis, gout,
pseudogout, systemic lupus erythematosus, infectious arthri-
tis and degenerative joint disease. Medicine (Baltimore) 1978,
57:239-252.
8. Smeets TJM, Dolhain RJ, Breedveld FC, Tak PP: Analysis of the
cellular infiltrates and expression of cytokines in synovial tis-
sue from patients with rheumatoid arthritis and reactive
arthritis. J Pathol 1998, 186:75-81.
9. Hitchon CA, El-Gabalawy HS: Immune features of seronegative
and seropositive arthritis in early synovitis studies. Curr Opin
Rheumatol 2002, 14:348-353.
10. Tak PP, Smeets TJM, Daha MR, Kluin PM, Meijers KA, Brand R,
Meinders AE, Breedveld FC: Analysis of the synovial cell infil-
trate in early rheumatoid synovial tissue in relation to local dis-
ease activity. Arthritis Rheum 1997, 40:217-225.
11. Kikuchi T, Daigo Y, Katagiri T, Tsunoda T, Okada K, Kakiuchi S,
Zembutsu H, Furukawa Y, Kawamura M, Kobayashi K, et al.:
Expression profiles of non-small cell lung cancers on cDNA
microarrays: Identification of genes for prediction of lymph-
node metastasis and snsitivity to anti-cancer drugs. Oncogene
2003, 22:2192-2205.
12. He P, Varticovski L, Bowman ED, Fukuoka J, Welsh JA, Miura K,
Jen J, Gabrielson E, Brambilla E, Travis WD, et al.: Identification
of carboxypeptidase E and gamma-glutamyl hydrolase as
biomarkers for pulmonary neuroendocrine tumors by cDNA
microarray. Hum Pathol 2004, 35:1196-1209.
13. Lindblad S, Hedfors E: Intraarticular variation in synovitis; Local
macroscopic and microscopic signs of inflammatory activity
are significantly correlated. Arthritis Rheum 1985, 28:977-986.
14. Koizumi F, Matsuno H, Wakaki K, Ishii Y, Kurashige Y, Nakamura
H: Synovitis in rheumatoid arthritis: Scoring of characteristic
histopathological features. Pathol Int 1999, 49:298-304.
15. Nakatani K, Fujii H, Hasegawa H, Terada M, Arita N, Ito MR, Ono
M, Takahashi S, Saiga K, Yoshimoto S, et al.: Endothelial adhe-
sion molecules in glomerular lesions: association with their
severity and diversity in lupus models. Kidney Int 2004,
65:1290-1300.
16. Zanders ED, Goulden MG, Kennedy TC, Kempsell KE: Analysis of
immune system gene expression in small rheumatoid arthritis
biopsies using a combination of subtractive hybridization and
high-density cDNA arrays. J Immunol Methods 2000,
233:131-140.
17. Van der Pouw Kraan TCTM, van Gaalen FA, Kasperkovitz PV, Ver-
beet NL, Smeets TJM, Kraan MC, Fero M, Tak PP, Huizinga TWJ,
Pieterman E, et al.: Rheumatoid arthritis is a heterogeneous
disease; evidence for differences in the activation of the STAT-
1 pathway between rheumatoid tissues. Arthritis Rheum 2003,
48:2132-2145.
18. Firestein GS: Evolving concepts of rheumatoid arthritis. Nature
2003, 423:356-361.
19. Katsikis PD, Chu CQ, Brennan FM, Maini RN, Feldmann M: Immu-
noregulatory role of interleukin 10 in rheumatoid arthritis. J
Exp Med 1994, 179:1517-1527.
20. Firestein GS, Zvaifler NJ: Peripheral blood and synovial fluid
monocyte activation in inflammatory arthritis; II. Low levels of
synovial fluid and synovial tissue interferon suggest that
gamma-interferon is not the primary macrophage activating
factor. Arthritis Rheum 1987, 30:864-871.
21. Firestein GS, Zvaifler NJ: How important are T cells in chronic
rheumatoid synovitis?; II. T cell-independent mechanisms
from beginning to end. Arthritis Rheum 2002, 46:298-308.
22. Hu X, Herrero C, Li WP, Antoniv TT, Falck-Pedersen E, Koch AE,
Woods JM, Haines GK III, Ivashkiv LB: Sensitization of IFN-
gamma Jak-STAT signaling during macrophage activation. Nat
Immunol 2002, 3:859-866.
23. Larkin J 3rd, Johnson HM, Subramaniam PS: Differential nuclear
localization of the IFNGR-1 and IFNGR-2 subunits of the IFN-
gamma receptor complex following activation by IFN-gamma.
J Interferon Cytokine Res 2000, 20:565-576.
24. Clemmensen I, Holund B, Andersen RB: Fibrin and fibronectin in
rheumatoid synovial membrane and rheumatoid synovial fluid.
Arthritis Rheum 1983, 26:479-485.
25. Scott DL, Wainwright AC, Walton KW, Williamson N: Signifi-
cance of fibronectin in rheumatoid arthritis and osteoarthrosis.
Ann Rheum Dis 1981, 40:142-153.
26. Nikkari L, Aho H, Yli-Jama T, Larjava H, Jalkanen M, Heino J:
Expression of integrin family of cell adhesion receptors in
rheumatoid synovium. Am J Pathol 1993, 142:1019-1027.
27. Rinaldi N, Barth T, Henne C, Mechterscheimer G, Moller P: Syn-
oviocytes in chronic synovitis in situ and cytokine stimulated
synovial cells in vitro neo-express alpha 1, alpha 3 and alpha
5 chains of beta 1 integrins. Virchows Arch 1994, 425:171-180.
28. Ruoslahti E: Integrins. J Clin Invest 1991, 87:1-5.
29. Lin TH, Rosales C, Mondal K, Bolen JB, Haskill S, Juliano RL:
Integrin-mediated tyrosine phosphorylation and cytokine
message induction in monocytic cells. J Biol Chem 1995,
270:16189-16197.
30. Kamogawa J, Terada M, Mizuki S, Nishihara M, Yamamoto H, Mori
S, Abe Y, Morimoto K, Nakatsuru S, Nakamura Y, et al.: Arthritis
in MRL/lpr mice is under the control of multiple gene loci with
an allelic combination derived from the original inbred strains.
Arthritis Rheum 2002, 46:1067-1074.
31. Oishi H, Miyazaki T, Mizuki S, Kamogawa J, Lu LM, Tsubaki T, Arita
N, Ono M, Yamamoto H, Nose M: Accelerating effect of an MRL
gene locus on the severity and onset of arthropathy in DBA/1
mice. Arthritis Rheum 2005, 52:959-966.
32. Nishihara M, Terada M, Kamogawa J, Ohashi Y, Mori S, Nakatsuru
S, Nakamura Y, Nose M: Genetic basis of autoimmune sialad-
enitis in MRL/lpr lupus-prone mice: additive and hierarchical
properties of polygenic inheritance. Arthritis Rheum 1999,
42:2616-2623.
33. Trabandt A, Gay RE, Fassbender HG, Gay S: Cathepsin B in syn-
ovial cells at the site of joint destruction in rheumatoid
arthritis. Arthritis Rheum 1991, 34:1444-1451.
34. Huet G, Flipo RM, Colin C, Janin A, Hemon B, Collyn-d'Hooghe M,
Lafyatis R, Duquesnoy B, Degand P: Stimulation of the secretion
of latent cysteine proteinase activity by tumor necrosis factor
alpha and interleukin-1. Arthritis Rheum 1993, 36:772-780.
35. Lemaire R, Huet G, Zerimech F, Grard G, Fontaine C, Duquesnoy
B, Flipo RM: Selective induction of the secretion of cathepsins
B and L by cytokines in synovial fibroblast-like cells. Br J
Rheumatol 1997, 36:735-743.
36. Cunnane G, FitzGerald O, Hummel KM, Youssef PP, Gay RE, Gay
S, Bresnihan B: Synovial tissue protease gene expression and
joint erosions in early rheumatoid arthritis. Arthritis Rheum
2001, 44:1744-1753.
37. McGettrick AF, Barnes RC, Worrall DM: SCCA2 inhibits TNF-
mediated apoptosis in transfected Hela cells; the reactive cen-
tre loop sequence is essential for this function and TNF-
induced cathepsin G is a candidate target. Eur J Biochem 2001,
268:5868-5875.
38. Zhou Q, Salvesen GS: Activation of pro-caspase-7 by serine
proteases includes a non-canonical specificity. Biochem J
1997, 324:361-364.
39. Biggs JR, Yang J, Gullberg U, Muchardt C, Yaniv M, Kraft AS: The
human brm protein is cleaved during apoptosis: the role of
cathepsin G. Proc Natl Acad Sci USA 2001, 98:3814-3819.
40. Gay S, Gay RE, Koopman WJ: Molecular and cellular mecha-
nisms of joint destruction in rheumatoid arthritis: two cellular
mechanisms explain joint destruction? Ann Rheum Dis 1993,
52:S39-47.
41. Muller-Ladner U, Kriegsmann J, Franklin BN, Matsumoto S, Geiler
T, Gay RE, Gay S: Synovial fibroblasts of patients with rheuma-
toid arthritis attach to and invade normal human cartilage
when engrafted into SCID mice. Am J Pathol 1996,
149:1607-1615.
42. Firestein GS: Invasive fibroblast-like synoviocytes in rheuma-
toid arthritis; passive responders or transformed aggressors?
Arthritis Rheum 1996, 39:1781-1790.
43. Lafyatis R, Remmers EF, Roberts AB, Yocum DE, Sporn MB,
Wilder RL: Anchorage-independent growth of synoviocytes
from arthritic and normal joints; stimulation by exogenous
Arthritis Research & Therapy Vol 7 No 4 Tsubaki et al.
R836
platelet-derived growth factor and inhibition by transforming
growth factor-beta and retinoids. J Clin Invest 1989,
83:1267-1276.
44. Yamanishi Y, Firestein GS: Pathogenesis of rheumatoid arthri-
tis: the role of synoviocytes. Rheum Dis Clin North Am 2001,
27:355-371.
45. Yonish-Rouach E: The p53 tumour suppressor gene: a media-
tor of a G1 growth arrest and of apoptosis. Experientia 1996,
52:1001-1007.
46. Shen Y, White E: p53-dependent apoptosis pathways. Adv
Cancer Res 2001, 82:55-84.
47. Zhu J, Jiang J, Zhou W, Zhu K, Chen X: Differential regulation of
cellular target genes by p53 devoid of the PXXP motifs with
impaired apoptotic activity. Oncogene 1999, 18:2149-2155.
48. Tak PP, Zvaifler NJ, Green DR, Firestein GS: Rheumatoid arthri-
tis and p53: how oxidative stress might alter the course of
inflammatory diseases. Immunol Today 2000, 21:78-82.
49. Firestein GS, Nguyen K, Aupperle KR, Yeo M, Boyle DL, Zvaifler
NJ: Apoptosis in rheumatoid arthritis; p53 overexpression in
rheumatoid arthritis synovium. Am J Pathol 1996,
149:2143-2151.
50. Tak PP, Smeets TJM, Boyle DL, Kraan MC, Shi Y, Zhuang S, Zvai-
fler NJ, Breedveld FC, Firestein GS: p53 overexpression in syn-
ovial tissue from patients with early and longstanding
rheumatoid arthritis compared with patients with reactive
arthritis and osteoarthritis. Arthritis Rheum 1999, 42:948-953.
51. Yamanishi Y, Boyle DL, Rosengren S, Green DR, Zvaifler NJ,
Firestein GS: Regional analysis of p53 mutations in rheumatoid
arthritis synovium. Proc Natl Acad Sci USA 2002,
99:10025-10030.
52. McCarty DJ, O'Duffy JD, Pearson L, Hunter JB: Remitting seron-
egative symmetrical synovitis with pitting edema. JAMA 1985,
254:2763-2767.