Báo cáo y học: "Reproducibility and sensitivity to change of various methods to measure joint space width in osteoarthritis of the hip: a double reading of three different radiographic views taken with a three-year interval" pot
Bạn đang xem bản rút gọn của tài liệu. Xem và tải ngay bản đầy đủ của tài liệu tại đây (468.46 KB, 11 trang )
Open Access
Available online />R1375
Vol 7 No 6
Research article
Reproducibility and sensitivity to change of various methods to
measure joint space width in osteoarthritis of the hip: a double
reading of three different radiographic views taken with a
three-year interval
Emmanuel Maheu
1
, Christian Cadet
2
, Marc Marty
3
, Maxime Dougados
4
, Salah Ghabri
5
,
Isabelle Kerloch
6
, Bernard Mazières
7
, Tim D Spector
8
, Eric Vignon
9
and Michel G Lequesne
10
1
Service de Rhumatologie, Hôpital Saint Antoine, Paris, France
2
4 Place Martin Nadaud, 75020 Paris, France
3
Medical Director, Clinica et Statistica, Issy les Moulineaux, France
4
Université René Descartes, Paris V, Rheumatology Department, Hôpital Cochin, Paris, France
5
Statistician, Clinica et Statistica, Issy les Moulineaux, France
6
Project Manager, Expanscience Labs, Courbevoie, France
7
Service de Rhumatologie, Hôpital Rangueil, Toulouse, France
8
St Thomas's Hospital, London, UK
9
Service de Rhumatologie, Hôpital, Lyon, France
10
Service de Rhumatologie, Hôpital Léopold Bellan, Paris, France
Corresponding author: Emmanuel Maheu,
Received: 4 Jul 2005 Revisions requested: 18 Aug 2005 Revisions received: 25 Aug 2005 Accepted: 30 Aug 2005 Published: 5 Oct 2005
Arthritis Research & Therapy 2005, 7:R1375-R1385 (DOI 10.1186/ar1831)
This article is online at: />© 2005 Maheu et al.; licensee BioMed Central Ltd.
This is an Open Access article distributed under the terms of the Creative Commons Attribution License ( />2.0), which permits unrestricted use, distribution, and reproduction in any medium, provided the original work is properly cited.
Abstract
Joint space width (JSW) and narrowing (JSN) measurements on
radiographs are currently the best way to assess disease
severity or progression in hip osteoarthritis, yet we lack data
regarding the most accurate and sensitive measurement
technique. This study was conducted to determine the optimal
radiograph and number of readers for measuring JSW and JSN.
Fifty pairs of radiographs taken three years apart were obtained
from patients included in a structure modification trial in hip
osteoarthritis. Three radiographs were taken with the patient
standing: pelvis, target hip anteroposterior (AP) and oblique
views. Two trained readers, blinded to each other's findings,
time sequence and treatment, each read the six radiographs
gathered for each patient twice (time interval ≥15 days), using a
0.1 mm graduated magnifying glass. Radiographs were
randomly coded for each reading. The interobserver and
intraobserver cross-sectional (M0 and M36) and longitudinal
(M0–M36) reproducibilities were assessed using the intraclass
coefficient (ICC) and Bland–Altman method for readers 1 and 2
and their mean. Sensitivity to change was estimated using the
standardized response mean (SRM = change/standard
deviation of change) for M0–M36 changes. For interobserver
reliability on M0–M36 changes, the ICCs (95% confidence
interval [CI]) were 0.79 (0.65–0.88) for pelvic view, 0.87 (0.78–
0.93) for hip AP view and 0.86 (0.76–0.92) for oblique view.
Intraobserver reliability ICCs were 0.81 (0.69–0.89) for
observer 1 and 0.97 (0.95–0.98) for observer 2 for the pelvic
view; 0.87 (0.78–0.92) and 0.97 (0.96–0.99) for the hip AP
view; and 0.73 (0.57–0.84) and 0.93 (0.88–0.96) for the
oblique view. SRMs were 0.61 (observer 1) and 0.82 (observer
2) for pelvic view; 0.64 and 0.75 for hip AP view; and 0.77 and
0.70 for oblique view. All three views yielded accurate JSW and
JSN. According to the best reader, the pelvic view performed
slightly better. Both readers exhibited high precision, with SRMs
of 0.6 or greater for assessing JSN over three years. Selecting
a single reader was the most accurate method, with 0.3 mm
precision. Using this cutoff, 50% of patients were classified as
'progressors'.
AP = anteroposterior; CI = confidence interval; ICC = intraclass coefficient of correlation; JSN = joint space narrowing; JSW = joint space width;
OA = osteoarthritis; SD = standard deviation; SDD = smallest detectable difference; SRM = standardized response mean; WOMAC = Western and
Ontario MacMaster University.
Arthritis Research & Therapy Vol 7 No 6 Maheu et al.
R1376
Introduction
Osteoarthritis (OA) is the most common rheumatic disease,
and is becoming a major public health problem with the ageing
of the population and the growing incidence of obesity in
developed countries [1]. Treatment aims both to reduce symp-
tom severity and to prevent or slow down disease progression
and activity. Many symptom-modifying therapies have been
proposed with various levels of evidence (for a recent review,
see Zhang and coworkers [2]). However, we still lack a dis-
ease-modifying therapy because there is no treatment with
proven efficacy in preventing, stopping, or retarding the dis-
ease process [2]. The structural process in OA affects carti-
lage, which is decreased in quality and thickness. Other
structures may be involved in the damage observed in OA,
including subchondral bone, articular capsule, synovium,
meniscus and soft periarticular tissues. Hip OA is very com-
mon. It affects about 10% of the general population aged 65–
74 years [3]. The prevalence of symptomatic hip OA increases
dramatically with age.
Several trials have been conducted to identify structure-modi-
fying drugs in hip OA, but as yet no such agent has exhibited
convincing efficacy in this regard. The structural progression
of OA is currently assessed on plain radiographic views by
measuring the joint space width (JSW) and joint space nar-
rowing (JSN) over a period of time [4]. This assessment is at
present based on chondrometry, as described by Lequesne
[5-7]. Other methods have been proposed, such as digitalized
chondrometry (i.e. measurement of JSW or joint space surface
with computer assistance [8]). Good reliability and sensitivity
have been demonstrated for both methods [9,10]. At present,
manual chondrometry – measurement of JSW at the narrow-
est point using a 1/10 mm graduated magnifying glass – per-
formed by trained readers is the most commonly used
technique. It has been shown to be sensitive to change and
able to detect minor changes such as 0.5 mm over a one or
two year period [11,12].
Recently published expert consensus recommendations
[13,14] advocate the use of manual or digitalized measure-
ment of joint space at the narrowest point on plain radio-
graphic views of the pelvis in trials of structure-modifying
treatment. However, there remains uncertainty concerning the
optimal view for performing the measurement (anteroposterior
[AP] pelvic view, feet in internal rotation of 15°, target hip AP
view, or oblique view, which was proposed by Lequesne and
Laredo [15] to be the 'false profile') and the number of readers
that should perform the measurements in such trials. In 1987
Altman and coworkers [16] recommended three readers, but
no evidence has yet been reported to support whether one,
two, or even three readers should perform the measurements.
It has been documented that radiography should be carried
out in the standing rather than in the supine position [17,18].
The oblique view and plain pelvic view were compared in a
pilot study conducted in 50 patients [19]. The combination of
both views allowed identification of JSN in an additional one-
third of patients, but the study did not attempt to identify the
most sensitive view for performing chondrometry in a struc-
ture-modification trial.
The present study aimed to answer the following questions.
Which radiographic view of the hip provides the most accurate
measurement of JSW and JSN progression in hip OA? Should
future trials of the structure-modifying effect of a treatment
employ one or two trained readers for optimal assessment of
disease progression and reliability of JSW measurement in hip
OA?
Materials and methods
Patients
Hip radiographs were obtained from patients included in the
ERADIAS study – an ongoing randomized, three-year, pro-
spective, multicentre, double-blind, placebo-controlled trial of
avocado/soybean unsaponifiables in hip OA. The study was
approved by the ethics review board of the Pitié-Salpétrière
Hospital. Included were outpatient with symptomatic hip OA
(according to the American College of Rheumatology criteria
[20]), who were 45–75 years old and who had a manually
measured JSW on plain AP pelvic radiograph of 1–4 mm at
baseline. All patients gave written informed consent to partici-
pate in the trial. Radiographs were verified by an independent
assessor before study entry to ensure that patients were
affected by OA; to ensure that the JSW was between 1 and 4
mm and assign the patient to one of the two strata (see
below); and to exclude patients with isolated posteroinferior
JSN, identified on the oblique view.
Selection of radiographs
Radiographs from 50 patients were selected at random from
radiographs of patients who had completed the three-year
duration of the trial on 13 July 2004. Patients in the trial were
stratified at entry into two strata: those with baseline JSW
below 2.5 mm and those with baseline JSW 2.5 mm or
greater, in order to ensure that the whole spectrum of disease
was represented. For each patient, the protocol was to obtain
three different radiographic views each year: plain radiograph
of the pelvis, and target hip AP view and oblique view
(Lequesne's false profile). Radiographs performed at baseline
and at month 36 (M36 ± 3 months) were selected. The
number of sets of radiographs required in each stratum was
25.
Radiographic techniques
All radiographs were obtained at a standard size of 1/1 with
the patient in a weight-bearing position. The X-ray beam was
orientated AP, horizontal, and perpendicular to the table. The
distance between X-ray source and film was 100 cm. Pelvis
radiographs were performed with 15 ± 5° internal rotation of
the feet and with the X-ray beam directed at the upper edge of
the pubis symphysis. For hip AP views, 15 ± 5° internal
Available online />R1377
rotation of the foot was also required but the the X-ray beam
was directed at the joint space (with fluoroscopy). Oblique
views were obtained using the technique described by
Lequesne [13]. Patients were positioned with the foot axis
(second metatarsus) parallel to the inferior edge of the radiog-
raphy table and with the X-ray beam directed at the joint space
(fluoroscopy). A sketch of the feet on the ground was drawn
on heavy-weight paper during initial radiography and was used
to position the patient at each subsequent examination.
Radiation exposure for each patient was 0.7 mSv (milliSiev-
erts) for the pelvic view, 0.3 mSv for the hip AP view and 0.3
mSv for the oblique view. According to current private ambu-
latory practice in France, the cost of each of these views is
24.30 Euro (rated Z15 each, a Z costing 1.62 Euro).
Blinding process for radiographs
Two lists of randomization (one per stratum) were used to
code radiographs (using an alphanumeric code). Different
alphanumeric codes were assigned to radiographs for each
reading in order to avoid any identification of a set of radio-
graphs that had already been read (reading one: list numbers
1–50; reading two: list numbers 51–100). Readers were
blinded to the time sequence; letters A or B were randomly
assigned to code the time sequence (M0 [baseline] or M36)
on radiographs. Therefore, each radiograph was identified
both by a letter and a number. All coded films (three views at
M0 and three at M36, yielding a total of six films) for a single
patient were gathered in an envelope.
Reading procedures
Two trained readers (CC and EM) measured JSW using a 0.1
mm graduated magnifying glass. For each radiograph they
were unaware of patient's identity, drug assignment, time
sequence of the radiographs and each other's findings. Each
set of six radiographs was read twice with a minimum time
interval of 15 days between the two readings. Each radiograph
was read on a horizontally positioned light box in order to iden-
tify the location and take an accurate measurement of the nar-
rowest JSW area. All six views for each patient were read at
the same time. About 10 sets of radiographs were read during
each reading session (60 radiographs). A break was planned
during each session so as not to exceed more than 2 consec-
utive hours of reading. Altogether, 300 radiographs were read
twice, giving a total of 600 radiographs read. For the pelvic
view, the target hip (i.e. the hip responsible for the patient's
inclusion in the trial) to be read was indicated by a mark made
by those in charge of randomization and labelling of radio-
graphs. Readings were done between 24 August 2004 and 5
October 2004 by the two readers.
Measurement of joint space width
The JSW of the hip joint was measured at the narrowest point
for each view, in accordance with a previously described
method [6]. Briefly, the site of measurement was marked by
the reader using a special pencil that produces removable
marks. The interbone distance was measured at this site with
the help of a 0.1 mm graduated magnifying glass directly
applied to the radiographic film and reported on a specifically
designed case report form. The mark was then removed by the
reader. For the oblique view, measurement had to be per-
formed in the anterior and upper part of the circumference
between the femoral head and the acetabulum, because no
significant articular cartilage thickness could be measured at
the posteroinferior segment of the view, especially after
patients with posteroinferior hip OA had been excluded from
the trial.
Data management
Data were checked and queries sent to each observer when
appropriate. For the Western and Ontario MacMaster Univer-
sity (WOMAC) score calculation, rules provided by the author
were used [21]. Double key data entry was performed
between 2 September and 5 October 2004.
Statistical analysis
Descriptive data were recorded at baseline for the 50 patients
selected: age, gender, BMI, mean disease duration, WOMAC
Table 1
Scheduled tested properties for each view and for each observer
Observer Intraobserver
reproducibility (M0)
Intraobserver
reproducibility (M0–
M36)
Interobserver
reproducibility (M0)
Interobserver
reproducibility (M0–
M36)
Sensitivity to change
(M0–M36)
Value from observer 1xxxxx
Value from observer 2 x x x
Mean of values from
observers 1 and 2
xx x
Data Reading 1 and
reading 2 of M0 for
each observer
Difference between
M0 and M36 for
readings 1 and 2 for
each observer
Reading 1 at M0 for
two observers
Reading 1 for the
difference between
M0 and M36 for two
observers
Difference between
M0 and M36 in
reading 1 for each
observer
Arthritis Research & Therapy Vol 7 No 6 Maheu et al.
R1378
score and Lequesne's index [22]. The data from radiographic
readings were presented for each view and for each observer
(reader 1, reader 2 and mean of the two readers) for M0 and
M36, and their difference (M36–M0) using descriptive statis-
tics (number, mean, standard deviation [SD], minimum, and
maximum). The number of hips exhibiting a joint space change
of 0.5 mm or more and those with a change of 0.3 mm or more
between M0 and M36 were calculated for each view. The met-
rologic measurements taken for each view and each reader
are shown in Table 1.
Accuracy of JSW measurement evaluated by intraobserver
and interobserver reproducibility was assessed using the
intraclass coefficient of correlation (ICC) [23] and using the
Bland–Altman plotting method [24], which indicates the small-
est detectable difference (SDD; i.e. the amount of detectable
change above the random measurement error). Estimates of
ICC were derived in the framework of a two-way fixed effect
model. The 95% confidence interval (CI) was estimated using
the method described by Fleiss and Shrout [25]. Mean differ-
ence, SD of the difference, 95% CI approximation of bias, lim-
its, and 95% CI of upper and lower limits of agreements
between measures were calculated. Using the SDD, the pro-
portions of patients who could be considered to be 'progres-
sors' were calculated.
Sensitivity to change of radiographic measures was estimated
based on differences in JSW between M36 and M0 (from
reading 1) using the standardized response mean (SRM;
mean change/SD of change). The 95% CI of SRM estimates
were calculated using the Jackknife technique [26] using the
software S-PLUS professional (S-PLUS 6 for Windows;
Insightful Corp., Seattle, WA, USA).
Paired tests and limits of agreements were used for compari-
sons between views and observers. When the null hypothesis
(i.e. normal distribution) was rejected, the paired Wilcoxon test
was used.
Results
One hundred and forty-eight patients were included in the clin-
ical trial between 7 February 2000 and 31 July 2001. The
dropout rate in this sample was 45.9% (68/148), leaving 80
patients who completed the three years of follow-up. Radio-
graphs of 29 patients were rejected for the following reasons:
radiographs not received (five patients); one view missing or
not available (11); radiographs sent for duplication and mean-
while not available (4); M0 or M36 radiograph not performed
at the right time (i.e. more than 1 month delay; 2); M36 radio-
graph not obtained within the predefined time limit (i.e. 36 ± 3
months; 3); and poor radiograph quality (4). Among radio-
graphs for the remaining 51 patients (26 in the low stratum
and 25 in the high stratum), one patient was excluded by a ran-
dom process to keep 25 radiographs in each stratum.
Descriptive clinical data for the 50 patients whose radiographs
were selected are shown in Table 2.
General results of radiographic measurements for each view
and each observer (the mean of observers 1 and 2 is consid-
ered a third observer) are summarized in Table 3.
Interobserver reproducibility
Data (mean of differences at baseline [± SD] and M0–M36
changes, ICC values) are provided for each view in Table 4.
ICC values were 0.80 for the pelvic view, 0.88 for the target
hip AP view and 0.72 for the target hip oblique view, indicating
a good interobserver reproducibility. There was a systematic
bias between the two readers; specifically, JSW
measurements for reader 2 were slightly but systematically
higher than those of the reader 1.
Intraobserver reproducibility
Cross-sectional intraobserver reproducibility of radiographic
measurements at baseline
The mean differences between repeated measurements of
baseline radiographs are given in Table 5 for each view. ICC
values were very high for both readers on all three views.
Table 2
Baseline characteristics of the 50 patients for whom radiographs were available
Baseline characteristic Low stratum: JSW <2.5 mm (n = 25) High stratum: JSW ≥ 2.5 mm (n = 25) Total (n = 50)
Age (years; mean ± SD) 60.6 ± 8.2 59.9 ± 10.9 60.2 ± 9.6
Sex (n [%] female) 15/25 (60%) 14/25 (56%) 29/50 (58%)
BMI (kg/m
2
; mean ± SD) 27.5 ± 5.5 25.8 ± 3.0 26.6 ± 4.5
Disease duration (years; mean ± SD) 5.2 ± 4.5 3.6 ± 3.2 4.4 ± 4.0
Lequesne index (0–24; mean ± SD) 7.2 ± 2.0 6.9 ± 1.9 7.1 ± 2
WOMAC (total score: 0–100; mean ± SD) 35 ± 23.3 27.10 ± 15.75 31.12 ± 20.15
Global pain on VAS (mm; mean ± SD) 39.4 ± 25.8 35. 7 ± 15.1 37.6 ± 21.0
BMI, body mass index; JSW, joint space width; SD, standard deviation; VAS, visual analogue scale; WOMAC, Western and Ontario MacMaster
University.
Available online />R1379
Table 3
General results of radiographic measurements
View Observer Reading n M0 M36 ∆M36–M0
Mean
(mm)
SD Min Max Mean
(mm)
SD Min Max Mean
(mm)
SD Min Max
Pelvic 1 1 50 2.33 0.81 0.70 4.10 1.93 1.06 0.0 4.40 -0.40 0.65 -2.10 +0.80
2 50 2.34 0.81 0.70 4.20 1.85 0.97 0.0 4.10 -0.49 0.54 -1.90 +0.40
2 1 50 2.67 1.07 0.90 5.50 2.13 1.35 0.0 5.50 -0.54 0.66 -2.30 +0.40
2 50 2.66 1.02 0.70 5.10 2.16 1.31 0.0 5.20 -0.49 0.67 -2.20 +0.20
Mean (1 + 2) 1 50 2.50 0.91 0.70 4.65 2.03 1.17 0.0 4.95 -0.47 0.62 -2.05 +0.45
2 50 2.50 0.89 0.70 4.50 2.01 1.11 0.0 4.55 -0.49 0.57 -2.05 +0.30
Hip AP 1 1 50 2.41 0.86 0.70 4.30 2.02 1.13 0.0 4.40 -0.39 0.61 -2.00 +0.60
2 50 2.40 0.86 0.80 4.50 1.94 1.07 0.0 4.30 -0.46 0.59 -1.90 +0.70
2 1 50 2.69 1.05 0.60 5.50 2.19 1.34 0.0 5.50 -0.49 0.66 -2.10 +0.50
2 50 2.68 1.01 0.70 5.50 2.19 1.30 0.0 5.00 -0.49 0.66 -2.20 +0.60
Mean (1 + 2) 1 50 2.55 0.94 0.65 4.90 2.11 1.22 0.0 4.95 -0.44 0.62 -2.05 +0.55
2 50 2.54 0.92 0.75 5.00 2.06 1.17 0.0 4.55 -0.48 0.60 -1.95 +0.65
Oblique 1 1 50 2.37 0.79 0.70 3.70 1.92 1.05 0.0 3.80 -0.46 0.59 -2.20 +0.50
2 50 2.29 0.78 0.40 3.60 1.92 1.02 0.0 4.10 -0.37 0.50 -1.70 +0.70
2 1 50 2.69 1.00 0.50 5.00 2.21 1.28 0.0 5.00 -0.47 0.67 -2.40 +1.20
2 50 2.70 1.01 0.60 5.00 2.18 1.27 0.0 5.00 -0.52 0.64 -2.30 +0.20
Mean (1 + 2) 1 50 2.53 0.85 0.75 4.15 2.07 1.13 0.0 3.95 -0.46 0.61 -2.15 +0.65
2 50 2.50 0.87 0.50 4.20 2.05 1.13 0.0 4.95 -0.45 0.53 -1.95 +0.35
Shown are the general results of radiographic measurements of joint space width (JSW) at baseline (M0) and 36 months (M36), and the joint
space change for the three views and two observers (and their mean and SD). AP, anteroposterior; ∆, difference; SD, standard deviation.
Table 4
Interobserver reproducibility of joint space width measurements
View Observer Baseline JSW
reading 1 (mm;
mean ± SD)
Mean of difference
(mm; mean ±
SD)
ICC (95% CI) Joint space
change from M0
to M36 in
reading 1 (mm)
ICC (95% CI)
Pelvic 1 2.33 ± 0.81 -0.34 ± 0.52 0.80 (0.52–0.91) -0.40 ± 0.65 0.79 (0.65–0.88)
2 2.67 ± 1.07 -0.54 ± 0.66
Hip AP 1 2.41 ± 0.86 -0.27 ± 0.39 0.88 (0.66–0.95) -0.39 ± 0.61 0.87 (0.78–0.93)
2 2.69 ± 1.05 -0.49 ± 0.66
Oblique 1 2.37 ± 0.79 -0.31 ± 0.61 0.72 (0.50–0.85) -0.46 ± 0.59 0.86 (0.76–0.92)
2 2.69 ± 1.00 -0.47 ± 0.67
Shown is the interobserver reproducibility of joint space width (JSW) measurements between the two readers for the three radiographic views.
AP, anteroposterior; CI, confidence interval; ICC, intraclass coefficient of correlation; SD, standard deviation.
Arthritis Research & Therapy Vol 7 No 6 Maheu et al.
R1380
Longitudinal intraobserver reproducibility of measurements
of joint space changes between baseline and M36
The mean differences in repeated measurements of changes
in JSW between baseline (M0) and M36 are given in Table 6
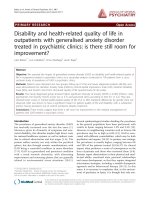
for each reader and each view. The Bland–Altman plotting
method results for intraobserver reproducibility of measure-
ments of changes between baseline and M36 are summarized
in Fig. 1 for both readers and the three different views. ICC
values were also very high for each observer for all three views,
as shown in Table 6.
Both readers exhibited very good precision, as assessed using
the ICC. Reader 2 was more accurate for all measures, as
assessed both by ICC and Bland–Altman graphics (Fig. 1b).
Adding a second reader or calculating the mean of the two
readers did not confer any additional precision.
Sensitivity to change over time
The SRM values were high, ranging from 0.61 (pelvic view,
reader 1) to 0.82 (pelvic view, reader 2; Table 6). The estimate
of the precision of the SRM calculated was performed using
the Jackknife technique; 95% CI Jackknife SRMs are given in
Table 6. According to values calculated in this study, radio-
graphic measurement of JSW on the three views was sensi-
tive. Reader 2 was more sensitive to change than was reader
1. All radiographic views appeared to provide similar levels of
responsiveness. However, the pelvic view seemed to be the
most sensitive in measuring changes in JSW – a basic prop-
erty in trials of structure-modifying treatment.
JSW measurement is a continuous variable, and therefore it
does not permit one to classify patients as disease progres-
sors or nonprogressors. To translate this continuous variable
into a dichotomous progression variable, we calculated the
SDD, which can be derived using the Bland and Altman graph-
ical approach. Its value is obtained by 2 SDs of the mean of
differences between the two measurements. As may be calcu-
lated from data shown in Tables 5 and 6, the SDD for reader
2 was 0.32 mm for measurements of JSW and M0–M36 JSW
changes on pelvic view and 0.30 mm and 0.28 mm,
respectively, for measurements of JSW and M0–M36 JSW
changes on the hip AP view.
The proportions of patients who could be classified as 'pro-
gressors' using the 0.3 mm cutoff or using the 0.5 mm cutoff
previously described [11] are given in Table 7. Based on the
reading precision offered by reader 2, the cutoff value of 0.3
mm was selected. Reader 1 identified 52%, 52% and 56% of
progressors on pelvic, hip AP and hip oblique views, respec-
tively. Reader 2 identified 48%, 54% and 52%, respectively.
Using the 0.5 mm cutoff value, the respective proportions of
progressors were 34%, 34% and 46% for reader 1, and 40%,
40% and 38% for reader 2.
Combining the results of measurements taken from the pelvic
view and those taken from the oblique view led to a higher rate
of identified progressors. Using the 0.3 mm cutoff, reader 1
identified 64% of progressors versus 52% on the pelvic view;
using the 0.5 mm cutoff, 52% of progressors versus 34%
Table 5
Cross-sectional intraobserver reproducibility of joint space width measurements at baseline
View Observer JSW (mm; mean ± SD) Mean difference
(mm; mean ± SD)
Limits of
agreements
ICC values (95%
CI)
Reading 1 Reading 2
Pelvic view 1 2.33 ± 0.81 2.34 ± 1.07 -0.01 ± -0.24 -0.49 to +0.47 0.96 (0.93–0.98),
0.99
2 2.67 ± 0.81 2.66 ± 1.02 -0.02 ± 0.16 -0.30 to +0.34 (0.98–0.99) 0.98
(0.97–0.99)
Mean (1 + 2) 2.50 ± 0.91 2.50 ± 0.89 0.004 ± 0.14 -0.28 to +0.28
Hip AP 1 2.41 ± 0.86 2.40 ± 0.86 0.01 ± 0.25 -0.49 to +0.51 0.96 (0.93–0.98),
0.99
2 2.69 ± 1.05 2.68 ± 1.01 0.01 ± 0.15 -0.29 to +0.31 (0.98–0.99) 0.98
(0.97–0.99)
Mean (1 + 2) 2.55 ± 0.94 2.54 ± 0.92 0.01 ± 0.16 -0.30 to +0.32
Oblique 1 2.37 ± 0.79 2.29 ± 0.78 0.08 ± 0.37 -0.89 to +0.71 0.88 (0.80–0.93),
0.98
2 2.69 ± 0.78 2.70 ± 1.01 -0.02 ± 0.21 -0.41 to +0.51 (0.96–0.99) 0.96
(0.94–0.98)
Mean (1 + 2) 2.53 ± 0.85 2.50 ± 0.87 0.03 ± 0.21 -0.29 to +0.35
Shown is the cross-sectional intraobserver reproducibility of radiographic measurements of joint space width (JSW) performed on baseline
radiographs. CI, confidence interval; ICC, intraclass coefficient of correlation; SD, standard deviation.
Available online />R1381
were identified. The corresponding figures for reader 2 were
48% versus 48% and 46% versus 40%.
Comparisons between views
The mean difference between the JSW measurements on pel-
vic and hip AP views was 0.01 ± 0.18 mm for reader 2 (at first
reading), which was not statistically significant (P = 0.91 by
Wilcoxon test). The mean difference for the same reader
between the JSW measurements on pelvic and oblique views
was 0.01 ± 0.64 mm, which was also not statistically signifi-
cant (P = 0.89 by Student's t test). The study of correlations
between measurements of M0–M36 JSW changes by reader
2 on pelvic and hip AP views exhibited very high correlation
(Pearson correlation coefficient = 0.94; P < 0.0001).
Discussion
Several radiographic views allow assessment of JSW and joint
space changes in hip OA. To our knowledge, this is the first
study to compare directly the metrologic measurement prop-
erties of JSW assessed using different radiographic views in
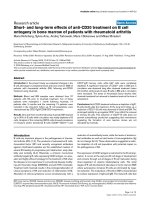
Figure 1
Intraobserver precisionIntraobserver precision. Shown is the intraobserver precision, summarized using the Bland and Altman plotting method, for the assessment of
changes in joint space width (JSW) between baseline (M0) and 36 months (M36) for the two readers and the three different radiographic views. A
total of 50 sets of three radiographs taken at M0 and M36 were read twice by 2 readers with a 15 day interval. (a) Intraobserver reproducibility for
reader 1 (M0–M36): 1, pelvic view; 2, hip anteroposterior (AP) view; 3, oblique view. (b) Intraobserver reproducibility for reader 2 (M0–M36): 1, pel-
vic view; 2, hip AP view; 3, oblique view.
Arthritis Research & Therapy Vol 7 No 6 Maheu et al.
R1382
hip OA obtained in the same sample of patients. Because the
evaluation of a structure-modifying effect of a treatment is cur-
rently based on JSW measurement on radiographs, it is critical
to optimize the technique used in order to maximize the preci-
sion of the measure. It must be noted that, in the present study,
radiographs of poor quality or not performed within the prede-
fined time limits from seven patients (9%) were excluded,
which is not the procedure usually employed in clinical trial;
instead, all radiographs are kept in such trial for use in an
intent-to-treat analysis.
Our findings did not reveal significant differences between the
ability of the different views to measure JSW reliably. With
regard to intraobserver precision (either transversal at M0 or
longitudinal between M0 and M36), and only considering the
results for the better of the two readers, any of the three views
could be used in a structural evaluation in hip OA because
they yielded almost the same precision in assessment of JSW
and joint space change. The limits of agreement at baseline
ranged from -0.3 mm to +0.3 mm both for pelvic view and hip
AP view, and for M0–M36 JSN measurement they ranged
from -0.37 mm to +0.27 mm for the pelvic view and from -0.28
mm to +0.28 mm for the hip AP view. Cross-sectional and
transversal intraobserver reproducibilities were consistent; the
same values for dispersion (SD) were registered from the data
for reader 2 from his readings of each of the three views at M0
and M0–M36 measurements.
In the present study interobserver reproducibility was less
accurate than intraobserver (as shown in Tables 4, 5, 6). How-
ever, in the case of centralized reading performed by a single
selected reader, it is clear that intraobserver precision is far
more important than interobserver precision when examining
the metrologic properties of an assessment tool aimed at
measuring changes over time or with a given treatment.
The measurement of M0–M36 change in JSW provides an
opportunity to assess the real measurement error. Indeed, it
includes the error in measurement on a single radiograph (M0)
along with the ability to detect change over time, and also
includes the variability in measurement related to differences
in patient repositioning at the second radiograph. When the
aim is to select a tool to evaluate changes over time and/or to
compare changes between groups, one must consider longi-
tudinal intraobserver reliability and sensitivity to change, as
given by the SRM. In the present study SRM values were good
in all cases and for both readers. A SRM above 0.6 is consid-
ered good to excellent, whereas SRM values between 0.3 and
0.6 correspond to slight to moderate responsiveness. Unsur-
prisingly, measurements by the best reader provided the high-
est SRM values (ranging from 0.70 for the oblique view to
0.82 for the pelvic view). These values are consistent with
SRMs calculated in previous studies comparing manual and
digitalized assessment of joint space in hip OA [9,10].
Assessment of intraobserver precision provides an opportu-
nity to calculate the SDD (i.e. the minimal amount of change
that can be considered a change superior to the measurement
error). The SDD allows determination of a cutoff value that
segregates patients into those who had 'progressed' (i.e. lost
cartilage thickness) and those who had not. This is of consid-
erable importance in a trial in which the aim is to assess signif-
icant changes. The high precision in measurements by the
second reader allowed us to select a 0.3 mm cutoff value,
Table 6
Longitudinal (M0–M36) intraobserver reproducibility and sensitivity to change of joint space width measurements
View Observer JSW change (mm; mean ± SD) Difference
(mm; mean
± SD)
95% CI
approximation
of bias
Limits of
agreements
ICC value (95%
CI)
SRM calculated on
reading 1 (95% CI)
Reading 1 Reading 2
Pelvic 1 -0.40 ± 0.65 -0.49 ± 0.54 0.09 ± 0.36 -0.01 to +0.19 -0.63 to +0.81 0.81 (0.69–0.89) -0.61 (-0.65 to -0.57)
2 -0.54 ± 0.66 -0.49 ± 0.67 -0.05 ± 0.16 -0.09 to -0.01 -0.37 to +0.27 0.97 (0.95–0.98) -0.82 (-0.84 to -0.80)
Mean (1 + 2) -0.47 ± 0.62 -0.49 ± 0.57 0.02 ± 0.18 -0.2 to +0.06 -0.34 to +0.38 0.95 (0.92–0.97) -0.76 (-0.77 to -0.73)
Hip AP 1 -0.39 ± 0.61 -0.46 ± 0.59 0.07 ± 0.30 -0.01 to +0.15 -0.53 to +0.67 0.87 (0.78–0.92) -0.64 (-0.67 to -0.61)
2 -0.49 ± 0.66 -0.49 ± 0.66 -0.00 ± 0.14 -0.04 to +0.04 -0.28 to +0.28 0.97 (0.96–0.99) -0.75 (-0.77 to -0.73)
Mean (1 + 2) -0.44 ± 0.62 -0.48 ± 0.60 0.03 ± 0.16 -0.01 to +0.07 -0.29 to +0.35 0.96 (0.94–0.98) -0.72 (-0.74 to -0.70)
Oblique 1 -0.46 ± 0.59 -0.37 ± 0.50 -0.09 ± 0.40 -0.21 to +0.03 -0.89 to +0.71 0.73 (0.57–0.84) -0.77 (-0.80 to -0.74)
2 -0.47 ± 0.67 -0.52 ± 0.64 0.05 ± 0.23 -0.10 to +0.11 -0.41 to +0.51 0.93 (0.88–0.96) -0.70 (-0.74 to -0.67)
Mean (1 + 2) -0.46 ± 0.61 -0.45 ± 0.53 0.03 ± 0.16 -0.10 to +0.07 -0.29 to +0.35 0.91 (0.85–0.95) -0.76 (-0.79 to -0.73)
Shown is the longitudinal intraobserver reproducibility and sensitivity to change (standardized response mean [SRM]) of radiographic
measurements of joint space width (JSW; change from baseline [M0] to M36) on 3 different views read by two observers (and their mean). AP,
anteroposterior; CI, confidence interval; ICC, intraclass coefficient of correlation; SD, standard deviation.
Available online />R1383
which is much lower than the 0.5 mm cutoff value usually rec-
ommended from previous studies [9,11]. Such a cutoff used
in future clinical trials of structure-modifying treatment could
result in increased statistical power and a reduction of the
number of patients required. It would certainly permit a shorter
duration of the trial (e.g. two years instead of three).
The present study shows that the precision of the measure is
more dependent on the precision of the readers than on the
radiographic view selected. Although the three views exam-
ined in the present study offered comparable precision in the
assessment of JSW, either pelvic or hip AP view seems to be
a good choice, offering a good reliability in measuring either
JSW on a single view or joint space changes over time in pairs
of radiographs taken 36 months apart. Although the best pre-
cision was obtained using the hip AP view, based on the
Bland–Altman results and the SRM calculation, it may be more
practical to choose the pelvic view (only slightly inferior to the
hip AP view) because it also provides information on the con-
tralateral hip.
The oblique view gives information that cannot be obtained
when examining an AP view of the hip, even following exclu-
sion of patients with isolated posteroinferior JSN, as was done
in the present study. In a sample of hip OA patients with JSN
in various locations, Conrozier and coworkers [19] showed
that assessing the oblique in addition to the pelvic view
resulted in identification of an additional 30% of patients with
JSN. Our findings support the hypothesis that the combination
of views could be superior to the use of a single view in iden-
tifying those patients whose joint space has changed. Accord-
ing to reader 2, 62% of patients could be classified as
'progressors' (i.e. patients exhibiting a decrease in JSW ≥ 0.3
mm) based on the combination of pelvic or oblique views, as
compared with 48% of patients identified as progressors
based on the pelvic view alone.
Using the pelvic or hip AP view, or combining one of them and
the oblique view to assess structural modification in hip OA
remains an option, depending on the trial aims and design.
One could recommend that primary measurement of JS
change be done using a single front view (either pelvic or hip
AP) and that changes on both pelvic or hip face and oblique
view be studied as secondary outcomes.
In France, in accordance with current ambulatory practice, the
costs of each view were the same (costs are, of course, coun-
try dependent). The patients' radiation exposure was not very
different between pelvic view, and hip AP or oblique views.
Selection of the radiograph should not depend on such
characteristics.
With regard to the number of readers that should be
employed, our results conflict with previous recommendations
that several readers be used [16]. A single reader was supe-
rior to the combination of two. Based on the results of this
study, we recommend that the best reader be selected from
among several trained readers before starting 'blinded' read-
ing. This assumes that the reader has undergone preliminary
training and that the reader will be selected to assess the pri-
mary outcome before the start of the trial. In our study we
should like to identify two factors from among many possible
explanations for the differences observed between the two
readers, which could be taken into account in future trials:
reader 2 was the most experienced of the two readers, having
performed JSW assessment in several trials over the past 20
years; and furthermore, there were optical differences
between the readers (reader 2 is a well corrected myopic and
Table 7
Proportion of patients considered to be progressors
View Observer Patients with ≥ 0.3 mm change
between M0 and M36
Patients with ≥ 0.5 mm change
between M0 and M36
Pelvic 1 52% 34%
2 48% 40%
Both 40% 28%
Hip AP 1 52% 34%
2 54% 40%
Both 46% 32%
Oblique 1 56% 46%
2 52% 38%
Both 46% 34%
Shown are the proportions of patients considered to be progressors, using two different smallest detectable differences (SDDs) as cutoff values
for defining progression (0.3 mm and 0.5 mm) for the two readers and three views. AP, anteroposterior.
Arthritis Research & Therapy Vol 7 No 6 Maheu et al.
R1384
reader 1 a presbyopic). The latter factor leads reader 2 to
remove his glasses when reading, with his myopia helping to
magnify the image he reads. Optical impairments could be
taken into account in the selection of readers; a myopic is pref-
erable to a presbyopic.
Conclusion
Our results show that the three radiographs usually performed
in the radiographic examination of the hip offer good precision
for assessment of JSW. However, pelvic or hip AP view allow
more accurate measurement. The selection of one trained
reader is preferable to using several readers in a trial. Further-
more, the better the precision of the reader, the fewer the
patients required for the trial. A precision of 0.3 mm joint space
change over time is attainable, using such procedures. When
choosing this cutoff, 50% of the patients could be identified as
'progressors' in the sample selected in the present study,
which would enhance statistical power greatly. Further inves-
tigations are required to compare digitized with manual chon-
drometry on these three views and joint space measurement
on a single AP view versus the combination of AP and oblique
views.
Competing interests
The authors declare that they have no competing interests.
Authors' contributions
EM devised the protocol of the trial and that of the present
study with MM, performed the readings with CC, contributed
to data analysis and wrote the manuscript. CC performed the
readings and significantly contributed to the protocol develop-
ment, data analysis and manuscript revision. MM devised the
statistical section of the protocol, supervised the blinding
process of radiographs, performed the randomization of radio-
graphs, and verified the statistical analysis. MD significantly
participated in devising the protocol of the study and in the
analysis of data; he contributed to writing the manuscript and
its revision. SG wrote with MM the statistical section of the
protocol, checked the data and performed the statistical anal-
ysis. IK performed the follow-up of the trial and the radio-
graphic study, and data management. BM, TS and EV
significantly contributed to devising the protocol, analysis of
data and revision of the manuscript. MGL was principal inves-
tigator of the trial; he significantly contributed to developing
the design of the study, helped to define methods of measure-
ment, and participated in manuscript development and
revision.
Acknowledgements
We gratefully acknowledge Dr Philippe Coste and Expanscience Labo-
ratories for providing data, material assistance and financial support to
carry out this project.
References
1. Felson DT, Zhang Y: An update on the epidemiology of knee
and hip osteoarthritis with a view to prevention. Arthritis
Rheum 1998, 41:1343-1355.
2. Zhang W, Doherty M, Arden N, Bannwarth B, Bijlsma J, Gunther
KP, Hauselmann HJ, Herrero-Beaumont G, Jordan K, Kaklamanis
P, et al.: EULAR evidence based recommendations for the
management of hip osteoarthritis: report of a task force of the
EULAR Standing Committee for International Clinical Studies
Including Therapeutic (ESCISIT). Ann Rheum Dis 2005,
64:669-681.
3. van Sasse JL, van Romunde LK, Cats A, Vandenbroucke JP,
Valkenburg HA: Epidemiology of osteoarthritis: Zoetermeer
survey. Comparison of radiologic osteoarthritis in a Dutch
population with that in 10 other populations. Ann Rheum Dis
1989, 48:271-280.
4. Altman R, Brandt K, Hochberg M, Moskowitz R, Bellamy N, Bloch
DA, Buckwalter J, Dougados M, Ehrlich G, Lequesne M, et al.:
Design and conduct of clinical trials in patients with osteoar-
thritis: recommendations from a task force of the Osteoarthri-
tis Research Society. Results from a Workshop. Osteoarthritis
Cartilage 1996, 4:217-243.
5. Lequesne M: Chondrometry. Quantitative evaluation of joint
space width and rate of joint space loss in osteoarthritis of the
hip. Rev Rhum Engl Ed 1995, 62:155-158.
6. Lequesne M: Quantitative measurements of joint space during
progression of osteoarthritis: 'chondrometry'. In Osteoarthritis
Disorders Edited by: Kuettner K, Goldberg V. Rosemont: American
Academy of Orthopedic Surgeons; 1995:427-444.
7. Ravaud P, Dougados M: Radiographic assessment in
osteoarthritis. J Rheumatol 1997, 24:786-791.
8. Conrozier T, Tron AM, Balblanc JC, Mathieu P, Piperno M, Fitoussi
G, Bochu M, Vignon E: [Measurement of the hip joint space
using automatic digital image analysis]. Rev Rhum Ed Fr 1993,
60:137-143.
9. Conrozier T, Lequesne M, Favre H, Taccoen A, Mazières B, Dou-
gados M, Vignon M, Vignon E: Measurement of the radiological
hip joint space width. An evaluation of various methods of
measurement. Osteoarthritis Cartilage 2001, 9:281-286.
10. Maillefert JF, Sharp JT, Aho LS, Dougados M: Comparison of a
computer-based method and the classical manual method for
radiographic joint space width assessment in hip
osteoarthritis. J Rheumatol 2002, 29:2592-2596.
11. Dougados M, Gueguen A, Nguyen M, Berdah L, Lequesne M, Maz-
ières B, Vignon E: Radiological progression of hip osteoarthri-
tis: definition, risk factors and correlations with clinical status.
Ann Rheum Dis 1996, 55:356-362.
12. Lequesne M, Maheu E, Cadet C, Dreiser RL: Structural effect of
avocado/ soybean unsaponifiables on joint space loss in oste-
oarthritis of the hip. Arthritis Rheum 2002, 47:50-58.
13. Abadie E, Ethgen D, Avouac B, Bouvenot G, Branco J, Bruyère O,
Calvo G, Devogelaer JP, Dreiser RL, Herrero-Beaumont G, et al.:
Recommendations for the use of new methods to assess the
efficacy of disease-modifying drugs in the treatment of
osteoarthritis. Osteoarthritis Cartilage 2004, 12:263-268.
14. Altman RD, Bloch DA, Dougados M, Hochberg M, Lohmander S,
Pavelka K, Spector T, Vignon E: Measurement of structural pro-
gression in osteoarthritis of the hip: the Barcelona consensus
group. Osteoarthritis Cartilage 2004, 12:515-524.
15. Lequesne MG, Laredo JD: The faux profil (oblique view) of the
hip in the standing position. Contribution to the evaluation of
osteoarthritis of the adult hip. Ann Rheum Dis 1998,
57:676-681.
16. Altman RD, Fries JF, Bloch DA, Carstens J, Cooke TD, Genent H,
Gofton P, Groth H, McShane DJ, Murphy WA, et al.: Radiographic
assessment of progression in osteoarthritis. Arthritis Rheum
1987, 30:1214-1225.
17. Pessis E, Chevrot A, Drape JL, Leveque C, Sarazin L, Minoui A, Le
Blevec G, Chemla N, Dupont AM, Godefroy D: Study of the joint
space of the hip on supine and weight-bearing digital
radiographs. Clin Radiol 1999, 54:528-532.
18. Conrozier T, Lequesne MG, Tron AM, Mathieu P, Berdah L, Vignon
E: The effects of position on the radiographic joint space in
osteoarthritis of the hip. Osteoarthritis Cartilage 1997, 5:17-22.
19. Conrozier T, Bochu M, Gratacos J, Piperno M, Mathieu P, Vignon
E: Evaluation of the "Lequesne false profile" of the hip in
patients with hip osteoarthritis. Osteoarthritis Cartilage 1999,
7:295-300.
20. Altman RD, Alarcon G, Appelrouth D, Bloch D, Borenstein D,
Brandt K, Brown C, Cooke TD, Daniel W, Feldman D, et al.: The
American College of Rheumatology criteria for the classfica-
Available online />R1385
tion and reporting of osteoarthritis of the hip. Arthritis Rheum
1991, 34:505-514.
21. Bellamy N: Musculoskeletal Metrology Dordrecht, The Nether-
lands: Kluwer Academic Publishers; 1993.
22. Lequesne M, Méry C, Samson M, Gérard P: Indexes of severity
for osteoarthritis of the hip and knee. Validation-value in com-
parison with other assessment tests. Scand J Rheumatol
Suppl 1987, 65:85-89.
23. McGraw KO, Wong SP: Forming inferences about some intra-
class correlation coefficients. Psychol Methods 1996, 1:30-46.
24. Bland JM, Altman DG: Statistical methods for assessing agree-
ment between two methods for clinical measurement. Lancet
1986, 1:307-310.
25. Shrout PE, Fleiss JL: Intraclass coefficients: uses in assessing
rater reliability. Psychol Bull 1979, 86:420-428.
26. Shao J, Tu D: The Jackknife and the Bootstrap New York:
Springer-Verlag; 1996.