Báo cáo y học: "Long term evaluation of disease progression through the quantitative magnetic resonance imaging of symptomatic knee osteoarthritis patients: correlation with clinical symptoms and radiographic change" pps
Bạn đang xem bản rút gọn của tài liệu. Xem và tải ngay bản đầy đủ của tài liệu tại đây (308.32 KB, 12 trang )
Open Access
Available online />Page 1 of 12
(page number not for citation purposes)
Vol 8 No 1
Research article
Long term evaluation of disease progression through the
quantitative magnetic resonance imaging of symptomatic knee
osteoarthritis patients: correlation with clinical symptoms and
radiographic changes
Jean-Pierre Raynauld
1
, Johanne Martel-Pelletier
1
, Marie-Josée Berthiaume
2
, Gilles Beaudoin
3
,
Denis Choquette
4
, Boulos Haraoui
4
, Hyman Tannenbaum
5
, Joan M Meyer
6
, John F Beary
6
,
Gary A Cline
6
and Jean-Pierre Pelletier
1
1
Osteoarthritis Research Unit, University of Montreal Hospital Centre, Notre-Dame Hospital, Department of Medicine, University of Montreal, Montreal,
Quebec, Canada
2
University of Montreal Hospital Centre, Notre-Dame Hospital, Department of Radiology, University of Montreal, Montreal, Quebec, Canada
3
University of Montreal Hospital Centre, Notre-Dame Hospital, Department of Physics and Biomedical Engineering, University of Montreal, Montreal,
Quebec, Canada
4
University of Montreal Hospital Centre, Notre-Dame Hospital, Department of Medicine, University of Montreal, Montreal, Quebec, Canada
5
McGill University Health Centre, Montreal General Hospital, Department of Medicine, McGill University, Montreal, Quebec, Canada
6
Procter & Gamble Pharmaceuticals, Mason, Ohio, USA
Corresponding author: Jean-Pierre Raynauld,
Received: 8 Sep 2005 Revisions requested: 14 Oct 2005 Revisions received: 14 Nov 2005 Accepted: 25 Nov 2005 Published: 30 Dec 2005
Arthritis Research & Therapy 2006, 8:R21 (doi:10.1186/ar1875)
This article is online at: />© 2005 Raynauld et al.; licensee BioMed Central Ltd.
This is an open access article distributed under the terms of the Creative Commons Attribution License ( />),
which permits unrestricted use, distribution, and reproduction in any medium, provided the original work is properly cited.
Abstract
The objective of this study was to further explore the cartilage
volume changes in knee osteoarthritis (OA) over time using
quantitative magnetic resonance imaging (qMRI). These were
correlated with demographic, clinical, and radiological data to
better identify the disease risk features. We selected 107
patients from a large trial (n = 1,232) evaluating the effect of a
bisphosphonate on OA knees. The MRI acquisitions of the knee
were done at baseline, 12, and 24 months. Cartilage volume
from the global, medial, and lateral compartments was
quantified. The changes were contrasted with clinical data and
other MRI anatomical features. Knee OA cartilage volume losses
were statistically significant compared to baseline values: -3.7 ±
3.0% for global cartilage and -5.5 ± 4.3% for the medial
compartment at 12 months, and -5.7 ± 4.4% and -8.3 ± 6.5%,
respectively, at 24 months. Three different populations were
identified according to cartilage volume loss: fast (n = 11; -
13.2%), intermediate (n = 48; -7.2%), and slow (n = 48; -2.3%)
progressors. The predictors of fast progressors were the
presence of severe meniscal extrusion (p = 0.001), severe
medial tear (p = 0.005), medial and/or lateral bone edema (p =
0.03), high body mass index (p < 0.05, fast versus slow), weight
(p < 0.05, fast versus slow) and age (p < 0.05 fast versus slow).
The loss of cartilage volume was also slightly associated with
less knee pain. No association was found with other Western
Ontario McMaster Osteoarthritis Index (WOMAC) scores, joint
space width, or urine biomarker levels. Meniscal damage and
bone edema are closely associated with more cartilage volume
loss. These data confirm the significant advantage of qMRI for
reliably measuring knee structural changes at as early as 12
months, and for identifying risk factors associated with OA
progression.
Introduction
With the aging of the world population, osteoarthritis (OA) is
becoming an increasingly common cause of disability [1,2]
Diarthrodial joint damage assessment of the knee joint in par-
ticular is crucial for monitoring OA disease progression and for
eventually evaluating the therapeutic effect of disease
BMI = body mass index; DMOAD = disease modifying osteoarthritis drug; JSW = joint space width; MRI = magnetic resonance imaging; NSAID =
nonsteroidal anti-inflammatory drug; OA = osteoarthritis; qMRI = quantitative MRI; U-CTX-II = urinary C-terminal crosslinking telopeptide of collagen
type II; WOMAC = Western Ontario McMaster Osteoarthritis Index.
Arthritis Research & Therapy Vol 8 No 1 Raynauld et al.
Page 2 of 12
(page number not for citation purposes)
modifying osteoarthritis drugs (DMOADs) on its anatomical
structure. Improvements in the standardization and interpreta-
tion of knee and hip radiographs have produced more accu-
rate measurements of both joint space width (JSW) and the
progression of joint space narrowing [3]. X-ray data from a
recent study [4], however, showed that OA disease progres-
sion, especially in the knee joint, is heterogeneous; only 13.2%
of the 2,483 knee OA patients followed for 24 months could
be characterized as progressors (which might be of clinical
significance), as defined by a changed JSW outside of the
measurement error (JSW change >0.6 mm). Therefore, the
use of JSW changes in knee OA studies is such that a mini-
mum follow-up of at least 24 months and a cohort of several
thousands is necessary to establish the effect of pharmaco-
logical interventions on OA disease progression.
Magnetic resonance imaging (MRI) allows for the precise vis-
ualization of joint structures such as cartilage, bone, synovium,
ligaments, and menisci, as well as their pathological changes.
Our group [5,6], among others [7-12], have recently devel-
oped and validated a system capable of quantifying knee car-
tilage volume using MRI acquisitions combined with dedicated
software. Data showed [13] that rapid disease progression
might have been predicted at the outset of the study based on
certain clinical variables: being female, having a high body
mass index (BMI), experiencing a higher level of pain and stiff-
ness, and having reduced joint mobility. Fast disease progres-
sion was further predicted by concomitant meniscal damage,
mainly in the form of tears and meniscal extrusions [14]. The
simultaneously collected standardized knee radiographs dis-
played no correlation, however, between the changes in JSW
and the concomitant loss of cartilage volume [13].
A large clinical trial assessing the effects of a bisphosphonate
on knee OA structural changes was recently completed. A
subset of 110 of these patients underwent MRI in addition to
the clinical standardized radiograph and biomarker evalua-
tions, as per the study protocol. In this longitudinal study, we
assessed this larger cohort of OA patients and identified risk
factors for greater disease progression. The cartilage volume
changes contrasted with the clinical, radiological, and biomar-
ker data. We felt it was necessary to confirm our previous
results [13,14] and provide new and clinically relevant informa-
tion from this larger patient cohort recruited through an OA
clinical trial and, therefore, corresponding to a more stringent
inclusion and exclusion criteria. Moreover, the results would
also confirm the applicability of MRI cartilage volume quantifi-
cation to the day-to-day reality of a clinical trial.
Materials and methods
Patient selection
A subset of 110 patients was selected from 1,232 patients
enrolled in a large clinical trial evaluating the impact of a
bisphosphonate on knee OA. This specific subset of patients
was recruited from the outpatient Rheumatology Clinic at the
University of Montreal Hospital Centre (CHUM), Notre-Dame
Hospital, and from the Rheumatic Disease Centre of Montreal,
both in Montreal, Quebec, Canada. Both male and female
patients were eligible for the study if they were between 40
and 80 years old, fulfilled the American College of Rheumatol-
ogy criteria for knee OA [15], and had symptomatic disease
that required medical treatment in the form of acetaminophen,
traditional nonsteroidal anti-inflammatory drugs (NSAIDs), or
selective cyclooxygenase-2 inhibitors. Eligible patients were
required to display radiological evidence of OA of the affected
knee on a radiograph obtained within six months of the outset
of the study. Finally, patients had to have a minimum JSW of
the medial compartment of between 2 and 4 mm, at least one
osteophyte, and a narrower medial compartment compared to
the lateral compartment. The measurements were done from a
baseline film using the standardized semi-flexed view, which
was contrasted with follow-up films. No patient had sole lateral
compartment disease.
Patients were excluded if they had chondrocalcinosis or an
acute or chronic infection (including tuberculosis); if their OA
of the knee was secondary to other conditions, including
inflammation, sepsis, metabolic abnormalities, and trauma; or
if they displayed any contraindication to the use of MRI. Fur-
ther exclusion factors included patients' history of past or
present gastrointestinal ulceration, their receipt of an intra-
articular corticoid injection in the study knee within the six
months prior to the outset of the study, as well as their classi-
fication as radiological grade IV on the Kellgren-Lawrence
scale for the study knee or severe (class IV) functional disabil-
ity. In patients in whom both knees were symptomatic, we
chose the most symptomatic knee for the investigation.
Patients were permitted to receive simple analgesics or
NSAIDs, the regimens of which could be changed according
to the preference of the rheumatologist and the clinical course
of the patient. Such regimens, as well as any changes to them,
were closely monitored and noted. Because of its potential to
promote OA cartilage degeneration, the use of indomethacin
was not permitted [16]. A centralized ethics committee
approved this study, and each patient gave informed consent.
Clinical evaluation
Patients underwent clinical evaluation at baseline and every 6
months thereafter until 24 months. They were first evaluated
on the basis of the Western Ontario McMaster Osteoarthritis
Index (WOMAC), a tri-dimensional self-administered question-
naire that probes pain (5 items), stiffness (2 items), and phys-
ical function (17 items) [17]. Its French-Canadian translation
has been fully validated and established as reliable [18]. In
addition, the patients themselves used a visual analog scale to
make a global assessment of their condition (patient global
assessment: 0 = very good; 100 = very bad) and to rate the
pain they were experiencing that day (patient pain score: 0 =
no pain; 100 = most severe pain). Finally, the SF-36, a generic
quality of life instrument, was administered to the patients at
Available online />Page 3 of 12
(page number not for citation purposes)
each visit [19]. A washout of medications was done prior to
the clinical evaluation; NSAIDs were discontinued at least 48
hours prior to the investigation and acetaminophen, 24 hours.
The clinical evaluators were blinded to the results of previous
radiological or MRI data.
Knee X-rays
The JSW of the target knees was evaluated at baseline and at
12 and 24 months of follow-up, at the narrowest point in the
medial tibio-femoral compartment according to the published
protocol [20]. This protocol allows for the standardization of
radiographs by positioning the knee in a semi-flexed position
under fluoroscopic guidance and by fixing a metal sphere to
the fibula head to correct the effects of the radiographic mag-
nification. The films were digitized using a Lumiscan 200 laser
film digitizer (Lumisys Inc., Sunnyvale, CA, USA), prior to
which all films were bar-coded to ensure that, on digitization,
the computer database would link patient/visit data to the
JSW measurement obtained from each radiograph. Each of
the radiographs measured the minimum JSW in the medial
compartment using the automated computerized method of
measurement [21]. In the rare occurrence that the radio-
graphic quality of the film prevented the implementation of
automatic JSW measurement software, manual intervention
was required. In such cases, manual intervention ensured reli-
able JSW measurement by aiding the algorithm to trace the
articular contour [22]. The variation coefficient for JSW meas-
urement for the original reliability study was 1% for repeat radi-
ographs (test/retest) of the knee in the semi-flexed position
[20]. The reproducibility of the method was also reassessed
recently by Buckland-Wright and colleagues [23]; data
showed that 45% of the examinations achieved high quality,
that is, JSW difference between repeat films <0.1 mm, and
92% achieved excellent to good quality with a difference
between repeat films <0.3 mm.
Knee MRI
High-resolution, three-dimensional MRI was obtained for each
OA patient at baseline and at 12 and 24 months using the
commercially available Magneton Vision 1.5 Tesla machine
with a dedicated knee coil (Siemens, Erlangen, Germany), as
previously described [5,13] These exams are optimized three-
dimensional fast inflow with steady state precession (FISP)
acquisitions with fat suppression. The positioning protocol,
image processing, and registration were as formerly described
[5,13] This registration procedure previously demonstrated
excellent intra- and inter-reader correlations [5]. The OA
patient repositioning, intra-reader performance precision and
root mean square coefficient of variation (RMS CV%) using
registration of the paired images for the repeated measures
were 2.2% for the global cartilage volume, 1.2% for the medial
compartment, and 2.6% for the lateral compartment [13].
These findings were very similar to results published by other
research groups [9,24] The MRI acquisitions (baseline versus
follow-up acquisition) were read paired, but blinded to the
order of the acquisitions: 12 and 24 months.
The change in cartilage volume over time was calculated com-
pared to baseline in absolute values (mm
3
) and in percentage
values for the entire knee (global) and for each of the knee
compartments (medial compartment: summation of the medial
femoral condyle and tibial plateau volume; lateral compart-
ment: summation of lateral femoral condyle and tibial plateau
volume, femoral compartment: summation of medial and lateral
femoral condyle and tibial compartment: summation of medial
and lateral tibial plateau), respectively.
Meniscal damage and bone edema
The meniscal and bone evaluation was performed using the
same sequences as for the cartilage assessment, as previ-
ously discussed [14]. Regardless, the FISP sequence enabled
us to visualize the meniscal tissue and bone lesions with
enough clarity to adequately and reliably perform the semi-
quantitative scoring system [14]. A semi-quantitative lesion
assessment of meniscal damage and bone edema was per-
formed. Knee menisci and bone lesions were evaluated by an
experienced radiologist (MJB) who was blinded to the time
sequences and cartilage volumes, while the cartilage volume
assessment was performed separately by two different read-
ers who were blinded to the radiologist's grading.
Our scoring system for meniscal damage referred to the
accepted MRI nomenclature for meniscal anatomy, which is in
accordance with arthroscopic literature [25,26]. The propor-
tion of the menisci affected by degeneration, tear, or extrusion
was scored separately using the following semi-quantitative
scale [14]: 0 = no damage; 1 = 1 out of 3 meniscal areas
involved (anterior, middle, posterior horns); 2 = 2 out of 3
involved; 3 = all 3 areas involved. The extent of meniscal extru-
sion on the medial or lateral edges of the femoral tibial joint
space, not including the osteophytes, was evaluated for the
anterior, middle, and posterior horns of the menisci in which 0
= no extrusion, 1 = partial meniscal extrusion, and 2 = com-
plete meniscal extrusion with no contact with the joint space.
For bone edema, the intensity and extent of the lesion was
assessed in the medial and lateral tibio-femoral compartments
with the following semi-quantitative scale: 0 = absence of
edema; 1 = mild to moderate edema, meaning a small or
medium-sized lesion; and 2 = severe edema, meaning a large
one. The results are presented by either presence or absence
of any edema (grade 1 or 2) and presence or absence of one
severe edema lesion (grade 2 only), regardless of the pres-
ence of additional smaller lesions.
Reliability of our scoring system for meniscal and bone
changes was excellent. The intra- and inter-reader correlation
coefficient ranged from 0.86 to 0.96 for the meniscal tear,
0.85 to 0.92 for the meniscal extrusion and 0.88 to 0.93 for
Arthritis Research & Therapy Vol 8 No 1 Raynauld et al.
Page 4 of 12
(page number not for citation purposes)
the bone marrow edema. Kappa statistics ranged from 0.79 to
0.89 for the meniscal changes and 0.78 to 0.87 for the bone
marrow edema (data not shown).
Biomarkers
Level of urinary C-terminal cross-linking telopeptide of colla-
gen type II (U-CTX-II), a biological marker of collagen type II
degradation, was measured by a specific ELISA [27]. Early
morning fasting second void urine samples were collected at
baseline, month 6, 12 and 24 (exit). The samples were taken
between 6 hours and 21 hours and not necessarily collected
at the same time of the day for each patient. Inter- and intra-
variability was lower than 10% for the assay.
Statistical analysis
All of the data (clinical, radiological, and laboratory) were sys-
tematically entered into a computerized database using a
blinded double-entry procedure, after which descriptive statis-
tics for patient characteristics were tabulated. The primary var-
iable of interest for this publication was the change in cartilage
volume over time for the entire knee (global) and for each of
the knee compartments (medial or lateral), respectively. The
cartilage volume losses are presented as percentage losses
compared to baseline (mean ± standard deviation) and statis-
tical relevance assessed by a one-sample t test.
A K-means cluster analysis, a non-parametrical statistical
method, was used to identify subgroups of disease progres-
sion based on cartilage volume loss at 24 months. These sub-
groups were further analyzed to contrast their baseline
demographic, clinical, radiological, and biomarker features,
and presented as mean ± standard deviation. Non-parametric
Wilcoxon one-sample tests, one-sample and two-sample Stu-
dent t tests, chi-squares, or the McNear exact test were per-
formed to assess statistical significance. Multivariate linear
analyses were used to assess predictors of cartilage volume
loss independently from potential confounders like age, gen-
der and BMI. Further analyses were done by dividing the
cohort by quartiles of cartilage volume loss in which the first
quartile demonstrated greater cartilage volume loss. Finally,
the relationship between cartilage volume loss and the change
in JSW was explored at 24 months using the Spearman corre-
lation test. All statistical analyses were done using Statistica,
version 6 packages (StatSoft, Tulsa, OK, USA). All tests were
two-sided, and a p value = 0.05 was considered statistically
significant. Analyses were not corrected for multiple
comparisons.
Results
Patient characteristics
A subgroup of 110 patients was assessed with quantitative
MRI (qMRI); three patients were lost to follow-up early in the
study. At baseline, the cohort was largely in line with the demo-
graphic and disease characteristics of a general OA popula-
tion: the mean age was 62.4 ± 7.5 years, 64% of subjects
were female, subjects had an average BMI of 30.6 ± 4.3 kg/
m
2
, the duration of knee OA was 8.9 ± 7.2 years, 91.4% were
taking analgesics, and 72% were using NSAIDs, and these
patients were exhibiting disease activity scores in the mild to
moderate range according to the WOMAC (total, 38.9 ±
22.9), the Patient Global (visual analog scale, 48.2 ± 5.0), the
SF-36 (38.1 ± 9.5), and the Kellgren-Lawrence score (grade
2: 53% of the patients; grade 3: 47%). The mean JSW meas-
ure at baseline was 2.88 ± 0.64 mm. These baseline charac-
teristics of the 110 subjects were very similar according to
age, gender, BMI and baseline WOMAC pain, stiffness and
function values to the 1,232 subjects enrolled in the large clin-
ical trial. The patients represent all those enrolled in Montreal
for the bisphosphonate study and all had MRI. There was no
effect of any bisphosphonate treatment group on the rate of
knee OA progression as measured by either cartilage volume
per MRI or the JSW loss at two years (data not shown). We
felt, therefore, that all the patients may be considered as a
unique group and analyzed as such.
Cartilage volume changes over time
At 12 months (Table 1), there was already a statistically signif-
icant loss of cartilage volume in the global (-3.7 ± 3.0%),
medial (-5.5 ± 4.3%), and lateral compartments (-2.1 ± 2.9%)
compared to baseline (p < 0.0001, one-sample t test). At 24
months, further cartilage volume loss was evident in the global
(-5.7 ± 4.4%), medial (-8.3 ± 6.5%), and lateral compartments
(-3.5 ± 3.8%), which were all statistically significant when
compared to baseline (p < 0.0001). The lower rate seen for
the lateral compartment may be explained by the selection of
this population according to the inclusion/exclusion criteria;
patients with isolated lateral compartment knee OA as defined
with standing knee X-rays were excluded. The results of the
femoral and tibial compartments demonstrated similar and sta-
tistically significant results and are presented in Table 1.
With the use of cluster analysis, we identified three different
subgroups of disease progression (Figure 1) at 24 months
according to the global volume loss. A subgroup of 11
patients clearly demonstrated a faster progression of global
cartilage volume loss (-13.2 ± 0.4%, p < 0.0001, t test com-
pared to baseline) compared to 48 patients with an intermedi-
ate rate of cartilage loss (-7.2 ± 0.6%, p < 0.001, t test
compared to baseline), and 48 patients with a slow loss rate (-
2.3 ± 0.4%, p not significant). These three groups now
defined as slow, intermediate or fast are labeled as such
throughout the text. Among the three groups, a greater relative
cartilage volume loss was observed in the medial compart-
ment of the same patients identified as fast and intermediate
groups at 24 months with -21.5 ± 0.1% and -9.9 ± 0.1% loss,
respectively (p < 0.0001). In contrast, very little progression (-
3.2 ± 0.6%) was found in the medial compartment of the slow
progressors.
Available online />Page 5 of 12
(page number not for citation purposes)
Characteristics of the slow, intermediate, and fast
progressors
Table 2 shows the baseline patient characteristics of the three
subgroups defined by their global compartment cartilage vol-
ume loss; Table 3 shows the clinical data; and Table 4 shows
the meniscal and bone change data. The data show statistical
differences between some baseline variables of patients with
fast and slow progression (Table 2), including age, higher
weight and BMI. No significant difference was seen between
the groups in terms of the initial joint space width or cartilage
volume. The difference between the subgroups using the
WOMAC (Table 3) global and clinical variables, including
pain, stiffness, and function, did not reach statistical signifi-
cance either, although a possible trend toward a worse base-
line condition for the fast group was shown.
For the meniscal changes, in absolute numbers, 85 patients
had a meniscal medial tear and/or extrusion, 55 had a lateral
tear and/or extrusion, with some patients having both menisci
compartments damaged. Only six patients had an intact
meniscus. The severe medial meniscal extrusion and the
severe medial tear (Table 4) at baseline were strongly associ-
ated with the faster disease progression group (p < 0.0001;
ANOVA for the three groups). This was present in 73% of the
Table 1
Change of cartilage volume in absolute and percentage values at 12 and 24 months of follow-up
12 Months
a
24 Months
a
Absolute (mm
3
)(%)Absolute (mm
3
)(%)
Global cartilage -376 ± 311 -3.7 ± 3.0 -597 ± 459 -5.7 ± 4.4
Compartments
Medial -256 ± 211 -5.5 ± 4.3 -405 ± 320 -8.3 ± 6.5
Lateral -119 ± 160 -2.1 ± 2.9 -191 ± 208 -3.5 ± 3.8
Femoral -227 ± 239 -3.1 ± 3.2 -369 ± 319 -5.0 ± 4.3
Tibial -148 ± 121 -4.9 ± 4.0 -227 ± 175 -7.6 ± 5.8
Medial
Femoral -126 ± 134 -5.8 ± 6.2 -201 ± 178 -9.1 ± 7.5
Tibial -80 ± 81 -6.3 ± 5.6 -125 ± 117 -9.3 ± 7.5
Values are mean ± standard deviation.
a
All p values for the 12 and 24 month follow-up <0.0001, one-sample t test using absolute values
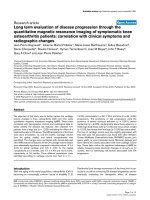
Figure 1
Changes in osteoarthritis cartilage volume percentage of loss from baseline after 24 months for each patient for the global knee and medial compart-ments of the three subgroups identified in the cluster analysis: slow (n = 48), intermediate (n = 48), and fast (n = 11) progressorsChanges in osteoarthritis cartilage volume percentage of loss from baseline after 24 months for each patient for the global knee and medial compart-
ments of the three subgroups identified in the cluster analysis: slow (n = 48), intermediate (n = 48), and fast (n = 11) progressors. The global (and
medial) volume loss at all the different time points were -2.3 ± 0.4% (-3.2 ± 0.6%) for the slow progressors, -7.2 ± 0.6% (-9.9 ± 0.1%) for the inter-
mediate progressors, and -13.2 ± 0.4% (-21.5 ± 0.1%) for the fast progressors; the intermediate and fast progressor subgroups were found to be
statistically significant when compared to baseline (t test). *p < 0. 001; **p < 0.0001.
Arthritis Research & Therapy Vol 8 No 1 Raynauld et al.
Page 6 of 12
(page number not for citation purposes)
fast compared to 19% of the slow progressors for the extru-
sion, and in 72% and 23%, respectively, for the tear
(p < 0.0001, Chi-squared test).
The presence of bone edema (Table 4) in the tibio-femoral at
the medial and/or lateral compartment also appeared to be
associated with disease progression, as it was present in 90%
Table 2
Characteristics of osteoarthritis patients at baseline
Slow Intermediate Fast P value
a
Number 48 48 11
Age 60.9 ± 7.5 63.0 ± 7.7 66.0 ± 5.0
b
0.08
Female (%) 68% 64% 45% 0.35
Weight (kg) 78.8 ± 14.0 83.0 ± 14.7 89.7 ± 13.5
b
0.06
Body mass index 29.6 ± 4.3 31.0 ± 4.3 32.6 ± 2.7
b
0.06
Joint space width (mm) 2.98 ± 0.68 2.81 ± 0.58 2.74 ± 0.58 0.31
Global cartilage volume (mm
3
) 10,013 ± 2,512 10,425 ± 2,882 11,248 ± 2,557 0.37
Medial cartilage volume (mm
3
) 4,682 ± 1,155 4,936 ± 1,434 5,245 ± 1,165 0.36
Values are mean ± standard deviation.
a
p values from ANOVA.
b
p < 0.05, two-sample t test, fast versus slow.
Table 3
Clinical characteristics of osteoarthritis patients at baseline
Slow Intermediate Fast P value
a
Pain 36.3 ± 22.8 34.5 ± 23.4 40.3 ± 19.3 0.74
Stiffness 43.4 ± 26.8 43.3 ± 27.8 47.5 ± 27.3 0.89
Function 36.5 ± 22.8 38.7 ± 25.7 49.3 ± 20.2 0.28
Total WOMAC 37.1 ± 22.2 38.3 ± 24.4 49.1 ± 17.6 0.29
Patient global 54.1 ± 27.9 51.6 ± 27.6 57.4 ± 18.1 0.78
SF-36 physical function 37.9 ± 9.5 39.3 ± 9.6 35.9 ± 9.1 0.39
Values are mean ± standard deviation. Patient global score 0–100, 100 = worst. Except for SF-36, 100 = best state.
a
p values from ANOVA.
WOMAC, Western Ontario McMaster Osteoarthritis Index.
Table 4
Meniscal and bone changes in osteoarthritis patients at baseline
Slow Intermediate Fast P value
a
Meniscus
Severe medial extrusion 19% (9)
b
42% (20) 73% (8)
c
0.001
Medial tear 73% (35) 83% (40) 90% (10)
c
0.28
Severe medial tear 23% (11) 38% (18) 73% (8) 0.005
Lateral tear 50% (24) 54% (26) 45% (5) 0.84
Severe lateral tear 8% (4) 13% (6) 9% (1) 0.80
Bone
Medial edema 52% (25) 60% (29) 73% (8) 0.21
Severe medial edema 4% (2) 16% (7) 18% (2) 0.20
Medial and/or lateral
edema
54% (26) 73% (35) 90% (10)
d
0.03
a
p values from ANOVA.
b
Numbers in parentheses are absolute numbers of patients.
c
p < 0.0001, Chi-squared, fast versus slow.
d
p < 0.05, Chi-
squared, fast versus slow.
Available online />Page 7 of 12
(page number not for citation purposes)
of the fast subgroup and in 54% of the slow progressors (p <
0.05, Chi-squared fast versus slow; and p = 0.03, ANOVA for
the three groups).
No association of the presence of bone edema with clinical
symptoms was found (data not shown). Analyses on the other
compartments, medial, lateral, femoral, and tibial were also
performed and did not provide new information (data not
shown).
Comparison of changes in cartilage volume and JSW
versus clinical parameters over time
The evaluation of the clinical course of all 107 OA patients
revealed no significant correlation between the changes in
cartilage volume and the changes in clinical variables such as
the patients' and physicians' global assessments, the pain,
stiffness, and function dimensions of the WOMAC, and the
physical components of the SF-36. Values of r < 0.2 and p >
0.25 (Spearman correlation coefficient) were found for all the
variables compared to cartilage volume loss (data not shown).
For the JSW changes at 24 months, some weak correlations
were demonstrated for changes at 24 months with WOMAC
pain score and function score changes (both with r = 0.28,
p = 0.06).
Multilinear regression analysis
As the medial compartment is the most closely related to the
radiological changes, the results presented subsequently
focus on this compartment. Multilinear regression analysis was
used to investigate the association of medial cartilage volume
loss at 24 months using baseline demographics, with clinical
and imaging data as predictors controlling at the same time
potential confounders such as age, gender, and BMI (Table 5
with all the variables and Table 6 using a forward stepwise
method). The most statistically significant independent predic-
tor of medial compartment cartilage volume loss was the
severe meniscal extrusion for both models. The severe medial
tear, which was associated with the fast progressors (Table 4)
was not associated with cartilage volume loss in our multivari-
ate models (Tables 5 and 6). The strong colinearity between
meniscal tear and extrusion is a likely explanation for this
finding.
Bone edema also showed an independent association with
the cartilage loss, which was statistically significant using the
stepwise method. The clinical variables, the SF-36 physical
components, and the WOMAC total score also demonstrated
some independent predictive values. Surprisingly, baseline
medial cartilage volume was also independently associated
with medial cartilage loss at 24 months. Additional multivariate
analyses comparing changes in the clinical variables at 24
months and the medial compartment cartilage loss were also
done (Table 7). These demonstrated an independent associa-
tion between medial cartilage volume loss and simultaneous
pain change at 24 months (beta coefficient -0.45, p = 0.03)
and SF-36 physical components (beta coefficient 0.22, p =
0.04). No additional association with the change of clinical
parameters was found.
Medial compartment cartilage volume versus joint space
width
Comparison of the medial compartment cartilage global vol-
ume with the medial minimal JSW obtained by radiographs at
baseline revealed some correlation between the two measure-
ments (r = 0.26, p < 0.001; data not shown). At 24 months,
the changes in the cartilage volume in the medial compart-
ments (Figure 2) revealed striking differences in the progres-
sion of these parameters compared to those in the JSW. As
Table 5
Baseline parameters predicting medial compartment cartilage
volume loss at 24 months: multivariate linear regression
Baseline parameter Regression coefficient
(beta)
T value P value
Severe medial
meniscal extrusion
-0.28 -2.68 0.008
Medial compartment
cartilage volume
-0.36 -2.56 0.012
SF36 physical
component
-0.21 -1.95 0.05
Bone edema -0.30 -1.89 0.06
Age -0.13 -1.35 0.18
Variables used in the model: age, gender, weight, body mass index,
Western Ontario McMaster Osteoarthritis Index (WOMAC) pain,
function and total score, patient global scale, SF-36 physical
component, baseline medial cartilage volume, meniscal tear and
extrusion, bone edema, smoking, urinary C-terminal crosslinking
telopeptide of collagen type II.
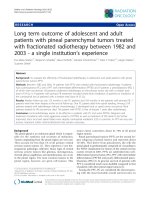
Figure 2
Scatter plot contrasting the changes in the medial compartment carti-lage volume versus minimum joint space width measured by standard-ized radiograph at 24 months for 107 OA patientsScatter plot contrasting the changes in the medial compartment carti-
lage volume versus minimum joint space width measured by standard-
ized radiograph at 24 months for 107 OA patients. Subgroups of slow
(black), intermediate (dark gray), and fast (light gray) progressors are
identified. No correlation between the cartilage volume and the mini-
mum joint space width was found.
Arthritis Research & Therapy Vol 8 No 1 Raynauld et al.
Page 8 of 12
(page number not for citation purposes)
demonstrated by MRI, while 103 patients out of 107 demon-
strated a loss of cartilage greater than zero over 24 months,
only 60 patients of the group showed a decrease greater than
zero in the JSW. Importantly, at 24 months, only one patient
demonstrated disease progression (loss greater than zero in
JSW) according to the X-rays exhibiting cartilage volume
increase in the MRI analysis. Caution is advised with such data
interpretation, however, as values that were slightly less than
zero may be within the measurement error of both techniques.
There was no apparent correlation between the cartilage vol-
ume loss changes (either by using absolute or percentage
values) and the JSW changes at 24 months (global cartilage
volume, r = 0.11; medial compartment cartilage volume, r =
0.19; Spearman correlation coefficient), despite further char-
acterization of the cohort into quartiles vis-à-vis the MRI data.
However, the first quartile of cartilage loss represents a group
in which JSW changes were also significant (p < 0.001, one
sample t test; Table 4). The addition of the presence of severe
meniscal extrusion at baseline as a covariate in multilinear
modeling did not change this weak relationship (r = 0.12),
suggesting that the discordance is not explained by such a
lesion. The data show the great variability of radiological meas-
urement, which may explain its lack of correlation with qMRI
assessments.
Correlation between meniscal extrusion and JSW at
baseline and over time
The presence of severe meniscal extrusion (score = 2), found
in 38 patients at baseline, was associated with a smaller base-
line JSW (2.45 ± 0.53 mm) compared to a greater JSW (3.09
± 0.53 mm) in the absence of such an extrusion (p < 0.001,
two-sample t test) (Table 9). The JSW did not further decrease
in this group at 12 months once the severe meniscal extrusion
was present, as with patients without meniscal extrusion. At
24 months, however, a small trend was seen. If we define
patients as progressors using a loss in JSW >0.6 mm, then 10
out of 38 patients (26%) with the presence of a severe
meniscal extrusion were found to meet such a criterion,
whereas only 4 out of 72 patients (5%) in the non-progressor
group did (JSW ≤ 0.6 mm) (p = 0.008, McNear exact test;
data not shown).
Cartilage volume and JSW versus urinary C-terminal
crosslinking telopeptide of collagen type II
The levels of U-CTX-II, a marker of cartilage degradation, were
compared with the changes in JSW and with the cartilage
volume changes at 12 and 24 months. No correlations were
seen, either between the level of the biomarker and the loss of
cartilage volume assessed by qMRI (global, medial, and lateral
compartments), or between the level of the biomarker and the
changes in JSW. The r values for both ranged from -0.06 to
0.10; no p values were statistically significant (Spearman cor-
relation test; data not shown). Moreover, the baseline level of
U-CTX-II did not predict cartilage volume loss over time.
Discussion
Very few studies have examined the quantitative changes in
cartilage volume over time in a symptomatic knee OA popula-
tion. Through the use of MRI in a longitudinal study of 107
subjects with symptomatic OA of the knee, we demonstrate a
significant global cartilage volume loss at as early as 12
months. The changes in values are in line with those from a
pilot study [13], and are also in accordance with the rate of
progression published by another group that looked specifi-
cally at tibial cartilage volumes in a younger population of
patients with knee OA [24]. The mean changes in cartilage
volume seen at 12 and 24 months are relevant as they exceed
the precision of our qMRI assessment (RMS CV%) as pre-
sented in our previous study [13].
The present study further reinforces the heterogeneity of the
OA patient population that previous clinical trials have
Table 6
Baseline parameters predicting medial compartment cartilage
volume loss at 24 months: stepwise forward multivariate
regression
Variable entry number Regression
coefficient
(beta)
T value P value
1. Severe medial meniscal
extrusion
-0.29 -3.54 <0.0001
2. Bone edema -0.34 -2.31 0.02
3. SF-36 physical component -0.20 -2.05 0.04
4. Total WOMAC -0.45 -1.87 0.06
Variables used in the model: age, gender, weight, body mass index,
Western Ontario McMaster Osteoarthritis Index (WOMAC) pain,
function and total score, patient global scale, SF-36 physical
component, baseline medial cartilage volume, meniscal tear and
extrusion, bone edema, smoking, urinary C-terminal crosslinking
telopeptide of collagen type II.
Table 7
Changes in clinical parameters associated with medial
compartment cartilage volume loss at 24 months: multivariate
linear regression
Baseline parameter Regression
coefficient
(beta)
T value P value
Pain -0.45 -2.13 0.03
Stiffness 0.03 0.21 0.82
Function -0.11 -0.24 0.81
Total WOMAC 0.52 0.88 0.37
Patient global -0.04 0.11 0.66
SF-36 physical component 0.22 2.08 0.04
Variables also included in the model: age, gender, body mass index,
Western Ontario McMaster Osteoarthritis Index (WOMAC) pain at
baseline.
Available online />Page 9 of 12
(page number not for citation purposes)
described [28,29] According to our patient cohort, fast pro-
gressors as assessed by qMRI may be associated with base-
line clinical variables: older age, having an elevated BMI,
severe meniscal extrusion and tear, and bone edema. Some of
these predictors, which have already been identified in major
epidemiological studies [13,14,28,30,31], make clinical
sense. These variables may assist in identifying patients with
disease that is likely to show marked progress over time and
for whom the consideration of therapeutic interventions is cru-
cial for preventing further joint damage. It is, however,
unknown whether such a population is adequately represent-
ative of the entire patient population for monitoring the effi-
ciency of new therapeutics in the form of DMOADs. As the
disease could be cyclical, patients may experience rapid pro-
gression at some point in the course of their disease that may
not reflect long-term progression.
Questions remain regarding patients with slow disease pro-
gression. It is unlikely that this process reflects merely the nor-
mal aging process, as these patients experienced pain and
loss of function and met the American College of Rheumatol-
ogy criteria for knee OA. We hypothesize that the slow pro-
gressors might constitute a subgroup of patients in a
quiescent phase of the disease.
Many consider the measurement of the change in the minimal
JSW of standardized knee radiographs to be the best available
methodology for evaluating the anatomical progression of OA
[3,32-34]. The present data, however, show that in only 13%
of the cases, the changes in JSW at 24 months, as measured
in full accordance with the Buckland-Wright protocol, demon-
strated cartilage loss greater than the JSW measurement error
(>0.6 mm). These radiological findings contrast with the qMRI
data over the same period, where 77% of patients showed a
significant loss of cartilage volume, that is, greater than the
precision error of 2% (data not shown). Thus, these results
suggest no strong relationship between these methods. The
lack of correlation between these two parameters may be
related to a larger relative variability in the JSW measurements.
For example, for all patients, a mean loss of 597 mm
3
of global
cartilage volume with a standard deviation of 459 mm
3
was
detected at 24 months, a change that was smaller than the
mean. In comparison, for the same cohort, a JSW loss of 0.16
mm with a standard deviation of 0.49 mm, roughly three times
greater than the mean change, was detected at 24 months.
Therefore, the 'effect size', defined as the mean change
divided by its standard deviation, of qMRI assessments
appears superior to that of JSW assessments.
In this study, we found some association between the extent
of cartilage volume loss and changes in pain at 24 months (p
= 0.03) when using a multivariate analysis approach, which
was, however, not demonstrated by direct correlation. The
patients' analgesic and NSAID washout period prior to the
clinical evaluation likely reinforces the explanation of this phe-
nomenon. Our findings are in accordance with Hunter and col-
leagues [35], who found that pain was associated with patellar
but not with tibio-femoral cartilage loss, and somewhat with
Wluka and colleagues [36], who demonstrated a weak asso-
ciation between the worsening of OA symptoms (knee pain
and stiffness) and increased tibial cartilage loss. The relative
paucity of association between symptoms and cartilage loss
found in our study is perhaps unsurprising, as pain does not
originate from the cartilage itself; rather, it likely originates from
the surrounding bones, menisci, capsule, and ligaments. This
weak association with OA symptoms may also be related to
the limited number of articular features assessed by our MRI
scoring system. Yet, since our cohort was relatively small, the
statistical significance of our findings demonstrated only by a
multivariate approach could be due to insufficient statistical
power. Taken together, these data suggest that knee OA
Table 8
Medial cartilage volume loss and joint space width changes at
24 months
Cartilage volume
change (mm
3
)
Joint space width
change (mm)
r
a
All -405 ± 320 -0.16 ± 0.49 0.19
1st quartile
b
-793 ± 342 -0.39 ± 0.52
c
0.15
2nd quartile -413 ± 86 -0.13 ± 0.37 0.11
3rd quartile -277 ± 81 -0.03 ± 0.52 0.00
4th quartile -115 ± 122 +0.02 ± 0.15 -0.21
Values are mean ± standard deviation.
a
p = NS, Spearman
correlation.
b
1st quartile = greatest loss of global cartilage volume.
c
p
< 0.001, one sample t test comparing JSW change at 24 months
versus its baseline value.
Table 9
Role of severe meniscal extrusion in joint space width and
global cartilage volume changes over time
Severe extrusion
a
Absence (n = 72) Presence (n = 38)
Joint space width (mm)
Baseline 3.09 ± 0.56 2.45 ± 0.53
b
Change at 12 months -0.05 ± 0.42 -0.07 ± 0.38
c
Change at 24 months -0.09 ± 0.40 -0.22 ± 0.51
c
Global cartilage volume
Loss (%)
Change at 12 months -3.27 ± 2.96 -4.62 ± 3.43
d
Change at 24 months -4.79 ± 4.00 -8.19 ± 5.05
b
Values are mean ± standard deviation.
a
Severe = complete meniscal
extrusion.
b
p = 0.001.
c
p = not significant.
d
p = 0.02, two samples
Student t test comparing the absence versus presence of severe
extrusion.
Arthritis Research & Therapy Vol 8 No 1 Raynauld et al.
Page 10 of 12
(page number not for citation purposes)
structural progression may be distinct from symptomatic
changes.
We found an important relationship between cartilage volume
loss and the surrounding knee tissue damage as assessed by
MRI. For instance, the presence of meniscal damage, espe-
cially meniscal extrusion, was strongly associated with carti-
lage volume loss. In fact, 101 of our patients had at least some
meniscal damage, either medial or lateral. We tried to analyze
patients without meniscal damage to look at other predictors
but, unfortunately, the subcohort of six patients was not large
enough to yield other conclusions. The progression rate of
patients without meniscal damage was -3.0% for global
cartilage and -2.7% for the medial compartment. Five of these
patients were classified as slow progressors and one as inter-
mediate (data not shown).
This high level of meniscal damage (78%) may appear unu-
sual. Our patients were selected based on inclusion/exclusion
criteria for which the presence of radiological knee OA on the
medial compartment plus the presence of JSW between 2 and
4 mm was necessary. It is probable that these patients may
represent a more advanced disease state and that a meniscal
lesion, a structure that greatly influences the JSW assess-
ment, could almost be a prerequisite to obtain a JSW of 2 to
4 mm on standing X-rays. To further reinforce this hypothesis,
our previous study on 32 subjects [13] showed a similar pro-
portion of patients with knee meniscal damage (75%). Inter-
estingly, inclusion in this cohort required the same JSW
criteria with respect to the medial compartment. Our findings
are in agreement with previous studies that reported that a sig-
nificant percentage of patients with symptomatic knee OA had
meniscal damage when assessed by MRI [37-39].
Cicuttini and colleagues [30] suggested that an accelerated
loss of cartilage over time was evident in patients who under-
went partial meniscectomy. These results suggest that the key
role of the meniscal apparatus is protecting cartilage, espe-
cially in elderly subjects with obesity or joint instability. Biswal
and colleagues [40] also recently studied risk factors associ-
ated with progressive cartilage loss in the knee using MRI in
43 patients. Patients were evaluated at baseline and after an
average 1.8 year follow-up. This study demonstrated that
meniscal and anterior cruciate ligament tears were associated
with more rapid cartilage loss.
Our study also demonstrated the association between carti-
lage volume loss and the presence of bone edema. Felson and
colleagues (([41] have already demonstrated the influence of
structural changes in assessing knee OA. This group also
demonstrated that bone edema as assessed by MRI was
strongly associated with pain in knee OA, which was not
clearly found in our study (data not shown). A possible expla-
nation for this discrepancy may be the fact that the patient
cohort recruited for our large clinical trial was less sympto-
matic than patients who had potentially more severe knee pain.
The lack of correlation between the U-CTX-II levels and the
cartilage volume loss found in the present study contradicts
other studies [4,27,42,43] The large variability in this marker,
including its diurnal variation, in our cohort may explain the lack
of association; nonetheless, it is still not certain whether such
a marker may be more useful in larger patient cohorts followed
for a longer period.
This study, like any other, has its limitations. Our cohort is rep-
resentative of the average patient population with typical knee
OA that is seen at a rheumatology clinic. This study is of nota-
ble confirmatory value in terms of the results obtained from a
smaller number of patients [13]. However, as no therapeutic
intervention to decelerate or halt disease progression has
been assessed with qMRI, the extent to which such effective
intervention could translate to the patients' clinical features
remains unclear. As we are unaware whether all OA patients
experience fast disease progression at the same time (for
example, another group may have progression in year 3 while
the previous progressors remain dormant), it is unclear which
subpopulation could benefit the most from DMOADs. Hypo-
thetically, favoring the treatment of patients with fast disease
progression, as they likely have the poorest prognoses and the
greatest need for surgical intervention, seems logical.
One may also question the potential partiality of the non-blind-
ing of the cartilage when meniscal or bone assessment was
done. However, as the radiologist evaluation was performed
completely separately from the assessment of cartilage vol-
ume, it is unlikely that the grading of meniscal damage was
biased by the concomitant visualization of the cartilage. We
also acknowledge that the FISP sequence may not be the
optimal MR sequence for identifying all the meniscal and bone
lesions. It has sufficient contrast, however, to identify signifi-
cant lesions, especially edema, as demonstrated in this previ-
ous work, and this acquisition has the unique advantage of
being able to assess simultaneously the cartilage, menisci and
bone.
Conclusion
Our study confirms the feasibility of the long-term longitudinal
follow-up of cartilage volume changes over time in a large
cohort of patients with OA. Significant knee cartilage volume
loss was detected as early as 12 months in this study and as
early as six months in our previous study [13], thus implying
that this imaging approach is much more sensitive to change
than standardized radiographs. Clinical variables and non-car-
tilage structural joint damage may be critical for the identifica-
tion of subgroups at risk of faster disease progression, a
process that would facilitate patient selection for DMOAD tri-
als. Preliminary findings assert that cartilage loss over time
translates better into knee pain than other symptomatic dimen-
Available online />Page 11 of 12
(page number not for citation purposes)
sions. Cartilage degradation as measured by qMRI should
reduce both the requisite number of patients in clinical trials
that evaluate DMOADs and the length and overall cost of such
trials, thereby improving patient retention.
Competing interests
J-P Raynauld, J Martel-Pelletier, MJ Berthiaume, G Beaudoin,
D Choquette, B Haraoui, H Tannenbaum and J-P Pelletier
received financial support from Procter & Gamble Pharmaceu-
ticals. J Martel-Pelletier and J-P Pelletier are consultants for
Procter & Gamble Pharmaceuticals. JM Meyer, JF Beary and
GA Cline are employees of Procter & Gamble
Pharmaceuticals.
Authors' contributions
JPR, JMP, MJB, GB, JMM, JFB, GAC, and JPP contributed to
the study design. DC, BH, HT, and JMP were responsible for
the acquisition of data. JPR, JMP, JMM, JFB, GAC, and JPP
analyzed and interpreted the data. JPR, JMP and JPP prepared
the manuscript. JPR and GAC performed the statistical analy-
sis. All authors read and approved the final manuscript.
Acknowledgements
We extend our most sincere gratitude to Daniel A Bloch, of the Stanford
University School of Medicine's Department of Health and Research
Policy, for his precious advice on statistics. Rupert Ward, of King's Col-
lege London, did excellent work measuring JSW on the radiographs,
and Raymonde Grégoire and France Frenette provided outstanding
patient support. We would also like to thank Santa Fiori for her assist-
ance in manuscript preparation. This study was supported in part by a
grant from Procter & Gamble Pharmaceuticals, Mason, Ohio, USA.
References
1. Hart DJ, Doyle DV, Spector TD: Incidence and risk factors for
radiographic knee osteoarthritis in middle-aged women: the
Chingford Study. Arthritis Rheum 1999, 42:17-24.
2. Lachance L, Sowers MF, Jamadar D, Hochberg M: The natural
history of emergent osteoarthritis of the knee in women. Oste-
oarthritis Cartilage 2002, 10:849-854.
3. Buckland-Wright JC: Quantitative radiography of osteoarthritis.
Ann Rheum Dis 1994, 53:268-275.
4. Bingham C, Cline G, Cohen G, Wenderoth D, Conaghan P, Buck-
land-Wright C, Beary J, Dougados M, Strand V, Meyer J: Predic-
tors of structural progression in knee osteoarthritis over 24
Months [abstract]. Arthritis Rheum 2004, 50(supp 9):254.
5. Raynauld JP, Kauffmann C, Beaudoin G, Berthiaume MJ, de Guise
JA, Bloch DA, Camacho F, Godbout B, Altman RD, Hochberg M,
et al.: Reliability of a quantification imaging system using mag-
netic resonance images to measure cartilage thickness and
volume in human normal and osteoarthritic knees. Osteoar-
thritis Cartilage 2003, 11:351-360.
6. Kauffmann C, Gravel P, Godbout B, Gravel A, Beaudoin G, Ray-
nauld J-P, Martel-Pelletier J, Pelletier J-P, DeGuise JA: Computer-
aided method for quantification of cartilage thickness and vol-
ume changes using MRI: Validation study using a synthetic
model. IEEE Trans Biomed Eng 2003, 50:978-988.
7. Eckstein F, Adam C, Sittek H, Becker C, Milz S, Schulte E, Reiser
M, Putz R: Non-invasive determination of cartilage thickness
throughout joint surfaces using magnetic resonance imaging.
J Biomech 1997, 30:285-289.
8. Hohe J, Faber S, Stammberger T, Reiser M, Englmeier KH, Eck-
stein F: A technique for 3D in vivo quantification of proton den-
sity and magnetization transfer coefficients of knee joint
cartilage. Osteoarthritis Cartilage 2000, 8:426-433.
9. Hyhlik-Durr A, Faber S, Burgkart R, Stammberger T, Maag KP,
Englmeier KH, Reiser M, Eckstein F: Precision of tibial cartilage
morphometry with a coronal water-excitation MR sequence.
Eur Radiol 2000, 10:297-303.
10. Peterfy CG, van Dijke CF, Janzen DL, Gluer CC, Namba R, Majum-
dar S, Lang P, Genant HK: Quantification of articular cartilage in
the knee with pulsed saturation transfer subtraction and fat-
suppressed MR imaging: optimization and validation. Radiol-
ogy 1994, 192:485-491.
11. Cicuttini F, Forbes A, Asbeutah A, Morris K, Stuckey S: Compari-
son and reproducibility of fast and conventional spoiled gradi-
ent-echo magnetic resonance sequences in the determination
of knee cartilage volume. J Orthop Res 2000, 18:580-584.
12. Frank LR, Wong EC, Luh WM, Ahn JM, Resnick D: Articular car-
tilage in the knee: mapping of the physiologic parameters at
MR imaging with a local gradient coil – preliminary results.
Radiology 1999, 210:241-246.
13. Raynauld JP, Martel-Pelletier J, Berthiaume MJ, Labonté F, Beau-
doin G, de Guise JA, Bloch DA, Choquette D, Haraoui B, Altman
RD, et al.: Quantitative magnetic resonance imaging evaluation
of knee osteoarthritis progression over two years and correla-
tion with clinical symptoms and radiologic changes. Arthritis
Rheum 2004, 50:476-487.
14. Berthiaume MJ, Raynauld JP, Martel-Pelletier J, Labonté F, Beau-
doin G, Bloch DA, Choquette D, Haraoui B, Altman RD, Hochberg
M, et al.: Meniscal tear and extrusion are strongly associated
with the progresion of knee osteoarthritis as assessed by
quantitative magnetic resonance imaging. Ann Rheum Dis
2005, 64:556-563.
15. Altman RD, Asch E, Bloch DA, Bole G, Borenstein D, Brandt KD,
Christy W, Cooke TD, Greenwald R, Hochberg M, et al.: Develop-
ment of criteria for the classification and reporting of osteoar-
thritis. Classification of osteoarthritis of the knee. Arthritis
Rheum 1986, 29:1039-1049.
16. Huskisson EC, Berry H, Gishen P, Jubb RW, Whitehead J: Effects
of antiinflammatory drugs on the progression of osteoarthritis
of the knee. LINK Study Group. Longitudinal investigation of
nonsteroidal antiinflammatory drugs in knee osteoarthritis. J
Rheumatol 1995, 22:1941-1946.
17. Bellamy N, Buchanan WW, Goldsmith CH, Campbell J, Stitt LW:
Validation study of WOMAC: a health status instrument for
measuring clinically important patient relevant outcomes to
antirheumatic drug therapy in patients with osteoarthritis of
the hip or knee. J Rheumatol 1988, 15:1833-1840.
18. Raynauld JP, Bellamy N, Choquette D: A French-version of the
WOMAC questionnaire. Arthritis Rheum 1994, 37:158.
19. Ware JE Jr, Sherbourne CD: The MOS 36-item short-form
health survey (SF-36). I. Conceptual framework and item
selection. Med Care 1992, 30:473-483.
20. Buckland-Wright JC, Macfarlane DG, Williams SA, Ward RJ:
Accuracy and precision of joint space width measurements in
standard and macroradiographs of osteoarthritic knees. Ann
Rheum Dis 1995, 54:872-880.
21. Buckland-Wright JC, Macfarlane DG, Jasani MK, Lynch JA: Quan-
titative microfocal radiographic assessment of osteoarthritis
of the knee from weight bearing tunnel and semiflexed stand-
ing views. J Rheumatol 1994, 21:1734-1741.
22. Lynch JA, Buckland-Wright JC, Macfarlane DG: Precision of joint
space width measurement in knee osteoarthritis from digital
image analysis of high definition macroradiographs. Osteoar-
thritis Cart 1993, 1:209-218.
23. Buckland-Wright JC, Bird CF, Ritter-Hrncirik CA, Cline GA, Tonkin
C, Hangartner TN, Ward RJ, Meyer JM, Meredith MP: X-ray tech-
nologists' reproducibility from automated measurements of
the medial tibiofemoral joint space width in knee osteoarthri-
tis for a multicenter, multinational clinical trial. J Rheumatol
2003, 30:329-338.
24. Cicuttini FM, Wluka AE, Stuckey SL: Tibial and femoral cartilage
changes in knee osteoarthritis. Ann Rheum Dis 2001,
60:977-980.
25. Beltran J: The Knee. In MRI of the Musculoskeletal System Phil-
adelphia, PA: JB Lippincott Company; 1990:7.29-7.5.
26. Resnick D, Kang HS: Chapter 16, The knee. In Internal Derange-
ments of Joints: Emphasis on MR imaging Edited by: Catherine
Fix. Philadelphia, PA: WB Saunders; 1997:562-630.
27. Garnero P, Ayral X, Rousseau JC, Christgau S, Sandell LJ, Douga-
dos M, Delmas PD: Uncoupling of type II collagen synthesis
Arthritis Research & Therapy Vol 8 No 1 Raynauld et al.
Page 12 of 12
(page number not for citation purposes)
and degradation predicts progression of joint damage in
patients with knee osteoarthritis. Arthritis Rheum 2002,
46:2613-2624.
28. Christensen R, Astrup A, Bliddal H: Weight loss: the treatment of
choice for knee osteoarthritis? A randomized trial. Osteoarthri-
tis Cartilage 2005, 13:20-27.
29. Pavelka K, Gatterova J, Altman RD: Radiographic progression of
knee osteoarthritis in a Czech cohort. Clin Exp Rheumatol
2000, 18:473-477.
30. Cicuttini FM, Forbes A, Yuanyuan W, Rush G, Stuckey SL: Rate of
knee cartilage loss after partial meniscectomy. J Rheumatol
2002, 29:1954-1956.
31. Felson DT, Lawrence RC, Dieppe PA, Hirsch R, Helmick CG, Jor-
dan JM, Kington RS, Lane NE, Nevitt MC, Zhang Y, et al.: Oste-
oarthritis: new insights. Part 1: the disease and its risk factors.
Ann Intern Med 2000, 133:635-646.
32. Duryea J, Zaim S, Genant HK: New radiographic-based surro-
gate outcome measures for osteoarthritis of the knee. Oste-
oarthritis Cartilage 2003, 11:102-110.
33. Vignon E, Piperno M, Le Graverand MP, Mazzuca SA, Brandt KD,
Mathieu P, Favret H, Vignon M, Merle-Vincent F, Conrozier T:
Measurement of radiographic joint space width in the tibi-
ofemoral compartment of the osteoarthritic knee: comparison
of standing anteroposterior and Lyon schuss views. Arthritis
Rheum 2003, 48:378-384.
34. Bruyere O, Honore A, Ethgen O, Rovati LC, Giacovelli G, Henrotin
YE, Seidel L, Reginster JY: Correlation between radiographic
severity of knee osteoarthritis and future disease progression.
Results from a 3-year prospective, placebo-controlled study
evaluating the effect of glucosamine sulfate. Osteoarthritis
Cartilage 2003, 11:1-5.
35. Hunter DJ, March L, Sambrook PN: The association of cartilage
volume with knee pain. Osteoarthritis Cartilage 2003,
11:725-729.
36. Wluka AE, Wolfe R, Stuckey S, Cicuttini FM: How does tibial car-
tilage volume relate to symptoms in subjects with knee
osteoarthritis? Ann Rheum Dis 2004, 63:264-268.
37. Boegard T, Rudling O, Petersson IF, Jonsson K: Correlation
between radiographically diagnosed osteophytes and mag-
netic resonance detected cartilage defects in the tibiofemoral
joint. Ann Rheum Dis 1998, 57:401-407.
38. Bhattacharyya T, Gale D, Dewire P, Totterman S, Gale ME,
McLaughlin S, Einhorn TA, Felson DT: The clinical importance of
meniscal tears demonstrated by magnetic resonance imaging
in osteoarthritis of the knee. J Bone Joint Surg Am 2003, 85-
A:4-9.
39. Link TM, Steinbach LS, Ghosh S, Ries M, Lu Y, Lane N, Majumdar
S: Osteoarthritis: MR imaging findings in different stages of
disease and correlation with clinical findings. Radiology 2003,
226:373-381.
40. Biswal S, Hastie T, Andriacchi TP, Bergman GA, Dillingham MF,
Lang P: Risk factors for progressive cartilage loss in the knee:
a longitudinal magnetic resonance imaging study in forty-
three patients. Arthritis Rheum 2002, 46:2884-2892.
41. Felson DT, Chaisson CE, Hill CL, Totterman SM, Gale ME, Skinner
KM, Kazis L, Gale DR: The association of bone marrow lesions
with pain in knee osteoarthritis. Ann Intern Med 2001,
134:541-549.
42. Garnero P, Piperno M, Gineyts E, Christgau S, Delmas PD, Vignon
E: Cross sectional evaluation of biochemical markers of bone,
cartilage, and synovial tissue metabolism in patients with knee
osteoarthritis: relations with disease activity and joint damage.
Ann Rheum Dis 2001, 60:619-626.
43. Ding C, Garnero P, Cicuttini F, Scott F, Cooley H, Jones G: Knee
cartilage defects: association with early radiographic osteoar-
thritis, decreased cartilage volume, increased joint surface
area and type II collagen breakdown. Osteoarthritis Cartilage
2005, 13:198-205.