Báo cáo y học: "Variability in synovial inflammation in rheumatoid arthritis investigated by microarray technolog" ppt
Bạn đang xem bản rút gọn của tài liệu. Xem và tải ngay bản đầy đủ của tài liệu tại đây (2.12 MB, 13 trang )
Open Access
Available online />Page 1 of 13
(page number not for citation purposes)
Vol 8 No 2
Research article
Variability in synovial inflammation in rheumatoid arthritis
investigated by microarray technology
Johan Lindberg
1
, Erik af Klint
2
, Ann-Kristin Ulfgren
2
, André Stark
3
, Tove Andersson
1
,
Peter Nilsson
1
, Lars Klareskog
2
and Joakim Lundeberg
1
1
Department of Biotechnology, AlbaNova University Center, Royal Institute of Technology, S-106 91 Stockholm, Sweden
2
Department of Rheumatology, Karolinska Institutet, Karolinska University Hospital, 171 76 Stockholm, Sweden
3
Department of Orthopedics, Karolinska University Hospital, 171 76 Stockholm, Sweden
Corresponding author: Joakim Lundeberg,
Received: 3 Jul 2005 Revisions requested: 9 Sep 2005 Revisions received: 18 Nov 2005 Accepted: 23 Jan 2006 Published: 16 Feb 2006
Arthritis Research & Therapy 2006, 8:R47 (doi:10.1186/ar1903)
This article is online at: />© 2006 Lindberg et al.; licensee BioMed Central Ltd.
This is an open access article distributed under the terms of the Creative Commons Attribution License ( />),
which permits unrestricted use, distribution, and reproduction in any medium, provided the original work is properly cited.
Abstract
In recent years microarray technology has been used
increasingly to acquire knowledge about the pathogenic
processes involved in rheumatoid arthritis. The present study
investigated variations in gene expression in synovial tissues
within and between patients with rheumatoid arthritis. This was
done by applying microarray technology on multiple synovial
biopsies obtained from the same knee joints. In this way the
relative levels of intra-patient and inter-patient variation could be
assessed. The biopsies were obtained from 13 different
patients: 7 by orthopedic surgery and 6 by rheumatic
arthroscopy. The data show that levels of heterogeneity varied
substantially between the biopsies, because the number of
genes found to be differentially expressed between pairs of
biopsies from the same knee ranged from 6 to 2,133. Both
arthroscopic and orthopedic biopsies were examined, allowing
us to compare the two sampling methods. We found that the
average number of differentially expressed genes between
biopsies from the same patient was about three times larger in
orthopedic than in arthroscopic biopsies. Using a parallel
analysis of the tissues by immunohistochemistry, we also
identified orthopedic biopsies that were unsuitable for gene
expression analysis of synovial inflammation due to sampling of
non-inflamed parts of the tissue. Removing these biopsies
reduced the average number of differentially expressed genes
between the orthopedic biopsies from 455 to 171, in
comparison with 143 for the arthroscopic biopsies. Hierarchical
clustering analysis showed that the remaining orthopedic and
arthroscopic biopsies had gene expression signatures that were
unique for each patient, apparently reflecting patient variation
rather than tissue heterogeneity. Subsets of genes found to vary
between biopsies were investigated for overrepresentation of
biological processes by using gene ontology. This revealed
representative 'themes' likely to vary between synovial biopsies
affected by inflammatory disease.
Introduction
Rheumatoid arthritis (RA) is a common chronic inflammatory
disease, so far defined by a set of criteria [1] rather than by a
knowledge of the underlying molecular pathogenesis. Sub-
stantial efforts have been made to characterize the synovial
inflammation in RA, and during these studies it has become
evident that there is a large variability in cell content and in pro-
tein expression, both within single joints and between patients
with RA [2-7]. This variation also exists at the gene expression
level [8]. Microarray (MA) technology allows the expression of
thousands of genes to be monitored simultaneously and can
thus increase the understanding of the complicated molecular
processes of joint inflammation in more detail than has been
possible with immunohistochemistry and related techniques
[9-14]. Recently reviewed [15], MA has been used to acquire
knowledge about RA in various experimental systems with the
use of both cell cultures [16-22] and biopsies [23-30]
obtained from the synovium. So far, MA has been used to
investigate tissue heterogeneity between synovial biopsies
obtained from different patients in both juvenile RA [23] and
long-standing RA [25,30]. Tsubaki and colleagues [23] used
laser capture microdissection on biopsies retrieved by rheu-
matic arthroscopy from patients with juvenile RA to character-
ize proliferative lesions in the synovial lining. Two subgroups
aRNA = amplified RNA; coph = cophenetic correlation coefficient; DE = differentially expressed; EASE = Expression Analysis Systematic Explorer;
GO = gene ontology; HCL = hierarchical clustering; MA = microarray; PCR = polymerase chain reaction; RA = rheumatoid arthritis.
Arthritis Research & Therapy Vol 8 No 2 Lindberg et al.
Page 2 of 13
(page number not for citation purposes)
were discovered; one had a gene expression profile similar to
that of long-standing RA. Van der Pouw Kraan and colleagues
[25,30] used MA to investigate heterogeneity between syno-
vial biopsies obtained by orthopedic surgery from different
patients. In both of these studies, at least two different gene
expression profiles were observed, which were suggested to
correspond to high and low inflammatory status.
These and other studies therefore suggest that the MA tech-
nique might indeed be able to discern variable molecular fea-
tures of the joint inflammation that would be both biologically
and clinically meaningful. However, further investigation of the
potential of these gene expression patterns to predict disease
course as well as the response to various therapies is ham-
pered by an incomplete knowledge of the natural variability of
gene expression within the inflamed joints of single patients
and between different patients with RA. In this study we there-
fore compared variation in gene expression patterns at the
biopsy site, between different sites, and between patients. We
used inflamed synovial tissues of patients with RA obtained
during open surgery and during rheumatic arthroscopy, which
were our methods of choice for synovial tissue retrieval.
Materials and methods
Patients
Thirteen patients, all fulfilling the American College of Rheu-
matology classification criteria for RA [1], were included in this
study. Synovial tissues were taken from seven of these
patients with erosive, end-stage disease during knee joint
replacement surgery at the Department of Orthopedic Sur-
gery, Karolinska University Hospital, Sweden. No further data
on the characteristics of this subgroup of patients were avail-
able. Synovial tissue was obtained from the other six patients
by rheumatic arthroscopy solely for research purposes. The
clinical characteristics of these patients (five women and one
man) are shown in Table 1. All six arthroscopic patients were
recruited from the outpatient clinic of the Karolinska University
Hospital Rheumatology Unit, and all except one (patient 13)
had clinical arthritis with effusion in at least one knee joint at
the time of the investigation. All patients except one (patient
11) were using the disease-modifying anti-rheumatic drug
methotrexate, four in conjunction with low-dose corticoster-
oids, and all except one were using nonsteroidal anti-inflamma-
tory drugs. Patient 13 had been taking methotrexate for two
months; the others had been doing so for more than six
months. Patients 10, 11 and 13 had erosive disease. The Eth-
ical Committee at the Karolinska Institute approved the study
protocol and all patients gave informed consent.
Synovial tissue, sampling and handling
Orthopedic samples (patients 1 to 7)
Knee joint replacement surgery was performed in accordance
with standard procedures, during which three synovial tissue
specimens were obtained from random sites and immediately
handled by research personnel. Each biopsy was visually
inspected to minimize non-inflammatory synovial tissue con-
tamination. Each orthopedic biopsy was then split into two
parts, one of which was used for the MA experiment; the other
was saved for histochemical analysis (except for biopsy 3 of
patient 2 which was used only for MA). After dividing the bios-
pies they were snap frozen (within two minutes) in precooled
isopentane and stored at -80°C until further use, to ensure
high RNA quality. For patients 1 to 3 each half of a biopsy that
was to be used in the MA experiment was further divided into
three parts, hereafter referred to as sub-biopsies. In total this
resulted in 39 specimens from the orthopedic patients (nine
sub-biopsies from patients 1 to 3 and three biopsies from each
of patients 4 to 7). The average weight of the biopsies from
Table 1
Clinical data for patients 8 to 13
Patient Diagnosis RF Sex Age
(years)
Age at
diagnosis
Duration
of arthritis
(weeks)
DMARD Corticosteroids NSAID
8 RA - F 57 4 years 2 Methotrexate
10 mg/week
No Ketoprofen
200 mg/day
9 RA - F 69 6 months 52 Methotrexate
10 mg/week
Prednisolone
7.5 mg/day
No
10 RA + F 52 4 years 1 Methotrexate
17.5 mg/week s.c.
Prednisolone
5 mg/day
Ketoprofen
200 mg/day
11 RA + F 64 4 days 3 No Prednisolone
7.5 mg/day
since 4 days
Diklofenac
150 mg/day
12 RA + F 57 9 months 26 Methotrexate
7.5 mg/week
Prednisolone
7.5 mg/day
Indometacin
75 mg/day
13 RA + M 66 10 weeks n.a. Methotrexate
10 mg/week
No Diclofenac 50 mg
on demand
DMARD, disease-modifying anti-rheumatic drug; NSAID, non-steroidal anti-inflammatory drug; RA, rheumatoid arthritis; RF, rheumatoid factor
serology; s.c., subcutaneous.
Available online />Page 3 of 13
(page number not for citation purposes)
patients 1 to 3 before division into three parts was 99 mg,
yielding an average sub-biopsy weight of 33 mg. The average
weight of the biopsies from patients 4 to 7 was 29 mg.
Arthroscopic samples (patients 8 to 13)
Rheumatic arthroscopy was performed by a technique previ-
ously described [31], including biopsy site-scoring for signs of
inflammation (vascularity and proliferation), photography and
mapping according to local standards (not shown). Biopsies
were taken at the site of inflammation close to cartilage or not
close to cartilage, defined as less than or more than 1.5 cm
away from cartilage, respectively. Multiple biopsies were taken
from two sites in patients 8, 11, 12 and 13 and from four sites
in patients 9 and 10. The samples were frozen, as above,
within two minutes. The average weight of the arthroscopic
samples was 19 mg.
Histochemistry
Frozen biopsies were embedded in Optimal Cutting Tempera-
ture (OCT; Tissue-Tek, SAKURA Finetek, Zoeterwoude, Neth-
erlands) and cut with a cryostat into 7 µm thick. Sections were
placed on SuperFrost
®
Plus slides (Menzel-Gläser, Braunsch-
weig, Germany) and air-dried for 30 minutes, then stained with
Mayer's hematoxylin and eosin to confirm the histopathology of
each biopsy.
RNA extraction
RNA was successfully extracted from all biopsies except
biopsy 3 of patient 7, in which the RNA was degraded. For
both types of biopsy (arthroscopic and orthopedic) one biopsy
yielded enough RNA to perform MA experiments. To extract
the RNA the biopsies were placed in steel-bead matrix tubes
(Lysing Matrix D; Qbiogene, Irvine, CA, USA) containing buffer
(600 µl of phenol, 600 µl RLT of buffer from an RNeasy kit
(Qiagen, Hilden, Germany) and 0.6 µl of 2-mercaptoethanol)
and homogenized with a tabletop FastPrep homogenizer
(Qbiogene). The tubes were shaken for 30 seconds at speed
setting 6 and then put on ice for 30 seconds. This procedure
was repeated four times to ensure thorough homogenization.
The tubes were then centrifuged for 5 minutes at 12,000
r.p.m. All steps up to this point were performed at 4°C. The
water phase was collected and transferred to Qiashredder
(Qiagen) columns and centrifuged (13,000 r.p.m. at room tem-
perature) for two minutes to ensure complete homogenization.
To the flow-through was added 600 µl of 70% ethanol.
The mixture was loaded onto RNeasy spin columns (Qiagen)
and centrifuged for 15 seconds at 13,000 r.p.m. An RNeasy
kit from Qiagen was used to wash and elute the extracted RNA
(in 30 µl of RNase-free water). Before eluting the RNA the col-
umns were treated with 2 units of DNAse H (Omega Biotech,
Victoria, Canada) for 15 minutes at room temperature to
remove residual DNA contamination. For further details see
'Preparation of RNA from tissues' at the KTH microarray core
facility web site [32], under 'Protocols'. The average biopsy
weight used for RNA extraction was 28.7 mg and the average
RNA yield was 411.4 ng/µl in 30 µl. All concentration meas-
urements were made with the Nanodrop (Nanodrop Technol-
ogies, Wilmington, DE USA). RNA quality was ensured with
the RNA 6000 Nano LabChip kit of the Bioanalyzer system
(Agilent Technologies, Palo Alto, CA, USA) where pass or fail
judgments were based on an evaluation of Bioanalyzer electro-
pherograms [33]. Two samples showed signs of partial degra-
dation (patient 3, biopsy 3, and patient 6, biopsy 1). The
average ratio of 28S to 18S rRNA among the remaining sam-
ples was 1.6.
RNA amplification
Because of the small amounts of RNA extracted, the RNA was
amplified with a RiboAmp RNA amplification kit (Arcturus,
Mountain View, CA, USA). RiboAmp uses T7-based in vitro
transcription to generate amplified RNA (aRNA), the bulk of
which consists of sequences 250 to 1,800 base pairs long.
Total RNA (300 ng to 1 µg) was used in each RNA amplifica-
tion, and the average yield was 503 ng/µl in 11 µl of water.
RNA reference
Universal Human Reference RNA from Stratagene (La Jolla,
CA, USA) was used as reference RNA and was amplified in
the same manner as the sample RNA. The reference RNA was
pooled before use for hybridization.
Labeling and cDNA synthesis
To prime the reaction, 1 µl of random hexamer primer (5 µg/µl;
Operon, Alameda CA, USA) was added to 1 µg of amplified
aRNA. The volume was adjusted to 18.4 µl with RNase-free
water. The sample was mixed and incubated for 10 minutes at
70°C to denature the aRNA, then incubated for a further 5 min-
utes on ice and centrifuged briefly. A cDNA synthesis mixture
(11.6 µl) consisting of 6 µl of 5× first-strand buffer, 3 µl of 0.1
M dithiothreitol, 2 µl of Superscript III (Invitrogen, San Diego,
CA, USA) and 0.6 µl of 50× aa-dUTP+dNTP mix (Sigma-
Aldrich, St. Louis, MO, USA) was added to each sample. The
whole mixture was gently mixed by pipetting and incubated at
25°C. After 10 minutes at this temperature the mixture was
incubated at 46°C for a further 2 hours. To terminate the reac-
tion and to hydrolyze the RNA strand, 3 µl of 0.2 M EDTA pH
8.0 and 4.5 µl of 1 M NaOH were added. The sample was vor-
tex-mixed briefly, incubated for 15 minutes at 70°C, cooled to
room temperature and centrifuged briefly. Then 4.5 µl of 1 M
HCl was added to restore the pH to neutrality. The sample was
vortex-mixed and centrifuged briefly.
The cDNA was purified and eluted by the following procedure.
First, 60 µl of water and 500 µl of PB buffer (MinElute Reac-
tion Cleanup Kit; Qiagen) were added. The mixture was thor-
oughly mixed and transferred to a MinElute Reaction Cleanup
Kit spin column and centrifuged for 30 seconds at 13,000
r.p.m. The flow-through was reapplied to the column and the
centrifugation step was repeated. The flow-through was dis-
Arthritis Research & Therapy Vol 8 No 2 Lindberg et al.
Page 4 of 13
(page number not for citation purposes)
carded and 650 µl of 80% ethanol was added to the column.
The column was centrifuged for 30 seconds at 13,000 r.p.m.
and the flow-through was again discarded. The ethanol wash
step was repeated and then the membrane was dried by cen-
trifugation for 1 minute at 13,000 r.p.m. The column was trans-
ferred to a new tube, and 10 µl of 100 mM NaHCO
3
pH 9.0
was added. The column was then incubated for 1 minute at
room temperature; the sample was eluted by centrifugation for
30 seconds at 13,000 r.p.m. The elution step was repeated
after a further addition of 10 µl of 100 mM NaHCO
3
pH 9.0 to
ensure high yield.
To couple fluorophores, the eluate was mixed with a dried aliq-
uot of either Cy3 or Cy5 mono-reactive esters (Amersham-
Biosciences, Little Chalfont, Bucks., UK) and incubated for 30
minutes at room temperature in a dark container, after which
70 µl of water and 500 µl of PB buffer were added. The mix-
ture was thoroughly mixed and transferred to a MinElute Reac-
tion Cleanup Kit spin column, which was centrifuged for 30
seconds at 13,000 r.p.m. The flow-through was reapplied to
the column and the centrifugation step was repeated. The
flow-through was discarded and 650 µl of PE buffer (MinElute
Reaction Cleanup Kit) was added. The column was centri-
fuged for 30 seconds at 13,000 r.p.m. and the flow-through
was discarded. The wash step was repeated and then the
membrane was washed by centrifugation for 1 minute at
13,000 r.p.m. The column was transferred to a new tube, 10
µl of EB buffer (MinElute Reaction Cleanup Kit) was added,
and the column was incubated for 1 minute at room tempera-
ture. The sample was eluted by centrifugation for 30 seconds
at 13,000 r.p.m. The elution step was repeated after a further
addition of 10 µl of EB buffer, to ensure high yield. The con-
centrations of the incorporated fluorophore and cDNA were
measured with the Nanodrop to confirm success in the labe-
ling reaction. The sample was then ready for hybridization. For
further information about the preparation of N-hydroxysuccin-
imide-ester fluorophores and indirect labeling of cDNA see
SOP 001 and SOP 002 at the KTH microarray core facility
web site [32] under 'Protocols'.
cDNA microarray
The cDNA arrays used in this study were produced at the KTH
microarray core facility. The clones on the array originate from
the first 310 96-well plates of a commercial clone collection
containing 46,000 sequence-verified human cDNA clones
(Research Genetics; now Invitrogen). The clones have been
prepared by cell culture, plasmid preparation, PCR amplifica-
tion and purification with PCR filter plates (Millipore, Bedford
MA, USA). The cDNA was spotted in 30% dimethylsulphoxide
onto UltraGAPS slides (Corning, NY, USA) with a QArray
spotter (Genetix, Hampshire, UK) with 24 SMP2.5 pins (Tel-
echem, Sunnyvale, CA, USA) in 48 blocks, each of which con-
tained 25 × 25 clones, spotted with a center-to-center
distance of 170 µm, non-specifically attached to the surface
by UV crosslinking. According to a UniGene mapping per-
formed in September 2004 based on GenBank accession
numbers (29,717 on the whole chip), 25,087 of the 30,000
spots on the chip have a UniGene ID and 16,164 of those
were unique. For more information about the chip see the KTH
microarray core facility web site [32] under 'HUM 30k cDNA
array'.
Hybridization
After prehybridizing of the slides for 30 minutes at 42°C in pre-
hybridization buffer consisting of 1% BSA (Sigma-Aldrich), 5
× SSC (where SSC consists of 0.15 M NaCl and 0.015 M
sodium citrate) and 0.1% SDS, the arrays were washed, first
in a trough containing water and then in a trough containing
propan-2-ol, and centrifuged dry. After that the samples (one
labeled with Cy5 and the other labeled with Cy3) were pooled
and dried to a volume of 13.6 µl. Hybridization buffer consist-
ing of 5 × SSC, 50% formamide (Sigma-Aldrich), 0.1% SDS
and 0.2 µg/µl Cot-1 DNA (Invitrogen) was added to the
pooled samples to a final volume of 64.5 µl. The hybridization
mixture was then denatured for 3 minutes at 95°C and cooled
for 2 minutes on ice before being applied to the array. Lifter-
slips (Erie Scientific Company, Shelton, CT, USA) were used
to contain the hybridization mixture on the array during hybrid-
ization. The arrays were then placed, in hybridization chambers
(Corning), in a water bath at 42°C for 14 to 18 hours. After
hybridization the slides were washed once for 5 minutes at
42°C in wash buffer 1 (2 × SSC, 0.1% SDS), once for 5 min-
utes in wash buffer 2 (0.1 × SSC, 0.1% SDS) and five times,
for 1 minute each, in wash buffer 3 (0.1 × SSC). The slides
were then centrifuged dry and scanned. For further information
about the hybridization see SOP 003 at the KTH microarray
core facility web site [32] under 'Protocols'.
Scanning and image processing
An Agilent G2565BA scanner was used to scan the slides
and acquire 50-megabyte TIFF images. The scanner resolu-
tion was set at 10 µm. GenePix 5.1.0.0 (Axon Instruments,
Foster City, CA, USA) was used to extract the raw signals from
the TIFF images and to assign each spot an ID. Spots defined
as 'not found' by GenePix were flagged with a negative flag (-
50) and removed downstream in the analysis. Spots with
clearly abnormal morphology due to dust particles or other fac-
tors were manually flagged as bad (- 100) and were also
removed in downstream analysis. No further processing of the
slides was performed in GenePix. The data are available at
ArrayExpress, a public repository for MA data (accession
number E-MEXP-367) [34].
Data analysis
The data were analyzed mainly with the help of packages in R
[35] except for the Expression Analysis Systematic Explorer
(EASE) analysis [36], which was performed in MEV [37].
EASE uses the hierarchical structure of gene ontology (GO)
[38] to find biological themes among sets of differentially
expressed (DE) genes. Each GO category is given an EASE
Available online />Page 5 of 13
(page number not for citation purposes)
score, which is a conservative adjustment of Fisher's exact
probability [39] in which Fisher's exact probability is jackknifed
to weigh significance in favor of GO categories supported by
many genes. R is a language and environment for statistical
computing and graphics. The packages that were used in R
were LIMMA [40], aroma [41], the KTH package [32] and bio-
conductor [42]. All operations performed on the data in R dur-
ing analysis can be accomplished with these packages. After
the result files (gpr) produced by GenePix had been imported
into R, unreliable spots with abnormal physical properties
were removed with four filters:
1. filterFlags, which removes spots flagged as not found or
absent in GenePix.
2. filterSaturated, which removes spots saturated in both cy5
and cy3.
3. filterB2SD, which removes spots in which 70% of the pixels
have below background intensity + 2 standard deviations.
4. filterSize, which removes spots that are enlarged due to
spotting artefacts.
On average 4,030 spots were removed by the filters, leaving
about 25,970 spots for downstream analysis. More informa-
tion about the filters can be found at the KTH package web
site [32]. After filtering, the slides were normalized with print-
tip loess (local regression) normalization [43]. To identify DE
genes a parametric empirical Bayes approach implemented in
LIMMA [40,44] was used. This test statistic will assign a score
(B-score) to each gene. The B-score was used to rank the
genes so that the gene with the highest score has the highest
probability of being DE. When differences were being investi-
gated, two criteria had to be fulfilled for a gene to be regarded
as DE: the genes had to have a B-score of more than 0 and an
|M-value| of more than 1 (an M-value is the second logarithm
of the fold change [43]). When the DE genes were used to
cluster the biopsies a third criterion was added: a gene had to
occur in at least two or more comparisons between biopsies
(regardless of patient) to be used for clustering. This was done
to remove noise, because no biological replication was possi-
ble. When we were identifying DE genes between tissues with
an overrepresentation of adipose cells versus all the other
biopsies, we defined a gene as DE if the gene had a B-score
of more than 20. Here samples from all patients were used,
allowing the approximation of the different parameters used for
the test statistics, for example the standard error, to be
improved, and thus the B-scores to be high. A cutoff was
therefore set at a B-score of more than 20 to investigate a rea-
sonable number of genes with the highest ranking in this com-
parison.
A moderated t test [40] was performed in parallel, with the use
of a false discovery rate [45] correction for multiple testing.
Technical replicates were dealt with in different ways depend-
ing on the comparison in question. When three different levels
of replicates were available (for example, for patients 1 to 3 the
levels were technical replicates (i), multiple samples from each
biopsy (sub-biopsies) (ii) and the biopsy (iii) itself), instead of
just taking the average of technical replicates, we used the
duplicateCorrelation function [46] available in LIMMA [40] to
acquire an approximation of gene-by-gene variance. This
retains valuable information about the variance when fitting a
linear model to the data so as to identify DE genes. When four
levels were available, as when testing for DE genes between
patients 1 and 3 (technical replicates, sub-biopsies, biopsies
and patients), the first level was averaged and duplicateCorre-
lation was used for the sub-biopsies and biopsies. When only
two levels of replicates were available (for example when test-
ing for DE genes between biopsies in patient 4 there were
technical replicates of each biopsy that was tested) the repli-
cates were all treated in the same way.
Several hierarchical clusterings were performed [47], in which
1 minus the Pearson correlation was used as the distance
measure. When creating the agglomerative dendrogram the
average distance between each cluster was used. To evaluate
the structure the clustering algorithm imposes on the data the
cophenetic (coph) correlation coefficient [48] was deter-
mined. This measures how well the hierarchical structure from
the dendrogram represents the actual distances; coph = 1
indicates perfect representation, whereas coph = 0 indicates
no representation. To facilitate color representation in the hier-
archical clustering the (log
2
) expression value for each gene in
each of the biopsies was adjusted by subtracting the respec-
tive mean log
2
expression value across all biopsies.
Experimental design
Two series of hybridizations were performed in this study. The
design chosen for both series was a common reference
design that allows both the identification of DE genes in differ-
ent contexts and unsupervised classification, such as hierar-
chical clustering. Each hybridization was performed with a
technical replicate (the same amount of RNA taken from the
same amplified RNA aliquot labeled in two separate reactions
and hybridized onto two separate arrays). The average corre-
lation between the M-values of technical replicates was 0.97.
In the first series (Figure 1a), aRNA from the orthopedic sub-
biopsies/biopsies (depending on the patient they were
obtained from; see above) was labeled and hybridized in dupli-
cate versus the reference (also amplified). In all, 76 hybridiza-
tions were performed in this series. In the second series
(Figure 1b), aRNA from the arthroscopic biopsies was labeled
and hybridized in duplicate versus the reference. A total of 32
hybridizations were performed in this series. The gene expres-
sion data were filtered and normalized as described above.
Arthritis Research & Therapy Vol 8 No 2 Lindberg et al.
Page 6 of 13
(page number not for citation purposes)
Results
Heterogeneity between orthopedic biopsies
Two series of hybridizations were performed to investigate tis-
sue heterogeneity, as indicated in Figure 1, covering variation
both between orthopedic biopsies and between arthroscopic
biopsies. In addition, the orthopedic biopsies of patients 1 to
3 were each divided into three parts (sub-biopsies) to study
variation in gene expression between adjacent parts of the
individual biopsies. First, an analysis of the heterogeneity
between the orthopedic biopsies (b1, b2, and b3) from the
same patients (Figure 2a) was performed. To measure hetero-
geneity we applied MA technology and estimated the differ-
ences between samples by determining the number of DE
genes. Few, if any, genes should be DE between homogene-
ous tissues. As described in Materials and methods a gene
was considered to be DE if it had a B-score of more than 0 and
an |M-value| of more than 1 (that is, a more than twofold
change). The B-score is derived from a statistical test (a para-
metric empirical Bayes approach, as described in Materials
and methods) used to identify DE genes [44]. The higher the
B-score, the more evidence there is of differential expression.
The differences in gene expression seen in Figure 2a were
caused by both variation in cellular composition and true
changes in gene expression due to various factors. In all,
2,133 genes were identified as DE when comparing biopsies
1 and 2 from patient 4. In contrast, only six genes were found
to be DE when comparing biopsies 2 and 3 of patient 2. This
demonstrates that there was a high level of variation between
biopsies originating from the same joint, indicating that there
may be large differences in cellular composition between syn-
ovial biopsies obtained from patients with RA.
Heterogeneity between sub-biopsies
Variation between adjacent biopsies was investigated by sep-
arately analyzing gene expression in each of the three sub-
biopsies derived from the biopsies obtained from patients 1 to
3 (Figure 2b). Interestingly, many genes were DE (B-score>0
and an |M-value|>1) between sub-biopsies, despite apparent
homogeneity between biopsies, as exemplified by the biopsies
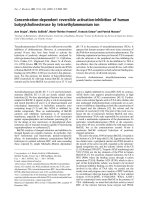
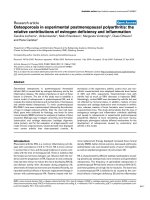
Figure 1
Experimental designExperimental design. (a) Orthopedic samples. Three orthopedic biop-
sies (b1, b2, and b3) were taken from each of seven patients at random
sites of the synovium. For patients 1 to 3 each biopsy was split into
three parts. RNA from each sub-biopsy was hybridized in duplicate
(b1.AA and b1.AB refer to biopsy 1, sub-biopsy A, technical replicates
A and B, respectively) versus the reference. The average weight of the
sub-biopsies was 33 mg. For patients 4 to 7, RNA from each biopsy
was hybridized in duplicate (b1.A and b1.B: biopsy 1, technical repli-
cates A and B, respectively) versus the reference. The average weight
of the biopsies from patients 4 to 7 was 29 mg. (b) Arthroscopic biop-
sies. Two biopsies (b1 and b2) were taken from each of patients 8 and
11 to 13, and four from each of patients 9 and 10. Each biopsy was
hybridized in duplicate versus the reference. The average weight of the
arthroscopic biopsies was 19 mg.
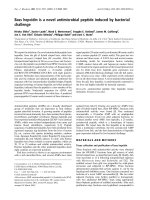
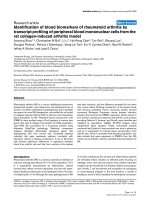
Figure 2
Differentially expressed genes between orthopedic biopsies and sub-biopsiesDifferentially expressed genes between orthopedic biopsies and sub-
biopsies. (a) As shown in the scheme at the left, comparisons were
made patient by patient between all biopsies from all seven patients.
Because of the degradation of RNA in the third biopsy, only two biop-
sies from patient 7 could be compared. The results from the between-
biopsy comparisons can be seen in the barplot at the right. The first
comparison to the left in the barplot b1b2 represents the comparison
between biopsies 1 and 2 of patient 1. In total, 4,175 unique genes
were found to vary between the different biopsies. (b) Comparisons
were performed patient by patient and biopsy by biopsy between each
sub-biopsy for patients 1, 2, and 3 in accordance with the scheme at
the left. The results from all comparisons are displayed in the barplot at
the right. The first comparison at the left in the barplot (b1.A-b1.B) illus-
trates the comparison between sub-biopsies A and B of biopsy 1 of
patient 1. In total, 2,493 unique genes were found to vary between the
sub-biopsies.
Available online />Page 7 of 13
(page number not for citation purposes)
of patient 2 (Figure 2a). However, overall the sub-biopsies
were quite similar, with the average number of DE genes being
180, 202, and 132 for patients 1, 2, and 3, respectively,
although significant differences were found in these compari-
sons. For example, biopsies b1 and b3 from patient 1 seemed
to be quite similar (Figure 2a), but further investigation found
great variation between sub-biopsies of biopsy b1 (Figure 2b).
Here, the sub-biopsies A and C seemed similar but there
seemed to be large variations in cellular composition between
sub-biopsies A and B. Furthermore, the hematoxylin/eosin
staining patterns demonstrated that biopsies b1 and b3 of
patient 1 contained an overrepresentation of adipose cells
(Figure 3), whereas b2 seemed to represent synovial hyperpla-
sia. It should be noted that the differences between biopsies
seemed to be larger than those between sub-biopsies.
Hierarchical cluster of orthopedic biopsies
Four levels of replicates were used in this study: technical rep-
licates (the same amount of RNA taken from the same ampli-
fied RNA aliquot labeled in two separate reactions and
hybridized onto two separate arrays); adjacent biopsies in the
form of sub-biopsies; multiple biopsies obtained from different
locations in the same joint and patient; and biological repli-
cates in the form of biopsies from different patients. Hierarchi-
cal clustering (HCL) analyses (Figure 4) were initially
performed to obtain an overview of the differences between
the technical replicates, resampled biological replicates (sub-
biopsies/biopsies), and biological replicates (patients). The
first HCL analysis was performed (Figure 4a) on the raw data
after filtration and normalization. As can be seen in the result-
ing clustering, the biopsies separate patient by patient except
for those from patient 1. This is consistent with data presented
in Figure 2a for this sample.
Hierarchical cluster of orthopedic biopsies using a
subset of genes
The DE genes that were found to vary between biopsies within
patients (4,175 genes; Figure 2a) and were present in one or
more comparisons (2,285 genes) were used to cluster the
data (Figure 4b). As shown in the dendrogram, this subset of
genes contains information that distinguishes between three
biopsies (biopsies 1 of patient 1, biopsies 3 of patient 1, and
biopsy 1 of patient 4). Overall the results of the HCL analysis
in Figure 4b correlated well with the hematoxylin/eosin stain-
ing patterns (Figure 3), which demonstrated that these three
biopsies had a clear overrepresentation of adipose cells rela-
tive to the other biopsies. Note that biopsies 1 and 2 of patient
7 also clustered separately, which is again explained by the
histological data although the difference was visually not as
obvious. The remaining biopsies clustered according to
Table 2
EASE results
GO ID GO term Number
of hits
EASE
score
GO:0006629 Lipid metabolism 24 6.17 × 10
-6
GO:0006631 Fatty acid metabolism 10 1.67 × 10
-4
GO:0006091 Energy pathways 13 1.71 × 10
-4
GO:0019752 Carboxylic acid metabolism 16 7.72 × 10
-4
GO:0006082 Organic acid metabolism 16 8.29 × 10
-4
The table lists Expression Analysis Systematic Explorer (EASE)
results on the 341 genes upregulated in the biopsies with an
overrepresentation of adipose cells versus the rest of the orthopedic
biopsies. The five most significant gene ontology (GO) categories are
shown.
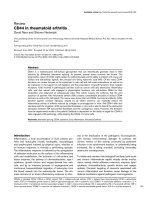
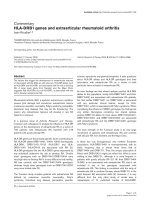
Figure 3
Hematoxylin/eosin staining of the synovial membrane of patients 1 to 7Hematoxylin/eosin staining of the synovial membrane of patients 1 to 7.
Original magnification × 250. Biopsy 3 (b3) of patient 2 was available
only for RNA extraction and not for staining. Biopsy 3 of patient 7 was
not represented in the stainings or microarray analysis because of poor
RNA quality. Biopsies 1 and 4 of patient 1, and biopsy 1 of patient 4,
consisted mostly of adipose cells with some element of inflammatory
cells. Biopsy 1 of patient 7 had a higher level of heterogeneity, and con-
tained more vessels, than the others.
Arthritis Research & Therapy Vol 8 No 2 Lindberg et al.
Page 8 of 13
(page number not for citation purposes)
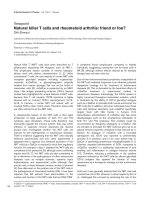
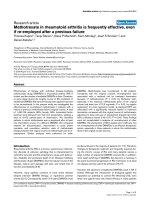
Figure 4
Hybridizations of orthopedic samples (patients 1 to 7)Hybridizations of orthopedic samples (patients 1 to 7). (a) Results of hierarchical clustering (HCL) performed on the raw data after normalization. On
average, 26,111 features were used per array. Cophenetic (coph) correlation coefficient = 0.9. (b) HCL analysis of the 2,285 genes that were found
to vary between biopsies and were present in one or more comparisons; coph = 0.92. Color codes: red, upregulated genes; green, downregulated
genes; yellow, genes showing no change; white, missing values. For patients 1 to 3, the coding of samples in (a) and (b) is as follows: Pt2 1.BA
refers to patient 2, biopsy 1, sub-biopsy B, technical replicate A. For patients 4 to 7, the coding of samples in (a) is as follows: Pt6 2.A refers to
patient 6, biopsy 2, technical replicate A. (c) Volcano plot of the comparison between the adipose-enriched samples versus all other biopsies. Biop-
sies 1 and 3 of patient 1, and biopsy 1 of patient 4, were tested for differentially expressed genes against all other orthopedic biopsies. Genes with
a B-score of more than 20 are shown in blue. Genes with highly significant differences in expression levels that were upregulated in the samples
with an overrepresentation of adipose cells in comparison with other biopsies can be seen in the upper left corner.
Available online />Page 9 of 13
(page number not for citation purposes)
patient. The three biopsies with an overrepresentation of adi-
pose cells were further investigated by determining the DE
genes between these biopsies and all other biopsies. The
results can be seen in Figure 4c. Genes with a B-score of
more than 20 were chosen for further investigation as
described in Materials and methods. False discovery rate [45]
correction for multiple testing was applied on a moderated T-
test, yielding a proportion of 1.03 × 10
-11
false positives
among the 418 chosen genes with a B-score of more than 20,
341 of which were upregulated in the biopsies with an over-
representation of adipose cells relative to the rest. These
genes were used to elucidate possible biological themes with
the use of the GO tool EASE [36]. The results of the EASE
analysis (Table 2) show that the overrepresentation of adi-
pocytes detected in the staining analysis is confirmed by the
gene expression data.
Heterogeneity between arthroscopic biopsies
In the second series of hybridizations (Figure 1b), compari-
sons were made between all of the arthroscopic biopsies from
the respective patients. The barplot in Figure 5a shows the
results of these comparisons. The largest difference (638 DE
Figure 5
Hybridizations of arthroscopic samples (patients 8 to 13)Hybridizations of arthroscopic samples (patients 8 to 13). (a) Barplot of the differentially expressed genes identified in the patient-by-patient compar-
isons between biopsies. In total, 1,536 unique genes were found to vary between the biopsies. (b) Hierarchical clustering (HCL) of the arthroscopic
biopsies using all genes. Pt9_cc_2A, for example, refers to patient 9, distance to cartilage (ncc, not close to cartilage, cc, close to cartilage), biopsy
2, technical replicate A. Color codes: red, upregulated genes; green, downregulated genes; yellow, genes showing no change; white, missing val-
ues. (c) HCL analysis based on the subset of differentially expressed genes from (a) that was present in one or more comparison (421 genes).
Arthritis Research & Therapy Vol 8 No 2 Lindberg et al.
Page 10 of 13
(page number not for citation purposes)
genes) was observed in patient 12 and the smallest between
two biopsies from patient 9 (21 DE genes). The arthroscopic
biopsies were clustered by using all of the features on the chip
and also a subset of genes that were defined as DE in Figure
5a (1,536 genes) and were present in one or more compari-
sons (421 genes). The results of the cluster analysis can be
seen in Figure 5b,c. In contrast to the orthopedic samples, the
biopsies from the different patients clustered individually with
both approaches.
Differences between biopsies and patients
The average number of DE genes was 143 between the
arthroscopic biopsies (Figure 5a) and 455 between the ortho-
pedic biopsies (Figure 2a), indicating that there was less het-
erogeneity among the arthroscopic biopsies than among the
orthopedic samples. The distribution of differences between
orthopedic and arthroscopic biopsies is illustrated in boxplots
A and B of Figure 6, respectively. As can also be seen in box-
plot C of Figure 6, when the biopsies containing an overrepre-
sentation of adipose cells are removed from the orthopedic
biopsies the distribution of DE genes becomes very similar to
that of the arthroscopic biopsies, reducing the average
number of DE genes between biopsies from 455 to 171. Inter-
estingly, the heterogeneity between sub-biopsies (boxplot D
of Figure 6; 173 DE genes on average) is similar to that of the
reduced set of orthopedic biopsies. This indicates that the
gene expression heterogeneity between adjacent biopsies is
similar to that of biopsies farther apart if the biopsies consist
of the same type of tissue. In addition, we compared sub-
biopsy/biopsy variation with patient variation. As with the com-
parisons between sub-biopsies/biopsies, a gene was
regarded as being DE if it had a B-score of more than 0 and
an |M-value| of more than 1. The results are displayed in Figure
6, boxplots E to G. The same patterns that were observed
between biopsies were also seen between patients, because
the orthopedic patients were more heterogeneous than the
arthroscopic patients. However, the differences were reduced
when the biopsies that were not suitable for gene expression
analysis of synovial inflammation were removed. EASE [36]
was used to investigate the possible overrepresentation of
biological processes by sorting the genes found to vary
between biopsies into subsets based on GO categories. The
numbers of 'hits' and the EASE scores for the 10 most over-
represented GO categories are shown in Table 3 for both the
orthopedic (4,175 unique genes) and the arthroscopic (1,536
unique genes) biopsies. No major differences in the relative
representation of biological processes between the two types
of samples were found in this analysis.
Discussion
The purpose of this study was to investigate variations in gene
expression in synovial tissues, within and between patients
with RA, using MA technology. The study also allowed the
sampling techniques used (orthopedic open surgery and rheu-
matic arthroscopy) to be compared. The results show large dif-
ferences in the numbers of DE genes between biopsies,
supporting previous studies on tissue heterogeneity in syno-
vial joints affected by inflammatory disease [25,30]. The
results also demonstrate that the differences between patients
are larger than between biopsies obtained from the same joint
(Figure 6). For the arthroscopic biopsies the unique gene
expression signature of each patient dominated the dendro-
grams obtained using both all genes and the subset of DE
genes. This was not observed for the orthopedic biopsies.
Most of the orthopedic biopsies clustered according to the
patient, but some failed. Instead, they clustered according to
their cellular composition; that is, mainly in relation to their con-
tent of adipose cells as detected by parallel histology. This has
potential implications for how MA analysis can be used to clas-
sify and follow the course of patients with arthritis, and in par-
ticular for choosing the optimal sampling technique.
Rheumatological arthroscopy has the advantage that the
investigator can choose a section of the synovium that is
inflamed (vascular and proliferative changes) and avoid much
fat or fibrous tissue. In contrast, orthopedic biopsies are most
often taken during operation in an extremity where blood sup-
ply has been temporarily turned off and where it is difficult to
separate inflamed from fibrous or fatty tissue at macroscopic
sampling of biopsies. The increased precision in biopsy sam-
Figure 6
Boxplots of the differentially expressed (DE) genes in the different com-parisonsBoxplots of the differentially expressed (DE) genes in the different com-
parisons. Boxplot A shows the number of DE genes between the
arthroscopic biopsies shown in Figure 5a. Boxplot B shows the number
of DE genes between the orthopedic biopsies shown in Figure 2a. Box-
plot C shows the number of DE genes between orthopedic biopsies
excluding the comparisons involving biopsies 1 and 3 of patient 1,
biopsy 1 of patient 4, and biopsy 1 of patient 7. Boxplot D shows the
number of DE genes between the sub-biopsies as shown in Figure 2b.
Boxplot E shows the number of DE genes between the arthroscopic
patients. Boxplot F shows the number of DE genes between the ortho-
pedic patients. Boxplot G shows the number of DE genes between the
orthopedic patients excluding biopsies 1 and 3 of patient 1, biopsy 1 of
patient 4, and biopsy 1 of patient 7 from the comparisons.
Available online />Page 11 of 13
(page number not for citation purposes)
pling from inflamed areas during arthroscopic compared with
sampling during open joint surgery might therefore explain the
patient-restricted clustering for arthroscopic but not for ortho-
pedic biopsies. This observation also has implications for the
choice between the use of arthroscopic or blind-needle biop-
sies, in which sampling of biopsies under direct vision during
arthroscopy is more likely to focus on areas of inflammation
than sampling with the blind-needle biopsy technique. In addi-
tion, the orthopedic samples were taken from patients under-
going end-stage arthroplastic surgery, whereas the samples
taken during arthroscopy were from patients with a much
shorter disease duration (2.3 years). When samples contain-
ing substantial fat tissue rather than inflammatory cells were
removed from the analysis, biopsies clustered almost perfectly
both at the level of biopsy site and individually.
It therefore seems that biopsies from actively inflamed synovial
tissues of patients with RA show expression of unique pat-
terns of mRNA, provided that the biopsy has been taken in
such a way that the analysis is performed on cells from an
inflamed site. Thus, both inter-individual and intra-individual
variation must be taken into consideration when analysing
gene expression in synovial tissue. One way is to take multiple
biopsies, as suggested earlier [8]; however, this would reduce
gene expression changes due to local differences in gene
expression at each biopsy site. Instead we suggest taking one
biopsy from a site of maximal macroscopic inflammation. If
reproduced in still larger series of biopsy studies using the cur-
rent as well as additional array methodologies, it is therefore
feasible that the MA technology performed on single biopsies
might provide information that allows us to investigate the
value of this information in predicting disease course as well
as response to therapy, and to follow the results of therapies
over the longitudinal course of a chronic inflammatory disease
such as RA.
Conclusion
The results in this paper demonstrate that levels of homogene-
ity vary between synovial biopsies obtained from the same
knee. Nevertheless, the gene expression signature of each
biopsy was patient-specific except for four orthopedic biop-
sies. These were identified by gene expression analysis and
confirmed by histochemistry as not being suitable for the anal-
ysis of synovial inflammation because of tissue heterogeneity.
The results also demonstrate differences between two differ-
ent sampling methods: open surgery and arthroscopy. The
number of DE genes between the orthopedic biopsies was on
average almost threefold higher than in the arthroscopic biop-
sies.
Competing interests
The authors declare that they have no competing interests.
Authors' contributions
J Lindberg performed parts of the MA-related laboratory work,
contributed to the data analysis, and wrote parts of the article.
Table 3
EASE results for differentially expressed genes identified in hybridization series 1 and 2
GO ID GO term Orthopedic biopsies Arthroscopic biopsies
Rank Number of hits EASE score Rank Number of hits EASE score
GO:0007154 Cell communication 1 685 4.63 × 10
-14
5 273 4.72 × 10
-6
GO:0007155 Cell adhesion 2 166 3.29 × 10
-10
7 72 8.51 × 10
-6
GO:0009607 Response to biotic stimulus 4 199 5.89 × 10
-9
3 90 1.30 × 10
-6
GO:0006952 Defense response 5 181 1.60 × 10
-8
2 84 7.69 × 10
-7
GO:0009605 Response to external stimulus 6 273 3.00 × 10
-8
1 126 1.56 × 10
-7
GO:0006955 Immune response 7 166 1.12 × 10
-7
4 78 1.63 × 10
-6
GO:0007166 Cell surface receptor linked signal transduction 9 209 1.24 × 10
-6
9 95 1.77 × 10
-5
GO:0007160 Cell-matrix adhesion 10 31 2.98 × 10
-5
121 9 2.32 × 10
-1
GO:0009613 Response to pest/pathogen/parasite 11 107 3.66 × 10
-5
6 55 6.78 × 10
-6
GO:0009611 Response to wounding 21 61 1.43 × 10
-3
8 36 1.44 × 10
-5
GO:0006954 Inflammatory response 53 40 1.89 × 10
-2
10 27 3.77 × 10
-5
GO:0007165 Signal transduction 3 533 4.69 × 10
-10
20 204 1.77 × 10
-3
GO:0009987 Cellular process 8 1,303 1.95 × 10
-7
15 519 4.28 × 10
-4
The table lists the top 10 gene ontology (GO) categories for the 4,175 genes that were differentially expressed between orthopedic biopsies and
for the 1,536 differentially expressed genes that were found to vary between arthroscopic biopsies. Seven of the top 10 GO categories were
common between the two biopsy types. In the columns headed 'Rank', category 1 is the most significant category and the category with the
highest number is the least significant. EASE, Expression Analysis Systematic Explorer.
Arthritis Research & Therapy Vol 8 No 2 Lindberg et al.
Page 12 of 13
(page number not for citation purposes)
EaK performed the arthroscopic surgery, wrote parts of the
article, and contributed to the data analysis. A-KU contributed
to the planning and design of the project, collected the ortho-
pedic biopsies outside surgery, performed the hematoxylin/
eosin staining analysis, and participated in both the data anal-
ysis and writing of the article. AS performed the joint replace-
ment surgery and thereby provided the orthopedic biopsies.
TA contributed to the planning and design of the project and
performed parts of the MA-related laboratory work. PN was
responsible for chip design and contributed to data analysis.
LK was involved in planning the project, data analysis, and
writing the article. J Lundeberg was involved in designing the
project, the analysis of laboratory results, data analysis, and
writing of the article. All authors read and approved the final
manuscript.
Acknowledgements
Marianne Engström, Anna Westring, and Fredrik Lyngman are thanked
for their technical assistance, and Anneli Walden is thanked for chip pro-
duction. The work was supported by grants from the Knut och Alice
Wallenbergs Foundation and the Knowledge Foundation.
References
1. Arnett FC: Revised criteria for the classification of rheumatoid
arthritis. Bull Rheum Dis 1989, 38:1-6.
2. Dolhain RJ, Ter Haar NT, De Kuiper R, Nieuwenhuis IG, Zwinder-
man AH, Breedveld FC, Miltenburg AM: Distribution of T cells
and signs of T-cell activation in the rheumatoid joint: implica-
tions for semiquantitative comparative histology. Br J Rheu-
matol 1998, 37:324-330.
3. Lindblad S, Hedfors E: Intraarticular variation in synovitis. Local
macroscopic and microscopic signs of inflammatory activity
are significantly correlated. Arthritis Rheum 1985, 28:977-986.
4. Hutton CW, Hinton C, Dieppe PA: Intra-articular variation of
synovial changes in knee arthritis: biopsy study comparing
changes in patellofemoral synovium and the medial tibiofem-
oral synovium. Br J Rheumatol 1987, 26:5-8.
5. Kennedy TD, Plater-Zyberk C, Partridge TA, Woodrow DF, Maini
RN: Representative sample of rheumatoid synovium: a mor-
phometric study. J Clin Pathol 1988, 41:841-846.
6. Kirkham B, Portek I, Lee CS, Stavros B, Lenarczyk A, Lassere M,
Edmonds J: Intraarticular variability of synovial membrane his-
tology, immunohistology, and cytokine mRNA expression in
patients with rheumatoid arthritis. J Rheumatol 1999,
26:777-784.
7. Ulfgren AK, Grondal L, Lindblad S, Khademi M, Johnell O,
Klareskog L, Andersson U: Interindividual and intra-articular var-
iation of proinflammatory cytokines in patients with rheuma-
toid arthritis: potential implications for treatment. Ann Rheum
Dis 2000, 59:439-447.
8. Boyle DL, Rosengren S, Bugbee W, Kavanaugh A, Firestein GS:
Quantitative biomarker analysis of synovial gene expression
by real-time PCR. Arthritis Res Ther 2003, 5:R352-R360.
9. Chung CH, Parker JS, Karaca G, Wu J, Funkhouser WK, Moore D,
Butterfoss D, Xiang D, Zanation A, Yin X, et al.: Molecular classi-
fication of head and neck squamous cell carcinomas using
patterns of gene expression. Cancer Cell 2004, 5:489-500.
10. Golub TR, Slonim DK, Tamayo P, Huard C, Gaasenbeek M,
Mesirov JP, Coller H, Loh ML, Downing JR, Caligiuri MA, et al.:
Molecular classification of cancer: class discovery and class
prediction by gene expression monitoring. Science 1999,
286:531-537.
11. Alizadeh AA, Eisen MB, Davis RE, Ma C, Lossos IS, Rosenwald A,
Boldrick JC, Sabet H, Tran T, Yu X, et al.: Distinct types of diffuse
large B-cell lymphoma identified by gene expression profiling.
Nature 2000, 403:503-511.
12. Perou CM, Sorlie T, Eisen MB, van de Rijn M, Jeffrey SS, Rees CA,
Pollack JR, Ross DT, Johnsen H, Akslen LA, et al.: Molecular por-
traits of human breast tumours. Nature 2000, 406:747-752.
13. Valk PJ, Verhaak RG, Beijen MA, Erpelinck CA, Barjesteh van
Waalwijk van Doorn-Khosrovani S, Boer JM, Beverloo HB, Moor-
house MJ, van der Spek PJ, Lowenberg B, et al.: Prognostically
useful gene-expression profiles in acute myeloid leukemia. N
Engl J Med 2004, 350:1617-1628.
14. van't Veer LJ, Dai H, van de Vijver MJ, He YD, Hart AA, Mao M,
Peterse HL, van der Kooy K, Marton MJ, Witteveen AT, et al.: Gene
expression profiling predicts clinical outcome of breast can-
cer. Nature 2002, 415:530-536.
15. Jarvis JN: Diagnostic and prognostic potential of gene microar-
rays in rheumatoid arthritis. Expert Rev Mol Diagn 2005,
5:655-659.
16. Jarvis JN, Dozmorov I, Jiang K, Frank MB, Szodoray P, Alex P, Cen-
tola M: Novel approaches to gene expression analysis of active
polyarticular juvenile rheumatoid arthritis. Arthritis Res Ther
2004, 6:R15-R32.
17. Batliwalla FM, Baechler EC, Xiao X, Li W, Balasubramanian S,
Khalili H, Damle A, Ortmann WA, Perrone A, Kantor AB, et al.:
Peripheral blood gene expression profiling in rheumatoid
arthritis. Genes Immun 2005, 6:388-397.
18. Maas K, Chan S, Parker J, Slater A, Moore J, Olsen N, Aune TM:
Cutting edge: molecular portrait of human autoimmune dis-
ease. J Immunol 2002, 169:5-9.
19. Olsen N, Sokka T, Seehorn CL, Kraft B, Maas K, Moore J, Aune
TM: A gene expression signature for recent onset rheumatoid
arthritis in peripheral blood mononuclear cells. Ann Rheum
Dis 2004, 63:1387-1392.
20. Jeong JG, Kim JM, Cho H, Hahn W, Yu SS, Kim S: Effects of IL-
1beta on gene expression in human rheumatoid synovial
fibroblasts. Biochem Biophys Res Commun 2004, 324:3-7.
21. Zhang HG, Hyde K, Page GP, Brand JP, Zhou J, Yu S, Allison DB,
Hsu HC, Mountz JD: Novel tumor necrosis factor alpha-regu-
lated genes in rheumatoid arthritis. Arthritis Rheum 2004,
50:420-431.
22. Gallagher J, Howlin J, McCarthy C, Murphy EP, Bresnihan B, Fit-
zGerald O, Godson C, Brady HR, Martin F: Identification of Naf1/
ABIN-1 among TNF-alpha-induced expressed genes in human
synoviocytes using oligonucleotide microarrays. FEBS Lett
2003, 551:8-12.
23. Tsubaki T, Arita N, Kawakami T, Shiratsuchi T, Yamamoto H,
Takubo N, Yamada K, Nakata S, Yamamoto S, Nose M: Charac-
terization of histopathology and gene-expression profiles of
synovitis in early rheumatoid arthritis using targeted biopsy
specimens. Arthritis Res Ther 2005, 7:R825-R836.
24. Schmutz C, Hulme A, Burman A, Salmon M, Ashton B, Buckley C,
Middleton J: Chemokine receptors in the rheumatoid syn-
ovium: upregulation of CXCR5. Arthritis Res Ther 2005,
7:R217-R229.
25. van der Pouw Kraan TC, van Gaalen FA, Huizinga TW, Pieterman
E, Breedveld FC, Verweij CL: Discovery of distinctive gene
expression profiles in rheumatoid synovium using cDNA
microarray technology: evidence for the existence of multiple
pathways of tissue destruction and repair. Genes Immun
2003, 4:187-196.
26. Devauchelle V, Marion S, Cagnard N, Mistou S, Falgarone G,
Breban M, Letourneur F, Pitaval A, Alibert O, Lucchesi C, et al.:
DNA microarray allows molecular profiling of rheumatoid
arthritis and identification of pathophysiological targets.
Genes Immun 2004, 5:597-608.
27. Kasperkovitz PV, Timmer TC, Smeets TJ, Verbeet NL, Tak PP, van
Baarsen LG, Baltus B, Huizinga TW, Pieterman E, Fero M, et al.:
Fibroblast-like synoviocytes derived from patients with rheu-
matoid arthritis show the imprint of synovial tissue heteroge-
neity: evidence of a link between an increased myofibroblast-
like phenotype and high-inflammation synovitis. Arthritis
Rheum 2005, 52:430-441.
28. Lorenz P, Ruschpler P, Koczan D, Stiehl P, Thiesen HJ: From tran-
scriptome to proteome: differentially expressed proteins iden-
tified in synovial tissue of patients suffering from rheumatoid
arthritis and osteoarthritis by an initial screen with a panel of
791 antibodies. Proteomics 2003, 3:991-1002.
29. Huh SJ, Paik DJ, Chung HS, Youn J: Regulation of GRB2 and
FLICE2 expression by TNF-alpha in rheumatoid synovium.
Immunol Lett 2003, 90:93-96.
30. van der Pouw Kraan TC, van Gaalen FA, Kasperkovitz PV, Verbeet
NL, Smeets TJ, Kraan MC, Fero M, Tak PP, Huizinga TW, Pieter-
man E, et al.: Rheumatoid arthritis is a heterogeneous disease:
Available online />Page 13 of 13
(page number not for citation purposes)
evidence for differences in the activation of the STAT-1 path-
way between rheumatoid tissues. Arthritis Rheum 2003,
48:2132-2145.
31. Baeten D, Van den Bosch F, Elewaut D, Stuer A, Veys EM, De Key-
ser F: Needle arthroscopy of the knee with synovial biopsy
sampling: technical experience in 150 patients. Clin Rheuma-
tol 1999, 18:434-441.
32. KTH microarray core facility homepage [ar
ray.se/]
33. Imbeaud S, Graudens E, Boulanger V, Barlet X, Zaborski P, Eveno
E, Mueller O, Schroeder A, Auffray C: Towards standardization
of RNA quality assessment using user-independent classifiers
of microcapillary electrophoresis traces. Nucleic Acids Res
2005, 33:e56.
34. Parkinson H, Sarkans U, Shojatalab M, Abeygunawardena N, Con-
trino S, Coulson R, Farne A, Lara GG, Holloway E, Kapushesky M,
et al.: ArrayExpress – a public repository for microarray gene
expression data at the EBI. Nucleic Acids Res
2005:D553-D555.
35. Team RDC: A Language and Environment for Statistical Comput-
ing Vienna: R Foundation for Statistical Computing; 2004.
36. Hosack DA, Dennis G Jr, Sherman BT, Lane HC, Lempicki RA:
Identifying biological themes within lists of genes with EASE.
Genome Biol 2003, 4:R70.
37. Saeed A, Sharov V, White J, Li J, Liang W, Bhagabati N, Braisted
J, Klapa M, Currier T, Thiagarajan M, et al.: TM4: a free, open-
source system for microarray data management and analysis.
Biotechniques 2003, 34:374-378.
38. Ashburner M, Ball CA, Blake JA, Botstein D, Butler H, Cherry JM,
Davis AP, Dolinski K, Dwight SS, Eppig JT, et al.: Gene ontology:
tool for the unification of biology. The Gene Ontology Consor-
tium. Nat Genet 2000, 25:25-29.
39. Fleiss JL: Statistical Methods for Rates and Proportions New York:
John Wiley; 1981.
40. Smyth GK: Linear models and empirical Bayes methods for
assessing differential expression in microarray experiments.
Stat Appl Genet Mol Biol 2004, 3:Article 3.
41. Bengtsson H: aroma – An R Object-oriented Microarray Analysis
Environment. [Preprints in Mathematical Sciences, no. 18.] Lund:
Centre for Mathematical Sciences, Lund Institute of Technology;
2004.
42. Gentleman RC, Carey VJ, Bates DM, Bolstad B, Dettling M, Dudoit
S, Ellis B, Gautier L, Ge Y, Gentry J, et al.: Bioconductor: open
software development for computational biology and bioinfor-
matics. Genome Biol 2004, 5:R80.
43. Smyth GK, Speed TP: Normalization of cDNA microarray data.
Methods 2003, 31:265-273.
44. Lonnstedt I, Speed TP: Replicated microarray data. Stat Sin
2002, 12:31-46.
45. Reiner A, Yekutieli D, Benjamini Y: Identifying differentially
expressed genes using false discovery rate controlling proce-
dures. Bioinformatics 2003, 19:368-375.
46. Smyth GK, Michaud J, Scott H: The use of within-array replicate
spots for assessing differential expression in microarray
experiments. Bioinformatics 2005, 21:2067-2075.
47. Eisen MB, Spellman PT, Brown PO, Botstein D: Cluster analysis
and display of genome-wide expression patterns. Proc Natl
Acad Sci USA 1998, 95:14863-14868.
48. Sneath PHA, Sokal RR: Numerical Taxonomy; The Principles and
Practice of Numerical Classification San Francisco: WH Freeman;
1973.