Báo cáo y học: "Osteogenic protein 1 in synovial fluid from patients with rheumatoid arthritis or osteoarthritis: relationship with disease and levels of hyaluronan and antigenic keratan sulfate" ppt
Bạn đang xem bản rút gọn của tài liệu. Xem và tải ngay bản đầy đủ của tài liệu tại đây (650.76 KB, 10 trang )
Open Access
Available online />Page 1 of 10
(page number not for citation purposes)
Vol 8 No 3
Research article
Osteogenic protein 1 in synovial fluid from patients with
rheumatoid arthritis or osteoarthritis: relationship with disease
and levels of hyaluronan and antigenic keratan sulfate
Susan Chubinskaya
1,2
, Benjamin S Frank
2
, Margaret Michalska
2
, Bhavna Kumar
1
,
Charis A Merrihew
1
, Eugene J-MA Thonar
1,2
, Mary Ellen Lenz
1
, Lori Otten
1
, David C Rueger
3
and
Joel A Block
1,2
1
Department of Biochemistry, Rush University Medical Center, Chicago, Illinois, USA
2
Section of Rheumatology, Rush University Medical Center, Chicago, Illinois, USA
3
Stryker Biotech, Hopkinton, Massachusetts, USA
Corresponding author: Susan Chubinskaya,
Received: 22 Nov 2005 Revisions requested: 19 Dec 2005 Revisions received: 9 Mar 2006 Accepted: 24 Mar 2006 Published: 28 Apr 2006
Arthritis Research & Therapy 2006, 8:R73 (doi:10.1186/ar1947)
This article is online at: />© 2006 Chubinskaya et al.; licensee BioMed Central Ltd.
This is an open access article distributed under the terms of the Creative Commons Attribution License ( />),
which permits unrestricted use, distribution, and reproduction in any medium, provided the original work is properly cited.
Abstract
The measurement of body fluid levels of biochemical markers in
joint tissues has begun to provide clinically useful information.
Synovial fluid (SF) plays an important role in articular joint
lubrication, nutrition, and metabolism of cartilage and other
connective tissues within the joint. The purpose of our study was
to identify and characterize osteogenic protein 1 (OP-1) in SF
from patients with rheumatoid arthritis (RA) or with osteoarthritis
(OA) and to correlate levels of OP-1 with those of hyaluronan
(HA) and antigenic keratan sulfate (AgKS). SF was aspirated
from the knees of patients with either RA or OA and from the
knees of asymptomatic organ donors with no documented
history of joint disease. The presence of detectable OP-1 in SF
was demonstrated by western blots with specific anti-pro-OP-1
and anti-mature OP-1 antibodies. Measurement of levels of OP-
1, HA and AgKS was performed using ELISAs. OP-1 was
identified in human SF in two forms, pro-OP-1 and active
(mature) OP-1 – mature OP-1 being detected only in SF from
OA patients and RA patients. Levels of OP-1 and HA were
higher in RA patients than in OA patients and asymptomatic
donors, while the level of AgKS was highest in SF from
asymptomatic donors. Statistically significant differences were
found between SF levels of OP-1 in RA and OA patients and
between SF levels of AgKS among the three groups tested. The
SF content of OP-1 tended to correlate positively with HA levels,
but negatively with AgKS concentrations. In conclusion, the
results of this study suggest that measurement of OP-1 in joint
fluid may have value in the clinical evaluation of joint disease
processes.
Introduction
The measurement of body fluid levels of biochemical markers
of structural or metabolic changes in joint tissues has begun
to provide clinically useful information. Synovial fluid (SF) plays
an important role in articular joint lubrication, nutrition and
metabolism of cartilage and other connective tissues within
the joint. Cartilage-derived molecules present in SF may be
markers predominantly of biosynthetic changes or of degrada-
tive changes. Such markers of cartilage metabolism have been
divided into two classes, direct markers and indirect markers
[1].
Direct markers originate from cartilage structures and provide
a measure of the responses of chondrocytes or changes that
occur in cartilage. Among these is antigenic keratan sulfate
(AgKS), a molecule found almost exclusively in aggrecan mol-
ecules within cartilaginous tissues [2,3]. AgKS is released
when aggrecan is cleaved by proteolytic enzymes, whereupon
the AgKS-bearing fragments may be measured in various body
fluids. The indirect markers of cartilage metabolism, on the
other hand, are found in many tissues and are produced by a
variety of cell types [1]. These indirect markers include, but are
AgKS = antigenic keratan sulfate; BMP = bone morphogenetic protein; ELISA = enzyme-linked immunosorbent assay; HA = hyaluronan; IL = inter-
leukin; mAb = monoclonal antibody; OA = osteoarthritis; OP-1 = osteogenic protein 1; RA = rheumatoid arthritis; SF = synovial fluid; TBS = Tris-
buffered saline.
Arthritis Research & Therapy Vol 8 No 3 Chubinskaya et al.
Page 2 of 10
(page number not for citation purposes)
Table 1
Demographical representation of human subjects enrolled in the study
Group Sample number Age (years) Sex Race Collins grade
Donors 1 66 Female Caucasian 4
2 69 Male Caucasian 2
3 54 Male Caucasian 2
4 74 Male Caucasian 3
579MaleAfrican-American2
6 67 Male Caucasian 4
7 67 Male Caucasian 4
8 52 Male Caucasian 2
9 67 Female Caucasian 3
10 40 Female African-American 1
11 54 Male Caucasian 0
12 92 Female Caucasian 2
13 73 Male Caucasian 2
14 53 Male African-American 0
Osteoarthritis patients 1 84 Male
285Male
381Male
481Male
582Male
684Male
753Female
858Male
960Female
10 54 Female
11 60 Female
12 75 Female
13 81 Female
14 41 Male
15 75 Female
16 67 Female
17 64 Female
18 87 Female
19 71 Male
20 70 Female
21 53 Female
22 71 Male
23 82 Male
24 79 Female
Available online />Page 3 of 10
(page number not for citation purposes)
not limited to, proteolytic enzymes, proteinase inhibitors,
proinflammatory cytokines and matrix molecules, such as
hyaluronan (HA), C-reactive protein, and so forth.
While they may not provide a reliable measure of intra-articular
events, a number of studies have reported an association
between the levels of certain markers in SF and joint changes
in arthritic diseases [2-7], and have helped to identify markers
that may have prognostic and/or diagnostic value in rheuma-
toid arthritis (RA) and osteoarthritis (OA).
Osteogenic protein 1 (OP-1), a member of the bone morpho-
genetic protein (BMP) family, is expressed by human adult
articular chondrocytes and plays a crucial role in the mainte-
nance of cartilage matrix integrity and the promotion of repair
processes [8,9]. OP-1 has a potent anabolic effect on articular
cartilage and other connective tissues: it stimulates the syn-
thesis of major cartilage matrix components [10-12], it pro-
motes matrix assembly [13], and it serves as an antagonist to
the deleterious effects of catabolic mediators [14-16] without
inducing chondrocyte hypertrophy and proliferation [10,11].
25 37 Female
26 51 Male
27 81 Male
28 83 Female
29 40 Female
Rheumatoid arthritis
patients
147Female
242Female
373Female
456Female
526Female
641Male
762Male
853Female
966Female
10 66 Female
11 26 Female
12 26 Female
13 73 Female
14 42 Female
15 34 Female
16 49 Female
17 70 Male
18 53 Male
19 52 Male
20 40 Female
21 68 Female
22 49 Male
23 76 Male
24 22 Female
25 72 Female
Collins grade was assigned only to the cadaveric joints. Racial background of the osteoarthritis patients and of the rheumatoid arthritis patients
was not available to us.
Table 1 (Continued)
Demographical representation of human subjects enrolled in the study
Arthritis Research & Therapy Vol 8 No 3 Chubinskaya et al.
Page 4 of 10
(page number not for citation purposes)
OP-1 gene expression and protein expression have been
detected in all of the connective tissues of the joint – cartilage,
meniscus, synovium, ligament, and tendon [17] – and there
appears to be a negative correlation between autocrine OP-1
production and degenerative articular processes [18,19].
The objectives of the current study were: to characterize the
OP-1 present in human SF; to compare levels of endogenous
OP-1 protein in SF obtained from organ donors, from OA
patients, and from RA patients using a validated ELISA [19];
and to correlate these levels with those of other validated bio-
chemical markers of joint tissue metabolism, specifically AgKS
[20] and HA [21]. In the present article, we provide the first
report of the presence of OP-1 in the SF of asymptomatic
organ donors, of OA patients, and of RA patients, and report
statistical differences between the SF concentrations of this
growth factor in OA patients and RA patients.
Patients and methods
Subjects
Synovial fluid was aspirated within 24 hours of death from the
knee joints of 14 asymptomatic human organ donors with no
documented history of joint diseases. This study, performed
with assistance from the Gift of Hope Organ & Tissue Donor
Network (Elmhurst, IL, USA), received institutional approval
(ORA #00091901 approved on 3rd October 2000). Synovial
fluid was also obtained with appropriate consent from 29 OA
patients and 25 RA patients of the Rush Section of Rheuma-
tology who were undergoing diagnostic or therapeutic arthro-
centesis as part of their evaluation and therapy. The patient
cohort covered a broad spectrum of age and disease severity
(both RA and OA). Disease categories represent primary diag-
noses as determined by the attending physician and were
based on clinical and radiologic criteria (Table 1). OA was
defined according to the classification criteria disseminated by
the American College of Rheumatology [22]. Samples were
centrifuged to remove cells and debris, divided into aliquots
and were immediately frozen at -80°C.
OP-1 antibodies
Four different antibodies were used for this study: two polyclo-
nal antisera, R2854 (Stryker Biotech, Hopkinton, MA, USA)
and sc-9305 (Santa Cruz Biotechnology Inc., Santa Cruz, CA,
USA); and two mAbs, 1B12 (Stryker Biotech) and MAB 354
(R&D Systems, Minneapolis, MN, USA). All antibodies have
been previously described and characterized [8,18,19,23].
The polyclonal antibody R2854 was raised in rabbits against
the monomeric pro-domain of the OP-1 molecule and recog-
nizes the OP-1 pro-domain. All other antibodies recognize the
mature domain of OP-1: two mAbs, 1B12 and MAB354, were
raised against the monomeric mature domain of OP-1 and a
third, polyclonal antiserum (sc-9305), was raised against a 15-
amino-acid synthetic peptide within the N-terminus of the
mature OP-1 domain.
OP-1 western blot analysis
Western blot analyses were performed with anti-pro-OP-1
(R2854) and anti-mature OP-1 (MAB354) antibodies. To opti-
mize the methodology, SF samples were tested at different
dilutions (1:5, 1:10, 1:100, and 1:1000) before and after enzy-
matic digestion with hyaluronidase (50 units/ml), with chon-
droitinase ABC (0.1 units/ml), or with a combination of both
enzymes at 37°C for 90 minutes. Digestion with chondroiti-
nase ABC was performed in the presence of a protease inhib-
itor cocktail. Samples were boiled for 5 minutes in a heat block
and then loaded onto SDS-PAGE gels (12%) under reduced
(with 2-mercaptoethanol) or nonreduced conditions, following
which western blots were performed. For each sample, 30 µg
protein was loaded.
In the experiment described in Figure 1a,b, where serial dilu-
tions of SF were tested, 30 µl each sample was loaded onto
gels. To decrease nonspecific binding, blots were incubated
with blocking solution containing 5% nonfat dry milk (Bio-Rad,
Hercules, CA, USA) in Tris-buffered saline (TBS) with 0.05%
Tween 20 (TBS/Tween) (Bio-Rad) for 1 hour at room temper-
ature. The blots were then incubated with primary antibody at
the manufacturers' suggested dilutions in 1:250 TBS/Tween
for R2854 and MAB354 anti-OP-1 antibodies. Secondary
antibodies were used, either ImmunoPure goat anti-mouse
IgG (Pierce, Rockford, IL, USA) or donkey anti-rabbit IgG
(Pierce) conjugated with horseradish peroxidase at 1:10,000
dilutions in TBS/Tween. The blots were developed with the
SuperSignal West Pico Chemiluminescent substrate (Pierce)
kit for western blotting. The specificity of binding was com-
pared with the binding of the antibodies to recombinant pro-
OP-1 or mature OP-1. Secondary antibodies were also tested
for nonspecific binding. The densities of specific immunoreac-
tive bands was scanned by the Fluor-S MultiImager (Bio-Rad)
and quantified by the Quantity One Software program (Bio-
Rad).
Measurement of OP-1 by ELISA
For the quantitative assessment of OP-1 protein levels, aliq-
uots of SF samples were first diluted 1:100 with TBS. OP-1
was subsequently detected with the OP-1 chemiluminescent
sandwich ELISA developed in our laboratory, which recog-
nizes all forms of the OP-1 protein that contain a mature
domain [19]. For the sandwich ELISA, two anti-OP-1 antibod-
ies, sc-9305 and 1B12, were used. Briefly, 96-well plates
(Nalge Nunc, Rochester, NY, USA) were coated with the pol-
yclonal anti-OP-1 antibody sc-9305 at 50 ng/well in TBS, pH
7.5, and were incubated overnight at 4°C. Nonspecific binding
was blocked by adding 5% nonfat dry milk in TBS/Tween, pH
7.5 (200 µl/well) for 2 hours at room temperature.
To generate a standard curve, mature recombinant OP-1
(Stryker Biotech) was diluted in TBS/Tween at concentrations
ranging from 10 ng/ml to 0.01 ng/ml. The diluted OP-1 stand-
ards and aliquots of SF (100 µl/well) were added to the plate
Available online />Page 5 of 10
(page number not for citation purposes)
and incubated for 1 hour at room temperature. The monoclonal
anti-OP-1 antibody (1B12) in TBS, pH 7.5, was applied at a
1:1000 dilution (100 µl/well) and was incubated at room tem-
perature for 1 hour. ImmunoPure goat anti-mouse IgG peroxi-
dase conjugated antibody (100 µl/well; Pierce) in TBS, pH
7.5, was used at a 1:10,000 dilution as the detection antibody.
The reaction was developed with Supersignal ELISA Femto
Maximum Sensitivity Substrate (Pierce).
The data, expressed as relative light units, were obtained using
the chemiluminescent ELISA plate reader Victor
2
(Wallac1420; Perkin Elmer, Turku, Finland). The OP-1 values
obtained were normalized either to total volume or to the DNA
content as determined by the pico green assay (Molecular
Probes, Eugene, OR, USA).
Measurement of AgKS by ELISA
AgKS in SF was quantified by a well-characterized ELISA
[3,20] that includes an inhibition step and makes use of an
anti-keratan sulfate mAb that is specific for a highly sulfated
carbohydrate epitope present only at the nonreducing end of
long keratan sulfate chains. The ELISA was performed at pH
5.3 to promote the steepness of the inhibition curves for both
standard samples and SF samples. Reported values are equiv-
alents of the International Standard of keratan sulfate purified
from human costal cartilage [20]. The intra-assay variation was
<3%, and the inter-assay variation was <4%.
Measurement of HA by ELISA
Hyaluronan in SF was quantified by a previously well-
described sandwich ELISA [21] that also made use of the
aforementioned anti-keratan sulfate mAb to differentiate
between the coated aggregating nonkeratan-sulfate-contain-
ing rat chondrosarcoma proteoglycans that capture HA and
the keratan-sulfate-bearing aggregating proteoglycans that
are subsequently added. The assay produces very similar val-
ues for HA levels in body fluids as five other immunoassays
[24]. The reported intra-assay variation was <4%, and the
inter-assay variation was <6%.
Statistical analysis
All data were entered into a computer database and analyzed
using Prism (version 3.0) from GraphPad Software (San
Diego, CA, USA). All measurements were carried out in tripli-
cate, with differences statistically evaluated (at the 95% confi-
dence level) by one-way analysis of variance and
nonparametric unpaired t test; P < 0.05 was accepted as sig-
nificant. Quantitative data are presented through the text as
the mean ± standard deviation. All graphs are displayed as the
mean ± standard error of the mean.
Results
Demographics of three populations of samples
The SF used for this study was obtained from the knee joints
of 14 asymptomatic organ donors with no documented history
of joint disease (10 males and four females, 11 Caucasians
and three African-Americans; mean age, 64.8 ± 13.2 years
(range 40–92 years); mean Collins grade, 2.2 ± 1.31 (range
0–4) [25]). Patients with diagnosed OA (n = 29) and RA (n =
25) enrolled in this study were of both sexes (13 males and 16
females for the OA group, and seven males and 18 females for
the RA group) and represented similar age categories – mean
age for the OA group, 68.6 ± 15.1 years (range 37–87 years);
mean age for the RA group, 51.4 ± 16.7 years (range 22–73
years) – and a similar ratio of racial origin.
Detection of OP-1 by western blotting
OP-1 was identified by western blots in all asymptomatic
donor SF samples (Figures 1a,b and 2; MAB 354). It is worth
noting that the MAB 354 and 1B12 anti-mature OP-1 antibod-
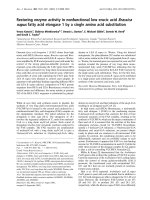
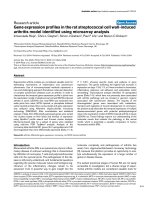
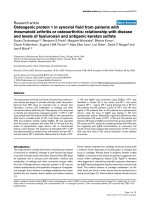
Figure 1
Western blots of synovial fluid samplesWestern blots of synovial fluid samples. Representative western blots
of a synovial fluid sample obtained (a), (b) from a grade 0 normal
asymptomatic organ donor or (c), (d) from a patient with rheumatoid
arthritis using an anti-mature osteogenic protein 1 (OP-1) antibody
(MAB354) demonstrating the pro-form and mature form of OP-1 pro-
tein. (a) and (c) Nonreduced conditions, (b) and (d) reduced with β-
mercaptoethanol. (a) and (b) Sample was loaded at different dilutions
of sample buffer in the amount of 30 µl/lane: lane 1, 1:1000; lane 2,
1:100; lane 3, 1:10; and lane 4, 1:5. (c) and (d) Undiluted sample was
digested with the following enzymes and then loaded onto each lane at
30 µg protein: lane 1, control, no treatment; lane 2, hyaluronidase (50
units/ml); lane 3, chondroitinase ABC (0.1 U/ml); lane 4, combination
of hyaluronidase (50 units/ml) and chondroitinase ABC (0.1 U/ml). The
numbers on gels represent the size of the protein bands of interest.
Arthritis Research & Therapy Vol 8 No 3 Chubinskaya et al.
Page 6 of 10
(page number not for citation purposes)
ies used in this study recognize all forms of OP-1 that contain
the mature OP-1 domain as part of its structure [8].
Under nonreduced conditions with anti-mature OP-1 antibody
(MAB 354), the majority (approximately 70–80%) of OP-1 in
the SF from asymptomatic donors was found as high-molecu-
lar-weight aggregates (about 250 kDa and above), although
some OP-1 (approximately 15–20%) was present in the pro-
form (molecular weight ~115 kDa) and very little (5–10%) was
present in the mature active form (molecular weight ~36 kDa)
(Figure 1a). Under reduced conditions (Figure 1b) the same
antibody recognized a clear band migrating with a molecular
weight of at least 55 kDa. This band represents the reduced
form of the pro-OP-1 molecule. The light band at about 18
kDa, indicative of the reduced form of active OP-1, was barely
detectable.
In order to identify the most appropriate conditions to analyze
OP-1 in SF, serial dilutions of SF were performed (1:1000,
1:100, 1:10, and 1:5, Figure 1a,b). A 1/100 dilution of the SF
samples yielded the clearest results. The small amount of the
18 kDa band (Figure 1b) suggests that OP-1 in asymptomatic
donor SF is present predominantly as the pro-form. Undiluted
(Figure 1c,d) OP-1 in RA samples remained mostly in the
intact pro-OP-1 dimer form (molecular weight bands at 115
kDa and 250 kDa), even in the presence of reducing agents. It
is not known whether OP-1 in SF is present as high-molecular-
weight aggregates or is bound to other matrix macromole-
cules. Predigesting the samples with enzymes (hyaluronidase,
chondroitinase ABC, or the combination of the two) did not
alter the patterns of migration or the intensity of the OP-1
bands (Figure 1c,d).
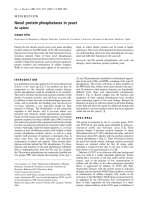
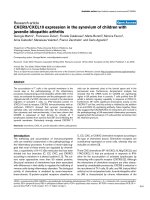
In diluted samples from OA patients and RA patients (Figure
2), OP-1 was present not only in the pro-form (R2854), as was
found in specimens from asymptomatic donors, but also in the
active cleaved form (MAB 354). Immunoreactive bands at 75,
115 and 250 kDa probably represent uncleaved pro-OP-1,
while bands at 36 kDa (unreduced conditions) and 18 kDa
(reduced conditions) probably represent processed mature
active OP-1 [8,25]. The distribution of OP-1 immunoreactive
bands in SF was similar to that identified in human articular
cartilage extracts [18,19].
Quantification of OP-1 in SF by a sandwich ELISA
To detect OP-1 in SF by a well-characterized ELISA [19], aliq-
uots of each SF sample were diluted 1:100. OP-1 was
Figure 2
Western blots of synovial fluid samples from rheumatoid arthritis and osteoarthritis patients and organ donorsWestern blots of synovial fluid samples from rheumatoid arthritis and osteoarthritis patients and organ donors. Representative western blots of syn-
ovial fluid samples from asymptomatic donors (D) and osteoarthritis (OA) and rheumatoid arthritis (RA) patients. (a) Nonreduced conditions with
anti-pro-osteogenic protein 1 (OP-1) antibody (R2854). (b) Nonreduced conditions with anti-mature OP-1 antibody (MAB354). (c) Reduced gel
with anti-mature OP-1 antibody (MAB354). Samples were diluted 1:100. The numbers on gels represent the size of the protein bands of interest.
The same amount of protein was loaded onto each lane.
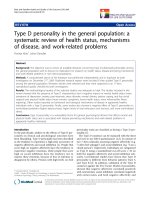
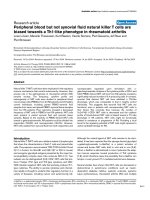
Figure 3
Content of osteogenic protein 1 protein in synovial fluid samplesContent of osteogenic protein 1 protein in synovial fluid samples. The
osteogenic protein 1 (OP-1) content of synovial fluid from asympto-
matic donors (donor) and from osteoarthritis (OA) and rheumatoid
arthritis (RA) patients detected by an OP-1 sandwich ELISA [19]. The
data are presented as the mean ± standard error of the mean.
Available online />Page 7 of 10
(page number not for citation purposes)
present at similar concentrations in SF from asymptomatic
donors and from OA patients (donors, 52.8 ± 7.7 ng/ml; OA,
60.55 ± 7.17 ng/ml). Levels of this growth factor, however,
were significantly higher in RA patients (116.9 ± 24.18 ng/ml;
donors versus RA patients, P < 0.015; OA patients versus RA
patients, P < 0.03; Figure 3). The asymptomatic donor group
consisted of 14 SF samples that were aspirated from joints
that, in certain cases, exhibited some degenerative changes
(Collins grade varied from 0 to 4; Table 1) [26,27]. Although
these donors were asymptomatic, some of them may repre-
sent patients with preclinical OA.
Quantification of HA in SF by ELISA and correlation with
OP-1 content
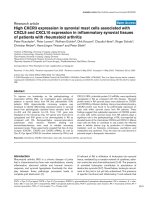
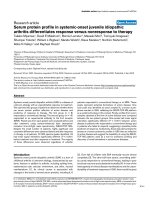
Consistent with previous studies, synovial fluid levels of HA
(Figure 4a) were also significantly higher in RA patients (119.8
± 4.49 µg/ml) than in asymptomatic donors and patients with
OA (59.75 ± 17.2 and 57.97 ± 2.15 µg/ml, respectively;
donors versus RA patients, P < 0.05). Comparison of all the
values for patient and asymptomatic donor groups suggested
a possible trend for a positive correlation between SF levels of
OP-1 and HA (r
2
= 0.05061, P = 0.12; data not shown). Fur-
ther evaluation of this relationship within each group showed
that the trend for this correlation was evident in asymptomatic
donor samples (r
2
= 0.09717, P = 0.4142), but was especially
evident in OA samples (r
2
= 0.1345, P = 0.0654) (Figure 5).
There is one sample in the OA group that has the highest level
of OP-1 and may perhaps be an outlier. The removal of this
sample makes the positive correlation between OP-1 and HA
in the OA group statistically significant (P < 0.045). No such
trend was observed for SF samples obtained from RA patients
(r
2
= 0.02600, P = 0.5818).
Quantification of keratan sulfate in SF by ELISA and
correlation with OP-1 content
The SF levels of AgKS were higher in asymptomatic donors
(5.2 ± 2.67 µg/ml) than in OA patients (0.53 ± 0.46 µg/ml;
donors versus OA patients, P < 0.02; Figure 4b), and they
were lowest in RA samples (0.31 ± 0.23 µg/ml; donors versus
RA patients, P < 0.01; Figures 4b). In marked contrast to what
was observed for HA, levels of OP-1 tended to correlate neg-
atively with levels of AgKS (data not shown), although no sta-
tistical significance was achieved.
Discussion
The presence of measurable amounts of endogenous OP-1 in
human SF was documented for the first time in the current
study. At this time, the existence of other BMPs in SF has not
been reported. Notably, the levels of endogenous OP-1
detected in SF from asymptomatic donor joints (about 50 ng/
ml) were comparable with those extractable from normal artic-
ular cartilage (about 50 ng/g dry weight or about 150–200 ng/
ml) [18,19]. Although we did not identify quantitative differ-
ences in the levels of endogenous OP-1 in asymptomatic
donor SF relative to osteoarthritic SF, there were specific qual-
itative differences; whereas asymptomatic donor SF had no
detectable or barely detectable active (mature) OP-1, the SF
from OA joints had both pro-OP-1 and active (mature) OP-1.
The absence of significant differences in the overall levels of
OP-1 in asymptomatic donor and OA SF may be due to sev-
eral factors. The 'asymptomatic donor' group consisted of a
limited number of samples within which there were wide varia-
tions in age, sex, medical history, cause of death, and the mor-
phological state of the joints. Moreover, although SF was
obtained exclusively from asymptomatic organ donors without
Figure 4
Concentration of hyaluronan and antigenic keratan sulfate in synovial fluid samplesConcentration of hyaluronan and antigenic keratan sulfate in synovial fluid samples. The levels of (a) the hyaluronan (HA) concentration and (b) the
antigenic keratan sulfate (KS) in synovial fluid from asymptomatic donors (donor) and from osteoarthritis (OA) and rheumatoid arthritis (RA) patients
detected by an ELISA ([21] and [20], respectively). The data are presented as the mean ± standard error of the mean.
Arthritis Research & Therapy Vol 8 No 3 Chubinskaya et al.
Page 8 of 10
(page number not for citation purposes)
a prior history of joint disease, the majority of these joints dis-
played moderate degrees of morphological changes (Collins
grade varied from 0 to 4), which may reflect the presence of
pre-clinical OA conditions. Studies should thus be performed
to distinguish between the concentrations of OP-1 in SF from
truly normal joints (Collins grade 0–1) and from degenerative
joints (Collins grade 2–4 and Mankin grade 5 and above) [28].
In contrast to the situation in normal cartilage matrix, the major-
ity of the OP-1 resident in SF appeared to be in the pro-form.
This raises an important question about the source of pro-OP-
1 in SF and the proteins that OP-1 may be bound to. The latter
issue is of particular interest to biotech companies that focus
on the therapeutic applications of BMPs and their optimal for-
mulations for delivery into the joints. Because OP-1 has been
identified in all connective tissues of the synovial joint, the OP-
1 found in SF could be derived from any or all of these tissues;
this remains to be clarified. Another interesting finding is that
OP-1 was present in the cleaved active form in the SF of OA
patients and RA patients, suggesting that, at least in part, the
active form of OP-1 could be generated during synovitis
[29,30].
It is also possible that the cleavage and activation of OP-1 in
joint disease reflects the action of proteinases induced by cat-
abolic mediators active in RA and the late stages of OA. Our
previous animal and human studies support this statement
[23,31]. In a well-recognized animal model of OA, the intra-
articular injection of chymopapain into the rabbit knee joint
induced the activation of OP-1 in cartilage, which was
detected by immunohistochemistry [31]. In addition, the acti-
vation and release of mature OP-1 protein in organ cultures of
normal human adult articular chondrocytes treated with IL-1β
was noted [23]. The finding that SF levels of OP-1 were higher
in RA patients than in OA patients or asymptomatic donors is
also consistent with recent reports that IL-1, which is present
at higher concentrations in RA joints than in OA joints, is an
effective modulator and/or stimulator of BMP-2 and OP-1
mRNA expression by normal and OA human articular chondro-
cytes [23,32,33]. These data are also in line with previous find-
ings that documented an elevation of transforming growth
factor beta in SF of RA patients [29]. Furthermore, we believe
that elevated levels of OP-1 protein in RA SF may be due to
the release of OP-1 residing in the extracellular matrix rather
than to an increase in its synthesis. This belief is because
matrix metalloproteinases activated by cytokines present in SF
of RA patients induce the depletion of the extracellular matrix
[34], thus promoting the release of growth factors bound to its
latent domains or to the matrix components [35].
Interestingly, SF levels of OP-1 tended to correlate positively
with levels of HA, but correlate negatively with levels of AgKS.
In our studies, the highest concentration of HA was found in
RA SF compared with asymptomatic donor and OA SF sam-
ples. This may primarily represent hypermetabolism in the syn-
ovium and other connective tissues, as reported by Thonar
and colleagues [36], and could be the result of increased
inflammation in RA joints. Higher serum levels of HA have been
demonstrated to prognosticate the rapid destruction of carti-
lage and joints [37-39]. OP-1, BMP-2 and other growth fac-
tors have been shown by us and others [23,32,40] to increase
in response to inflammation. The trend towards a positive cor-
relation between SF levels of HA and OP-1 found in this study
is therefore not surprising and may have a prognostic and/or
diagnostic value for the inflammatory processes in articular
joints.
The tendency for a negative correlation between OP-1 SF lev-
els (anabolic factor) and AgKS content (a measure of the met-
abolic activity of the cells) supports the role of OP-1 in
promoting anabolic responses and reducing catabolic events
[14-16]. The elevated levels of AgKS could also suggest that
cartilage matrix remodeling is higher in asymptomatic samples
than in symptomatic samples. The majority of studies on SF
markers have previously attempted to correlate levels of cata-
bolic factors that promote or cause cartilage degradation with
levels of fragments of matrix molecules that were purported to
reflect primarily an enhancement in the turnover or degrada-
tion of cartilage or other connective tissues [4,5]. In the current
study we attempted to compare parameters with opposite
modes of action: comparing OP-1, which promotes anabolic,
reparative processes, with factors that have been considered
markers of degradative events (AgKS) or of predisposition to
cartilage degeneration (HA). While no definitive statistical cor-
relations were found, clear trends were observed for positive
correlation between OP-1 and HA levels, especially for OA SF
samples.
Figure 5
Correlation between osteogenic protein 1 and hyaluronan levels in syn-ovial fluid samples from osteoarthritis patientsCorrelation between osteogenic protein 1 and hyaluronan levels in syn-
ovial fluid samples from osteoarthritis patients. In the osteoarthritis
group, there is a tendency for a positive correlation between synovial
fluid osteogenic protein 1 (OP-1) and hyaluronan (HA) contents (r
2
=
0.1345, P = 0.0654).
Available online />Page 9 of 10
(page number not for citation purposes)
In the future, strict selection criteria for each experimental
group and a larger sample pool may help to better understand
whether the measurement of the SF level of an anabolic factor
such as OP-1 may have prognostic or diagnostic value in
arthritic conditions, especially when the analysis is performed
in conjunction with measurement of well-accepted markers of
cartilage anabolic or catabolic processes. The inclusion of
other catabolic agents, such as proinflammatory cytokines and
proteinases, in such analyses may provide a better under-
standing of the processes occurring in the articular joint.
Conclusion
Taken together, the results of this study suggest that measure-
ment of OP-1 in joint fluid may prove to be of potential value in
the clinical evaluation of joint disease processes. The results
also suggest that identification of the binding partners of OP-
1 in the formation of high-molecular-weight aggregates may
provide important information for the formulation and delivery
of growth factors into target areas.
Competing interests
The authors declare that they have no competing interests.
Authors' contributions
SC, the principal investigator of the study, made substantive
intellectual contributions to the conception, design, analysis,
interpretation, and writing of the data. BSF was involved in the
acquisition, analysis and interpretation of the data and in draft-
ing the manuscript. MM was involved in sample acquisition
and analysis of the data. BK was involved in the development
and adaptation of the ELISA method for SF and in the acquisi-
tion of data. CAM was involved in data acquisition. EJMAT was
involved in interpretation of the data and revising the manu-
script critically for important intellectual content. MEL and LO
were involved in data acquisition and editing the manuscript.
DCR was involved in the interpretation of data and editing the
manuscript. JAB made substantive intellectual contributions to
the study.
Acknowledgements
This work was supported by NIH SCOR grant 2P50-AR-39239-11, NIH
AR 47654 grant (SC), and Stryker Research grants KK-001 and SC-
001 (SC). The authors would like to acknowledge Dr Arkady Margulis
for procuring synovial fluid samples from organ donors. The authors
would also like to acknowledge the Gift of Hope Organ & Tissue Donor
Network and donors' families.
References
1. Thonar EJ-MA, Manicourt D-H: Noninvasive markers in osteoar-
thritis. In Osteoarthritis: Diagnosis and Medical/Surgical Man-
agement 3rd edition. Edited by: Moskowitz R, Goldberg V, Howell
DS, Altman RD, Buckwalter J. Philadelphia, PA: WB Saunders;
2001:293-313.
2. Thonar EJ-MA, Kuettner KE, Williams JM: Markers of articular
cartilage injury and healing. In Sports Medicine and Arthroscopy
Review New York: Raven Press; 1994:13-28.
3. Campion GV, McCrae F, Schnitzer TJ, Lenz ME, Dieppe PA, Tho-
nar EJ-MA: Levels of keratan sulfate in the serum and synovial
fluid of patients with osteoarthritis of the knee. Arthritis Rheum
1991, 34:1254-1259.
4. Manicourt D-H, Triki R, Fukuda K, Devogelaer J-P, Nagant de Deux-
chaisnes C, Thonar EJ-MA: Levels of circulating tumor necrosis
factor α and interleukin-6 in patients with rheumatoid arthritis.
Relationship to serum levels of hyaluronan and antigenic ker-
atin sulfate. Arthritis Rheum 1993, 36:490-499.
5. Manicourt D-H, Poilvache P, van Egeren A, Devogelaer J-P, Lenz
ME, Thonar EJ-MA: Synovial fluid levels of tumor necrosis fac-
tor α and oncostatin M correlate with levels of markers of the
degradation of crosslinked collagen and cartilage aggrecan in
rheumatoid arthritis but not in osteoarthritis. Arthritis Rheum
2000, 43:281-288.
6. Poole AR: Can serum biomarkers assays measure the pro-
gression of cartilage degeneration in osteoarthritis? Arthritis
Rheum 2002, 46:2549-2552.
7. Masuhara K, Nakai T, Yamaguchi K, Yamasaki S, Sasaguri Y: Sig-
nificant increases in serum and plasma concentrations of
matrix metalloproteinases 3 and 9 in patients with rapidly
destructive osteoarthritis of the hip. Arthritis Rheum 2002,
46:2625-2631.
8. Chubinskaya S, Merrihew C, Cs-Szabo G, Mollenhauer J, McCart-
ney J, Rueger DC, Kuettner KE: Human articular chondrocytes
express osteogenic protein-1. J Histochem Cytochem 2000,
48:239-250.
9. Söder S, Hakimiyan A, Rueger DC, Kuettner KE, Aigner T, Chubin-
skaya S: Antisense inhibition of osteogenic protein-1 disturbs
human articular cartilage integrity. Arthritis Rheum 2005,
52:468-478.
10. Flechtenmacher J, Huch K, Thonar EJ-MA, Mollenhauer JA, Davies
SR, Schmid TM, Puhl W, Sampath TK, Aydelotte MB, Kuettner KE:
Recombinant human osteogenic protein-1 is a potent stimula-
tor of the synthesis of cartilage proteoglycans and collagens
by human articular chondrocytes. Arthritis Rheum 1996,
39:1896-1904.
11. Chubinskaya S, Rueger DC, Berger RA, Kuettner KE: Osteogenic
protein-1 and its receptors in human articular cartilage. In The
Many Faces of Osteoarthritis Edited by: Hascall V, Kuettner KE.
Basel: Birkhäuser Verlag; 2002:81-89.
12. Chubinskaya S, Kuettner KE: Regulation of osteogenic proteins
by chondrocytes. Int J Biochem Cell Biol 2003, 35:1323-1340.
13. Nishida Y, Knudson CB, Kuettner KE, Knudson W: Osteogenic
protein-1 promotes the synthesis and retention of extracellu-
lar matrix within bovine articular cartilage and chondrocyte
cultures. Osteoarthritis Cartilage 2000, 8:127-136.
14. Huch K, Wilbrink B, Flechtenmacher J, Koepp HE, Aydelotte MB,
Sampath TK, Kuettner KE, Mollenhauer JA, Thonar EJ-MA: Effects
of recombinant human osteogenic protein 1 on the production
of proteoglycan, prostaglandin E2, and interleukin-1 receptor
antagonist by human articular chondrocytes cultured in the
presence of interleukin-1β. Arthritis Rheum 1997,
40:2157-2161.
15. Koepp HE, Sampath KT, Kuettner KE, Homandberg GA: Osteo-
genic protein-1 (OP-1) blocks cartilage damage caused by
fibronectin fragments and promotes repair by enhancing pro-
teoglycan synthesis. Inflamm Res 1999, 48:199-204.
16. Im HJ, Pacione C, Chubinskaya S, Van Wijnen AJ, Sun Y, Loeser
RF: Inhibitory effects of insulin-like growth factor-1 and osteo-
genic protein-1 on fibronectin fragment- and interleukin-
1beta-stimulated matrix metalloproteinase-13 expression in
human chondrocytes. J Biol Chem 2003, 278:25386-25394.
17. Rueger DC, Chubinskaya S: BMPs in articular cartilage repair.
In Bone Morphogenetic Proteins: Regeneration of Bone and
Beyond Edited by: Vukicevic S, Sampath KT. Basel: Birkhauser
Verlag AG; 2004:109-132.
18. Merrihew C, Kumar B, Heretis K, Rueger DC, Kuettner KE, Chubin-
skaya S: Alterations in endogenous osteogenic protein-1 (OP-
1) with degeneration of human articular cartilage. J Orthop
Res 2003, 21:899-907.
19. Chubinskaya S, Kumar B, Merrihew C, Heretis K, Rueger D, Kuet-
tner KE: Age-related changes in cartilage endogenous OP-1.
Biochim Biophys Acta 2002, 1588:126-134.
20. Thonar EJ-MA, Lenz ME, Klintworth GK, Caterson B, Pachman LM,
Glickman P, Katz R, Huff J, Kuettner KE: Quantification of keratan
sulfate in blood as a marker of cartilage catabolism. Arthritis
Rheum 1985, 28:1367-1376.
Arthritis Research & Therapy Vol 8 No 3 Chubinskaya et al.
Page 10 of 10
(page number not for citation purposes)
21. Li X-Q, Thonar EJ-MA, Knudson W: Accumulation of hyaluronate
in human lung carcinoma as measured by a new hyaluronate
ELISA. Connect Tissue Res 1989, 19:243-253.
22. Altman R, Asch E, Bloch D, Bole G, Borenstein D, Brandt K,
Christy W, Cooke TD, Greenwald R, Hochberg M, et al.: Develop-
ment of criteria for the classification and reporting of osteoar-
thritis: Classification of osteoarthritis of the knee. Arthritis
Rheum 1986, 29:1039-1049.
23. Merrihew C, Soeder S, Rueger DC, Kuettner KE, Chubinskaya S:
Modulation of endogenous osteogenic protein-1 by inter-
leukin-1β in human articular cartilage. J Bone Joint Surg Am
2003, 85-A(Suppl 3):67-74.
24. Lindquist U, Chichibu K, Delpech B, Goldberg RL, Knudson W,
Poole AR, Laurent TC: Seven different assays of hyaluronan
compared for clinical utility. Clin Chem 1992, 38:127-132.
25. Collins DH: Osteoarthritis. In The Pathology of Articular and Spi-
nal Diseases Edward Arnold: London; 1949:74-115.
26. Jones WK, Richmond EA, White K, Sasak H, Kusmik W, Smart J,
Oppermann H, Rueger DC, Tucker RF: Osteogenic protein-1
(OP-1) expression and processing in Chinese hamster ovary
cells: isolation of a soluble complex containing the mature and
pro-domains of OP-1. Growth Factors 1994, 11:215-225.
27. Muehleman C, Bareither D, Huch K, Cole A, Kuettner KE: Preva-
lence of degenerative morphological changes in the joints of
the lower extremity. Osteoarthritis Cartilage 1997, 5:23-37.
28. Chubinskaya S, Kuettner KE, Cole AA: Expression of matrix met-
alloproteinases in human normal and damaged articular carti-
lage from knee and ankle joints. Lab Invest 1999,
79:1669-1677.
29. Taketazu F, Kato M, Gobl A, Iichijo H, ten Dijke P, Itoh J, Kyogoku
M, Ronnelid J, Miyazono K, Heldin CH: Enhanced expression of
transforming growth factor-beta s and transforming growth
factor-beta type II receptor in the synovial tissues of patients
with rheumatoid arthritis. Lab Invest 1994, 70:620-630.
30. Miossec R, Naviliat M, Dupuy DA, Sany J, Banchereau J: Low lev-
els of interleukin-4 and high levelsof transforming growth fac-
tor beta in rheumatoid synovitis. Arthritis Rheum 1990,
33:1180-1187.
31. Muehleman C, Kuettner KE, Rueger DC, ten Dijke P, Chubinskaya
S: Immunohistochemical localization of osteogenic protein-1
and its receptors in rabbit articular cartilage. J Histochem
Cytochem 2002, 50:1341-1350.
32. Fukui N, Zhu Y, Maloney WJ, Clohisy J, Sandell L: Stimulation of
BMP-2 expression by pro-inflammatory cytokines IL-1 and
TNF-alpha in normal and osteoarthritic chondrocytes. J Bone
Joint Surg Am 2003, 85-A(Suppl 3):59-66.
33. Elshaier AM, Hakimiyan A, Margulis A, Rueger DC, Chubinskaya S:
Effect of IL-1β on OP-1 signaling in human adult articular
chondrocytes [abstract]. Trans 51st ORS 2005, 30:4.
34. Chu CQ, Field M, Allard S, Abney E, Feldman M, Maini RN: Detec-
tion of cytokines at the cartilage/pannus junction in patients
with rheumatoid arthritis: implication for the role of cytokines
in cartilage destruction and repair. Br J Rheumatol 1992,
31:653-661.
35. Fava R, Olsen N, Keski Oja J, Moses H, Pincus T: Active and
latent forms of transforming growth factor beta activity in syn-
ovial effusions. J Exp Med 1989, 169:291-296.
36. Thonar EJ-MA, Lenz ME, Masuda K, Manicourt D-H: Body fluid
markers of cartilage metabolism. In Dynamics of Bone and Car-
tilage Metabolism Edited by: Seibel MJ, Robins SP, Bilezikian JP.
San Diego, CA: Academic Press; 1999:453-464.
37. Sharif M, George E, Shepstone L, Knudson W, Thonar EJ-MA,
Cushnaghan J, Dieppe P: Serum hyaluronic acid level as a pre-
dictor of disease progression in osteoarthritis of the knee.
Arthritis Rheum 1995, 38:760-767.
38. Goldberg RL, Huff JP, Lenz ME, Glickman P, Katz R, Thonar EJ-
MA: Elevated plasma levels of hyaluronate in patients with
osteoarthritis and rheumatoid arthritis. Arthritis Rheum 1991,
34:799-807.
39. Hedin P-J, Weitoft T, Hedin H, Engstrom-Laurent A, Saxne T:
Serum concentrations of hyaluronan and proteoglycan in joint
disease: lack of association. J Rheumatol 1991, 18:1601-1605.
40. Lee S-S, Joo Y-S, Kim W-U, Min D-J, Min J-K, Park S-H, Cho C-S,
Kim H-Y: Vascular endothelial growth factor levels in the
serum and synovial fluid of patients with rheumatoid arthritis.
Clin Exp Rheumatol 2001, 19:321-324.