Báo cáo y học: " Identification of arthritis-related gene clusters by microarray analysis of two independent mouse models for rheumatoid arthritis" pdf
Bạn đang xem bản rút gọn của tài liệu. Xem và tải ngay bản đầy đủ của tài liệu tại đây (1.06 MB, 13 trang )
Open Access
Available online />Page 1 of 13
(page number not for citation purposes)
Vol 8 No 4
Research article
Identification of arthritis-related gene clusters by microarray
analysis of two independent mouse models for rheumatoid
arthritis
Noriyuki Fujikado, Shinobu Saijo and Yoichiro Iwakura
Center for Experimental Medicine, Institute of Medical Science, University of Tokyo, 4-6-1 Shirokanedai, Minato-ku, Tokyo 108-8639, Japan
Corresponding author: Yoichiro Iwakura,
Received: 25 Jan 2006 Revisions requested: 16 Feb 2006 Revisions received: 11 May 2006 Accepted: 2 Jun 2006 Published: 28 Jun 2006
Arthritis Research & Therapy 2006, 8:R100 (doi:10.1186/ar1985)
This article is online at: />© 2006 Fujikado et al.; licensee BioMed Central Ltd.
This is an open access article distributed under the terms of the Creative Commons Attribution License ( />),
which permits unrestricted use, distribution, and reproduction in any medium, provided the original work is properly cited.
Abstract
Rheumatoid arthritis (RA) is an autoimmune disease affecting
approximately 1% of the population worldwide. Previously, we
showed that human T-cell leukemia virus type I-transgenic mice
and interleukin-1 receptor antagonist-knockout mice develop
autoimmunity and joint-specific inflammation that resembles
human RA. To identify genes involved in the pathogenesis of
arthritis, we analyzed the gene expression profiles of these
animal models by using high-density oligonucleotide arrays. We
found 1,467 genes that were differentially expressed from the
normal control mice by greater than threefold in one of these
animal models. The gene expression profiles of the two models
correlated well. We extracted 554 genes whose expression
significantly changed in both models, assuming that
pathogenically important genes at the effector phase would
change in both models. Then, each of these commonly changed
genes was mapped into the whole genome in a scale of the 1-
megabase pairs. We found that the transcriptome map of these
genes did not distribute evenly on the chromosome but formed
clusters. These identified gene clusters include the major
histocompatibility complex class I and class II genes,
complement genes, and chemokine genes, which are well
known to be involved in the pathogenesis of RA at the effector
phase. The activation of these gene clusters suggests that
antigen presentation and lymphocyte chemotaxisis are
important for the development of arthritis. Moreover, by
searching for such clusters, we could detect genes with
marginal expression changes. These gene clusters include
schlafen and membrane-spanning four-domains subfamily A
genes whose function in arthritis has not yet been determined.
Thus, by combining two etiologically different RA models, we
succeeded in efficiently extracting genes functioning in the
development of arthritis at the effector phase. Furthermore, we
demonstrated that identification of gene clusters by
transcriptome mapping is a useful way to find potentially
pathogenic genes among genes whose expression change is
only marginal.
Introduction
Rheumatoid arthritis (RA) is a systemic, chronic inflammatory
disease primarily affecting the joints. The synovial inflammation
leads to cartilage destruction, bone erosion, joint deformity,
and loss of joint function [1]. This disease is autoimmune in
nature and characterized by the infiltration of T cells, B cells,
macrophages, and neutrophils into the synovial lining and fluid
of the periarticular spaces [2]. The infiltrating cells express
adhesion molecules and produce a variety of inflammatory
cytokines and chemokines to contribute to the complex patho-
genesis of RA. The etiopathogenesis of this disease has not
yet been completely elucidated.
Using gene-manipulating techniques, we have established
two mouse models for RA: human T-cell leukemia virus type I
(HTLV-I)-transgenic (Tg) mice and interleukin-1 receptor
antagonist (IL-1Ra)-knockout (KO) mice [3,4]. HTLV-I is the
causative agent of adult T-cell leukemia. The virus encodes a
CIA = collagen-induced arthritis; Csf2rb = colony-stimulating factor 2 receptor beta; DC = dendritic cell; EST = expressed sequence tag; GM-CSF
= granulocyte-macrophage colony-stimulating factor; HTLV-I = human T-cell leukemia virus type I; Ig = immunoglobulin; IL-1Ra = interleukin-1 recep-
tor antagonist; KO = knockout; KS = knockout severe; MHC = major histocompatibility complex; MMP = matrix metalloproteinase; Ms4a = mem-
brane-spanning four-domains, subfamily A; PGIA = proteoglycan-induced arthritis; RA = rheumatoid arthritis; SAM = significance analysis of
microarrays; SD = standard deviation; Tg = transgenic; TS = transgenic severe.
Arthritis Research & Therapy Vol 8 No 4 Fujikado et al.
Page 2 of 13
(page number not for citation purposes)
transcriptional transactivator, Tax, within the pX region that
activates multiple cellular genes, including those for cytokines,
cytokine receptors, and immediate early transcriptional fac-
tors, via activation of enhancers such as cAMP-responsive
enhancer, nuclear factor kappa B-dependent enhancers, or
serum-responsive elements [5,6]. Tg mice carrying the tax
gene spontaneously develop autoimmune arthritis, likely due
to overexpression of proinflammatory cytokines and increased
T-cell resistance to Fas-induced apoptosis [2,3,7]. IL-1Ra is a
negative regulator of IL-1 which competes for the binding of IL-
1α and IL-1β to its cognate receptors. Because the three iso-
forms of IL-1Ra protein, which possess inhibitory activity
against IL-1, are synthesized by alternative splicing of a single
gene, we produced mice deficient in all three isoforms of IL-
1Ra. These IL-1Ra-KO mice also spontaneously develop
autoimmune arthritis, due to excess T-cell activation [2,4,8].
Although the etiology of the arthritis differs between these
mice, the histopathologies of the lesions are very similar.
These lesions exhibit marked synovial and periarticular inflam-
mation, with articular erosion caused by the invasion of granu-
lation tissues, which closely resembles RA in humans.
Osteoclast activation is obvious at the pannus, and the infiltra-
tion of inflammatory cells, including neutrophils, lymphocytes,
and macrophages, can be detected in synovial tissues. Both
of these mouse models develop autoimmunity with elevated
antibody titers against immunoglobulin (Ig) G and type II colla-
gen. Given that the histopathology observed in these models
closely resembles that seen in RA in humans, pathogenic
mechanisms similar to those operating in these models are
likely functioning in human RA. Actually, an etiological correla-
tion was suggested between HTLV-I and RA in Japan [9,10].
In addition, an association was suggested between IL-1Ra
polymorphism and RA [11,12]. We took advantage of these
mouse models of RA to analyze comprehensively the gene
expression patterns functioning in this condition, using high-
density oligonucleotide arrays.
In this analysis, we focused on genes that exhibited similar
changes in both of the disease models. This approach should
efficiently identify the genes involved in the pathogenesis of
arthritis irrespective of the etiology, and these genes should
include those that function in the effector phase of inflamma-
tion or in the bone erosion process. To determine the genomic
distribution of the arthritis-related genes, we assigned these
genes into the whole genome. The members of the same gene
family often form clusters on the chromosomes [13,14]. Fur-
thermore, because relatively wide genomic regions form open
complex structures upon activation [15,16], we expected that
genes in the same cluster might be functionally related. Using
this analysis, we identified several arthritis-related gene clus-
ters in the specific genomic regions, and some of the genes
were successfully detected as a cluster whose expression
changes are only marginal.
Materials and methods
Mice
Two mouse models were used for gene expression profiling
studies. HTLV-I-Tg mice, originally produced by injection of the
LTR-env-pX-LTR region of the HTLV-I genome into a (C3H/
Hen x C57BL/6J) F
1
embryo [3], were backcrossed to BALB/
cA mice (CLEA Japan, Inc., Tokyo, Japan) for 20 generations.
These mice start to develop arthritis spontaneously at 4 weeks
of age, and 60% and 80% of the mice are affected at 3
months and 6 months of age, respectively. In this study,
severely arthritic (score 3) HTLV-I-Tg mice (TS) (females, 6 to
9 weeks of age) were used. Wild-type (WT) littermates were
used as controls. IL-1Ra-KO mice, generated by homologous
recombination as described previously [4], were backcrossed
to BALB/cA mice for eight generations. These mice develop
arthritis spontaneously at 5 weeks of age. Eighty percent and
almost 100% of the mice became arthritic by 8 and 13 weeks
of age, respectively. In this study, IL-1Ra-KO mice (male, 13
weeks of age) that suffered from severe arthritis (score 3) (KS)
were used; WT littermates were used as controls. The severity
of arthritis was graded for each paw on a scale of 0 to 3 for the
degree of redness and swelling: grade 0 = normal; grade 1 =
light swelling of the joint and/or redness of the footpad; grade
2 = obvious joint swelling; and grade 3 = severe swelling and
fixation of the joint. All mice were kept under specific patho-
gen-free conditions in an environmentally controlled clean
room at the Center for Experimental Medicine, Institute of
Medical Science, University of Tokyo. Experiments were con-
ducted according to the institutional ethical guidelines for ani-
mal experimentation and the safety guidelines for gene
manipulation.
Preparation of total RNA and poly (A)
+
RNA from joints
After removal of the skin and muscle, portions of the leg con-
taining the knee, ankle, and finger joints were rapidly frozen in
liquid nitrogen. Frozen joints were homogenized using a phy-
scotron (Microtech, Chiba, Japan). Total RNA was extracted
from the joint homogenate using the acid guanidium thiocy-
anate/phenol chloroform extraction method. To avoid fluctua-
tion between individuals, total joint RNAs were pooled from
three (TS) or five (KS) arthritic mice and five or six (WT) normal
mice for replicates; poly (A)
+
RNA was purified on oligo (dT)-
cellulose columns. RNA quality was confirmed by spectropho-
tometry and electrophoresis on formaldehyde gels.
Microarray analysis
A Murine Genome U74v2 Set (GeneChip
®
system; Affymetrix,
Santa Clara, CA, USA) consisting of three GeneChip probe
arrays containing approximately 36,000 oligonucleotide probe
sets (6,000 full-length mouse genes and 30,000 expressed
sequence tag (EST) clusters from the UniGene database) was
used for the analysis. Sample labeling and processing were
performed according to the manufacturer's protocol. In brief,
double-stranded complementary DNA was synthesized, and
biotinylated cRNA was prepared and then hybridized to the
Available online />Page 3 of 13
(page number not for citation purposes)
GeneChip sets. Fluorescent hybridization signals were devel-
oped with phycoerythrin-conjugated streptavidin. Fluorescent
signals were collected by laser scan, and the results were ana-
lyzed with GENECHIP ANALYSIS software (Affymetrix).
Northern blot hybridization analysis
Tissues were quickly frozen in liquid nitrogen and stored at -
80°C. Frozen tissues were homogenized with a physcotron
(Microtech). Total RNA was isolated from tissue homogenates
by an acid guanidium thiocyanate-phenol-chloroform extrac-
tion method, and poly (A)
+
RNA was purified using an oligo
(dT)-cellulose column. The poly (A)
+
RNA was extracted from
the paws of four to five mice. Then, the poly (A)
+
RNA was
electrophoresed on a 1.3% denatured agarose gel and trans-
ferred to a nylon membrane (Gene Screen Plus; NEN Life Sci-
ence, Boston, MA, USA). Hybridization was performed at
42°C overnight with
32
P-labeled DNA probes labeled with
Megaprime DNA labeling system (GE Healthcare, Little Chal-
font, Buckinghamshire, UK) and
32
P-dCTP (3,000 Ci/mmol;
NEN Life Science). The radioactivity was measured using the
BAS-2000 system (Fuji Photo Film Co., Tokyo, Japan).
Statistical analysis and data management
Data were normalized by the average fluorescent intensities
for each microarray experiment, and expression values based
on the perfect match/mismatch model were calculated for
each GeneChip. For the pairwise comparison between normal
mice and arthritic mice, signals were filtered using several cri-
teria. The following gene sets were selected: (a) the gene was
present in the arthritic mice but absent in the normal mice, (b)
the gene was present in the normal mice but absent in the
arthritic mice, and (c) the gene was present in both arthritic
mice and normal mice. Fold changes for gene expression were
calculated, and genes with more than a threefold change in
gene expression were selected for further characterization.
We assumed that the same group of genes is involved in the
pathogenesis of arthritis in both models, and we extracted
commonly changed genes in both models. To extract com-
monly changed genes, we applied the principle of the signifi-
cance analysis of microarrays (SAM) method [17] for the
statistical analysis of the microarray data. SAM assigns a
Figure 1
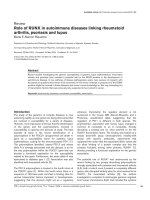
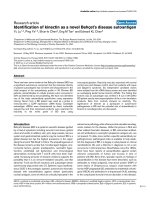
The relationship of gene expression levels between human T-cell leuke-mia virus type I- transgenic (HTLV-I-Tg) and interleukin-1 receptor antagonist-knockout (IL-1Ra-KO) miceThe relationship of gene expression levels between human T-cell leuke-
mia virus type I- transgenic (HTLV-I-Tg) and interleukin-1 receptor
antagonist-knockout (IL-1Ra-KO) mice. (a) The reciprocal relationship
between log-transformed (base 2) normalized gene expression levels
for the two models was plotted. The correlation coefficient of gene
expression between HTLV-I-Tg and IL-1Ra-KO mice is r = 0.77. (b)
Commonly activated genes were extracted in different models using
the SAM (significance analysis of microarrays) method; their relation-
ship is shown. The correlation coefficient is r = 0.91.
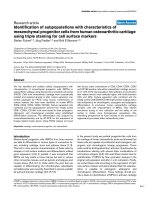
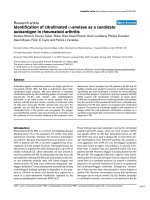
Figure 2
Distribution of arthritis-related genes on the mouse genomeDistribution of arthritis-related genes on the mouse genome. The num-
bers of significantly changed genes are indicated for each chromosome
(closed bars). The density of significantly changed genes (Number of
significantly changed genes/Total number of genes on the chromo-
some estimated from the data of Mouse Genome Search in The Bioin-
formatics Analytical Toolkit; see Materials and methods) is shown for
each chromosome (open circles).
Arthritis Research & Therapy Vol 8 No 4 Fujikado et al.
Page 4 of 13
(page number not for citation purposes)
Table 1
Identified arthritis-related gene clusters by transcriptome mapping
ID Chr. Position (Mb) n of genes * n of total genes Included gene families
1 17 33 10 48 MHC class II
217348 67Complement
317352 40MHC class I
17 33–35 20 155 MHC class II/Complement/MHC class I
4 11 81 3 10 CC chemokine ligand
511825 25Schlafen
6 11 83 3 23 CC chemokine ligand
11 81–83 11 58 Schlafen/CC chemokine ligand
7 6 68 3 19 Immunoglobulin kappa chain
8 6 69 4 16 Immunoglobulin kappa chain
9 6 70 2 13 Immunoglobulin kappa chain
6 68–70 9 48 Immunoglobulin kappa chain
10 12 112 4 8 Immunoglobulin heavy chain
11 12 113 2 3 Immunoglobulin heavy chain
12 112–113 6 11 Immunoglobulin heavy chain
12 6 124 5 23 Complement/C-type lectin superfamily
13 15 79 5 27 Colony stimulating factor 2 receptor, beta
14 19 11 5 32 Membrane spanning four-domain, subfamily A
15 2 165 4 32 -
16 3 146 4 10 Guanylate nucleotide binding protein
17 17 17 4 11 Formyl peptide receptor
18 19 5 4 45 -
19 1 75 3 15 -
20 1 167 3 16 Selectin
21 1 174 3 20 (Fc receptor)
22 2 91 3 26 -
23 2 129 3 18 -
24 4 131 3 18 -
25 5 136 3 38 -
26 7 3 3 28 Paired-Ig-like receptor
27 7 37 3 46 -
Available online />Page 5 of 13
(page number not for citation purposes)
score, d(i), to each gene on the basis of changes in gene
expression relative to the standard deviation (SD) of repeated
measurements. The 'relative difference', d(i), in gene expres-
sion is defined as:
where
A
(i) and
N
(i) are the average expression levels of a
gene (i) in subjects A (arthritis) and N (normal), respectively.
The 'gene-specific scatter', s(i), is the SD of the expression
measurements. At low expression levels, the variance d(i) can
be high because of the small values of s(i). To avoid this, SAM
defines a small positive constant, s
0
, in the denominator of the
above equation. For the present data, computation yielded s
0
= 0.11. The d(i) is calculated for each gene, and significance
levels are indicated by the q value. The q value is the lowest
false discovery rate, the probability of being identified by
chance [17]. To assess the reliability of the data, the mean val-
ues of the fold change and SD were calculated for the genes
that were more than two in the selected gene sets. The range
of variance was estimated by calculating ratios of SD to fold
change. Forty genes exhibited duplicate or triplicate clones. A
conservative approach of interval estimation was used to esti-
mate the dispersion of the fold-change values. The estimated
ratio was 0.20 (95% confidence interval, 0.15 to 0.25). This
result signifies that the fold-change data fluctuated approxi-
mately 20% in this study.
Gene mapping
Using the public genome database [18], SOURCE database
[19], and Mouse Genome Search in The Bioinformatics Ana-
lytical Toolkit [20], we identified the chromosome and the
genomic position at which the genes localized for 538 of the
554 significant genes. Gene cluster scanning was performed
in each 1-megabase (Mb) window. Hierarchical clustering was
applied using 'Cluster' software, and the results were visual-
ized with 'Treeview' software (M. Eisen at Stanford University,
Stanford, CA)[21,22].
Results
Gene expression profiles of synovial tissues from RA
model mice compared with normal control mice
We isolated mRNA from the joints of two arthritic models
(HTLV-I-Tg and IL-1Ra-KO mice) and normal WT mice. Iso-
lated RNAs were labeled and hybridized to microarrays con-
taining the oligonucleotide probes of approximately 36,000
mouse genes and ESTs from the UniGene database. In this
microarray system, each gene is represented as 16 distinct
pairs of 25-mer oligonucleotide probes. The mismatch oligo-
nucleotide provides an estimate of the background hybridiza-
tion signal. Fluctuation of the fold-change data of the genes
that were spotted more than once on the array was only 20%
(see Materials and methods). Therefore, these arrays allow
highly reproducible quantification of gene expression levels.
We set the threshold at threefold change, which is well above
the fluctuation. We performed two independent experiments
for control mice, using independently pooled mRNA prepara-
tions from five and six mice, respectively, and the reproducibil-
ity was confirmed. Fluctuation between two experiments was
approximately 11%. For arthritic mice, mRNA was prepared
from three HTLV-I-Tg mice and five IL-1Ra-KO mice, respec-
tively. Accordingly, we selected 1,467 genes, for which the
transcript levels changed at least threefold in one of either
model from that of the corresponding WT normal mice (Addi-
tional File 1). When the log-transformed (base 2) normalized
intensities of gene expression levels in HTLV-I-Tg mice were
plotted against those of IL-1Ra-KO mice, we observed a high
degree of correlation (correlation coefficient, r = 0.77),
28 7 39 3 29 Serum amyloid A
29 7 120 3 30 -
30 9 126 3 15 CC chemokine receptor
31 11 70 3 30 -
32 11 102 3 37 -
33 11 114 3 33 -
34 11 117 3 23 -
35 15 105 3 25 -
36 19 12 3 33 -
37 X 63 3 40 -
*Numbers of total genes in the corresponding 1 megabase were obtained from a Mouse Genome Search in The Bioinformatics Analytical Toolkit
[20]. CC, Cysteine-Cysteine type; Chr., chromosome; Fc, Fragment crystallizable; ID, identification number; Ig, immunoglobulin; Mb, megabase;
MHC, major histocompatibility complex.
Table 1 (Continued)
Identified arthritis-related gene clusters by transcriptome mapping
di
xi x i
si s
AN
()
() ()
()
=
−
+
0
x x
Arthritis Research & Therapy Vol 8 No 4 Fujikado et al.
Page 6 of 13
(page number not for citation purposes)
indicating that the expression of many genes changed in both
models (Figure 1).
We thought that the same group of genes should be involved
in the development of arthritis in both models at the effector
phase because the pathology of the disease is very similar
between two models. We searched for genes for which the
expression levels in the joints changed significantly in both
models in comparison with those seen in normal joints, by
applying the principle of the SAM method and assuming that
genes that function during the effector phase would be simi-
larly activated in both models despite the differences in etiol-
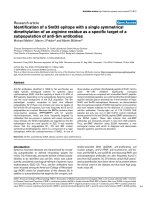
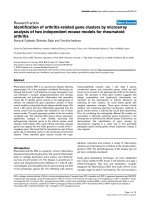
Figure 3
Transcriptome mapping of arthritis-related genesTranscriptome mapping of arthritis-related genes. Significantly changed
genes were mapped in every 1-megabase (Mb) interval on each chro-
mosome. The chromosome number is indicated in each panel; the peak
number corresponds to the number given in Table 1.
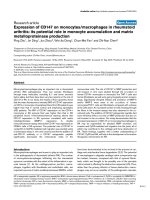
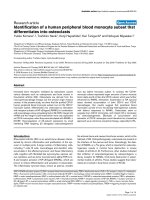
Figure 4
Identification of the H-2 gene cluster as one of the significantly acti-vated gene clustersIdentification of the H-2 gene cluster as one of the significantly acti-
vated gene clusters. The maximal gene density was mapped to the
chromosome (Chr.) 17, 33- to 35-megabase (Mb) locus (#1–3), which
corresponds to the H-2 gene cluster. Fold changes of the significantly
changed genes are shown in a region of 2-Mb window. Hierarchical
clustering of these genes is visualized below. Each column represents
an RNA preparation from a different mouse strain, and each row repre-
sents an individual gene. Red represents expression levels greater than
the median, and green represents those less than the median. The
expression scale is shown at the bottom. KS, interleukin-1 receptor
antagonist-knockout mice; MHC, major histocompatibility complex; TS,
human T-cell leukemia virus type I- transgenic mice; WT, wild-type
mice.
Available online />Page 7 of 13
(page number not for citation purposes)
ogy. The fold change in expression for each gene and the
significance levels (q values) were estimated based on SAM,
assuming that the gene expression profiles were identical
between two models. A large population of 594 spots was sig-
nificantly enhanced, and four spots were suppressed, indicat-
ing that the expression levels of these genes changed in both
models. Because a number of the spots on the array contained
oligonucleotides derived from different clones of the same
gene, these spots were found to include a total of 554 non-
redundant genes (Additional File 2). The log-transformed
(base 2) normalized expression intensities of HTLV-I-Tg mice
were then plotted against those of IL-1Ra-KO mice (Figure
1b). The gene expression levels of HTLV-I-Tg mice and IL-1Ra-
KO mice were quite similar with a high correlation coefficient
(r = 0.91), supporting the assumption that a panel of specific
genes was similarly activated in both RA models and success-
fully extracted common, differentially expressed genes.
Genes overexpressed in the synovial tissues of RA
model mice
The expression of Saa3 increased maximally (approximately
62-fold) in this study. Saa1 and Saa2, members of the same
family, were also significantly upregulated. Many chemokine
genes were also activated, including Cxcl5 (LIX/human ENA-
78), Cxcl1 (KC/human Gro-α), Cxcl13 (BLC), Ccl8 (MCP-2),
Ccl7 (MCP-3), Ccl2 (MCP-1), Cxcl14 (MIP-2γ), Ccl5
(RANTES), Cxcl16 (SR-PSOX), Ccl9 (Mip-1γ), Ccl6 (C10),
and Cxcl12 (SDF-1). Genes encoding chemokine receptors,
such as Ccr5, Ccr6, Ccr1, Ccr2, Cxcr2 (IL-8Rβ), and Cxcr4,
were also enhanced significantly. The proinflammatory
cytokine Il1b (IL-1β) and its receptor Il1r1 (CD121a) were
upregulated. Although the expression of multiple cytokine
receptors, including Tnfrsf1b (TNF-αR/CD120b),Il6ra
(CD126), Il17r (CDw217), Il4ra (CD124), Ifnar2 (IFN-α/βR),
Csf2rb1 (commonβ/CDw131), Csf2rb2 (granulocyte-macro-
phage colony-stimulating factor [GM-CSF]/IL-3R), and Csf3r
(G-CSFR/CD114), increased, expression of their ligands
could not be detected by our analysis. TNF and TNF-R family
genes, such as Tnfsf3 (LTβ), Tnfsf11 (RANKL/ODF), Tnfsf31
(Pglyrp), Tnfrsf5 (CD40), and Tnfrsf21 (DR6), were signifi-
cantly elevated. The expression of genes encoding growth fac-
tor and growth factor-related proteins, including Mdk, Il18bp,
Grn, Tnfaip6, C1qtnf6, Fgf10, Igf1, Igfbp4, Igfbp7, Pdgfrl, and
Bmp1, were also enhanced. In addition to these chemokine/
chemokine receptor and cytokine/cytokine receptor genes,
several genes were identified that were upregulated more than
10-fold in comparison with WT mice. These genes include
Igh-4 (Serum IgG1) and Mmp3 (Stromelysin-1), which are
transcripts known to be increased in RA [23,24]. Although the
expression of Glipr2, Kcnj15, and Col4a2 were also elevated,
no augmentation of these genes has been previously reported
in patients with RA. Moreover, major histocompatibility com-
plex (MHC) class I genes (H2-D1,H2-Q8, and H2-Q10) and
MHC class II genes (H2-DMa, H2-DMb1, H2-Aa, H2-Ab1,
H2-Ea, and H2-Eb1) were also significantly detected in this
data set. Using northern blot hybridization techniques, we
examined the expression of some of these genes, including
key cytokines and cytokine receptors (Il1b,Il1r1,Il-6ra), chem-
okines and their receptors (Cxcl5,Cxcl1,Cxcr4), class I and
class II MHC genes, and several selected genes, and con-
firmed the augmented expression of these genes ([3,4] and
unpublished data about novel genes).
Density of the arthritis-related genes within each
chromosome
Many functionally related genes form clusters on chromo-
somes [25]. Because these functionally related genes might
be activated simultaneously upon induction, we analyzed the
gene expression changes of gene clusters by using the micro-
array data. Using the public genome database, we located
Figure 5
Arthritis-related gene clusters on chromosome (Chr.) 11Arthritis-related gene clusters on chromosome (Chr.) 11. The peak at
the Chr. 11, 81- to 83-megabase (Mb) (#4–6) includes Ccl and Slfn
family clusters. An expanded view of this region in 2-Mb window is
shown. Hierarchical clustering patterns of the expression levels are
shown below. Ccl and Slfn genes are clearly clustered in specific nar-
row loci and augmented in arthritis. CC, Cysteine-Cysteine type; KS,
interleukin-1 receptor antagonist-knockout mice; TS, human T-cell
leukemia virus type I- transgenic mice; WT, wild-type mice.
Arthritis Research & Therapy Vol 8 No 4 Fujikado et al.
Page 8 of 13
(page number not for citation purposes)
538 of the 554 significant genes at the specific chromosomal
regions. The numbers of the significant genes were plotted
against each chromosome (Figure 2), giving a maximal number
for chromosome 11, which included 54 genes. A second peak
in gene number was found on chromosome 7, which included
43 genes. The third peak on chromosome 6 included 41
genes. Subsequently, chromosomes 1, 2, and 17 were deter-
mined to have many significant genes. The density of the sig-
nificant genes was similar among all chromosomes, with the
gene density of 0.022 ± 0.007 (Number of significantly
changed genes/Total number of the genes in the chromo-
some) (shown by open circles in Figure 2). Thus, genes signif-
icantly upregulated in arthritis were broadly distributed
throughout the genome.
Transcriptome mapping of arthritis-related genes
To identify individual gene clusters, significantly changed
genes were mapped into the whole genome in 1-Mb scale
windows. Figure 3 shows the distribution of the arthritis-
related genes across the entire mouse genome; the gene clus-
ters derived from this mapping are shown in Table 1. For con-
venience, peaks were numbered, and the numbers in
parentheses below indicate the peaks in Figure 3. The map
allocates many of the clusters of highly expressed genes to
specific chromosomal regions. The maximal gene density was
Figure 6
Arthritis-related gene clusters on chromosomes (Chr.) 6, 15, and 19Arthritis-related gene clusters on chromosomes (Chr.) 6, 15, and 19. The peaks on the Chr. 6, 124-megabase (Mb) locus (#12) includes comple-
ment receptor genes and C-type lectin superfamily (Clecsf) genes, the Chr. 15, 79-Mb locus (#13) includes colony-stimulating factor 2 receptor
beta (Csf2rb) genes, and the Chr. 19, 11-Mb locus (#14) includes membrane spanning four-domain, subfamily A (Ms4a) genes. Expanded views of
these loci in 1-Mb scale and hierarchical clustering of the expression levels of these genes are shown.
Available online />Page 9 of 13
(page number not for citation purposes)
mapped to the chromosome 17, 33-Mb locus (#1) and neigh-
boring 34-Mb (#2) and 35-Mb (#3) regions, which corre-
sponds to the H-2 gene cluster. An expanded view of this
region, shown in Figure 4, included 20 genes in a 2-Mb scale.
The H-2 gene cluster includes a number of MHC class I, MHC
class II, and complement genes. Hierarchical clustering and
visualization of these genes classified these significant genes
into three major functionally related gene clusters, including
MHC class II cluster (H2-Dmb1, H2-Aa, H2-Ea, H2-DMa, H2-
Ab1, and H2-Eb1), complement cluster (C2, C4,H2-Bf) and
MHC class I cluster (H2-D1,H2-Q8,H2-Q10). The expression
of additional immune-related genes, including Psmb9 (protea-
some) and Ltb (lymphotoxin β), was also increased signifi-
cantly. Another peak was on chromosome 11, 82-Mb locus
(#5) and neighboring 81-Mb (#4) and 83-Mb (#6) locus,
which corresponds to the Slfn and Ccl gene cluster. An
expanded view of this region, shown in Figure 5, included 11
genes in a 2-Mb scale. Hierarchical clustering and visualization
of these genes, including CC chemokine ligand genes (Ccl2,
Ccl6, Ccl7, Ccl8, Ccl9, and Ccl5) and schlafen genes (Slfn1,
Slfn2, Slfn5, Slfn3, and Slfn4), are shown. Moreover, chromo-
some 6, 68- to 70-Mb locus (#7–9) and chromosome 12,
112- and 113-Mb locus (#10,11) formed a cluster of immu-
noglobulin genes, kappa chain and heavy chain, respectively.
High peaks were also detected at chromosome 6, 124-Mb
locus (#12), which includes several genes of complement
receptor and C-type lectin superfamily, and chromosome 15,
79-Mb locus (#13), which includes colony-stimulating factor 2
receptor beta (Csf2rb) genes, and chromosome 19, 11-Mb
locus (#14), which includes membrane-spanning four-domain,
subfamily A (Ms4a) genes. An expanded view of these loci,
shown in Figure 6, included five genes in a 1-Mb scale,
respectively. Chromosome 6, 124-Mb locus (#12) includes
clusters of complement genes (C1r, C3ar1) and C-type lectin
superfamily members (Clecsf6, Clecsf8). (Clecsf8 mapped
into the 125-Mb locus but was next to Clecsf6.) Chromosome
15, 79-Mb locus (#13) includes two Csf2rb genes (Csf2rb1
and Csf2rb2). Chromosome 19, 11-Mb locus (#14) corre-
sponds to the Ms4a gene cluster
(Ms4a7,Ms4a6c,Ms4a4d,Ms4a6d, and an unknown gene).
Although no gene family is detected in chromosome 2, 165-
Mb locus (#15) and chromosome 19, 5-Mb locus (#18), chro-
mosome 3, 146-Mb locus (#16) and chromosome 17, 17-Mb
locus (#17) included gene clusters of guanylate nucleotide
binding protein and formyl peptide receptor, respectively.
Additional clusters of arthritis-related genes were identified,
including a cluster of selectin genes on chromosome 1, 167-
Mb locus (#20), Fc receptor cluster on chromosome 1, 174-
and 175-Mb locus (#21), a paired-Ig-like receptor cluster on
chromosome 7, 3-Mb locus (#26), serum amyloid A cluster on
chromosome 7, 39-Mb locus, and the gene cluster of CC
chemokine receptor on chromosome 9, 126-Mb region (#30).
Discussion
To identify genes involved in the pathogenesis of arthritis, we
used two mouse models of RA. We compared the gene
expression profiles between arthritic and normal joints using
these models and high-density oligonucleotide arrays, in
which approximately 36,000 genes and ESTs were analyzed.
We analyzed whole synovial tissues instead of using specific
cell types because we are interested in not only expression
level changes of a gene in a cell but also cell population
changes in the synovial tissues [26]. In this report, we exam-
ined two mouse models of RA on the same genetic back-
ground and with the same disease severity. These models,
however, had different etiologies; one is caused by the action
of HTLV-I-tax, whereas the other is caused by excessive IL-1
signaling. We extracted common genes that were involved in
the pathogenesis of both models irrespective of etiology. We
expected to identify genes involved in the effector phase of the
disease, given that the molecular mechanisms of the initial
phase are likely to be different between the two models. With
RNA samples derived from the arthritic joints of either animal
model, 1,467 clones on the array (approximately 4%) changed
at least threefold. The SAM method demonstrated that, of
these genes, 554 independent genes changed significantly in
both models. These results suggest that a large proportion of
the genes functioned in the pathogenesis of arthritis in both
models. These common genes may function during the effec-
tor phase, whereas those specific to the individual models may
function during the initiation phase in a manner dependent on
the disease etiology. We analyzed those genes whose
changes in expression levels were common to both models.
We found that several interesting genes, including Saa3,
which encodes serum amyloid A3, were activated in these
models. This gene was upregulated to the greatest extent in
arthritic mice in comparison with normal mice. IL-1β induces
Saa3 expression; SAA3, in conjunction with SAA1/SAA2, the
expressions of which were also elevated in our RA animal
models, induce the transcription of matrix metalloproteinases
(MMPs) [27]. Mmp-3 and Mmp-9, two such MMPs, were also
upregulated in these models. We also observed the upregula-
tion of chemokines, such as Cxcl5 and Cxcl1, which recruit
neutrophils to inflammatory sites through interactions with
their receptor, Cxcr2, which was also elevated and confirmed
by northern blot analysis. Cxcr4 may be involved in the chem-
otaxis of naïve and memory T cells. Ccr1 and Ccr2 are
expressed on memory T cells, whereas Ccr5 is expressed on
Th1 cells. Cxcl12, the ligand for Cxcr4, is produced in the syn-
ovial tissues of patients with RA [28]. Ccr6, Ccr1,Ccr2, and
Ccr5 are specifically expressed by immature dendritic cells
(DCs). Cxcl16, a T-cell chemoattractant, is expressed by both
DCs and macrophages. Ccl9, Ccl6, and Cxcl13 are produced
by macrophages, whereas Cxcl14 is produced by fibroblasts.
In addition, proinflammatory cytokines and their cognate
receptors, such as IL-1
β
, IL-1RI, TNF-α R, IL-6Rα, IL-2R
γ
, and
IL-17R, were also significantly elevated. Thus, the augmented
Arthritis Research & Therapy Vol 8 No 4 Fujikado et al.
Page 10 of 13
(page number not for citation purposes)
expression of chemokines, cytokines, and their receptors indi-
cates the importance of these molecules in the pathogenesis
of arthritis. It should be noted, however, that the augmentation
of the expression of these genes does not necessarily mean
that they are actually activated in synovial tissues. The
infiltrated cells to the inflammatory sites may also contribute to
the expression pattern. Elevated expression of serum amyloid
proteins, metalloproteinases, chemokines, and cytokines is
frequently seen in the joints of patients with RA [27,29], indi-
cating that the gene expression profiles obtained from these
RA models well represent those of patients with RA. In addi-
tion, many of these genes function during the elicitation of
inflammation, supporting our assumption that the genes aug-
mented in both models may function during the effector phase.
The gene expression profiles of the well-known collagen-
induced arthritis (CIA) model [30] and proteoglycan-induced
arthritis (PGIA) model [31] for RA have already been reported.
We compared our data set with those previously reported
gene expression profiles. Approximately 60% of the genes that
changed in our models also changed more than two times at
the early phase of CIA. Moreover, approximately 63% of the
genes corresponded to those found in PGIA at the acute
phase and approximately 50% at the initiation and chronic
phases. Thus, many of the genes that changed in our models
also changed in other RA models, suggesting similar mecha-
nisms function in common in those RA models.
We next mapped these arthritis-related genes into chromo-
somes. Working under the assumption that functionally related
genes form clusters, we attempted to detect the activation of
genes as a cluster, despite the fact that small individual
changes were not prominent enough to be detected in our ini-
tial analysis. The most significant peak was detected at chro-
mosome 17, 33- to 35-Mb locus (#1–3), which corresponds
to the H-2 gene cluster. Other significant peaks corresponded
to chromosome 11, 81- to 83-Mb locus (#4–6), which
includes members of the Ccl and Slfn families. Immunoglobu-
lin kappa chain cluster in chromosome 6, 68- to 70-Mb locus,
and heavy chain cluster in chromosome 12, 112- and 113-Mb
locus were also clearly detected. Moreover, chromosome 6,
124-Mb locus, chromosome 15, 79-Mb locus, and chromo-
some 19, 11-Mb locus were included in those attractive gene
clusters. The contribution of individual genes in these clusters
was relatively small; the significance of a number of genes was
recognized only after summation of genes in a specific region.
These gene clusters, however, clearly contained a number of
genes important in the development of arthritis. For more than
two decades, the MHC gene cluster has been known to affect
susceptibility to a variety of autoimmune diseases [32,33].
This region encodes the MHC class I and class II genes and
other immune-related genes. MHC molecules are required for
antigen recognition by lymphocytes, ultimately leading to acti-
vation and progression of immune responses. In addition, the
genes encoding complement components are located within
this cluster. The levels of antibodies against IgG and type II
collagen were elevated in these RA models [4,7]. In these ani-
mal models, the classical pathway components of the comple-
ment system, C2, C4, encoded within this cluster (Chr. 17, 34
Mb: [#2]), and C1q, C1s, and C1r, found within other clusters,
were upregulated, suggesting that immune complexes are
involved in this enhancement of gene expression. The expres-
sion of Factor B, encoded by the H2-Bf gene within this clus-
ter, was also augmented. Factor B is an essential component
of the alternative pathway of the complement system. This
pathway is also critical in K/BxN mice, another animal model
for RA [34]. Although the alternative pathway typically acti-
vated by microbial surface antigens, immune complexes
formed by autoreactive IgGs initiate the alternative pathway in
these models to facilitate the development of arthritis.
A similar study was reported using CIA and PGIA models,
identifying gene clusters in chromosomes 2, 3, 11, and 17
[35]. Their microarray chips contained a total of 9,500 known
genes and EST clones, and 203 selected genes were mapped
into the chromosome using a 1.5-fold differential expression
threshold level. In the present study, 36,000 oligonucleotide
probe sets were included in microarray chips, and 550
selected common significant genes were mapped. Interest-
ingly, we detected the same clusters in chromosomes 2, 11,
and 17 as were found in their study, suggesting that the same
genes are involved in the pathogenesis of arthritis regardless
of the etiology. Although they found a cluster on chromosome
3 containing 11 genes within an 8-Mb-long region, this region
was not assigned as an arthritis-related gene cluster in our
study, because of broad distribution of genes among cyto-
bands. Increased expressions of MHC class I and class II
genes, complement genes, and chemokine genes were
already reported using microarray analysis ofsynovium from
patients with RA [36] or streptococcal cell wall-induced arthri-
tis in rats [37]. Our results in this report using mouse arthritis
models are consistent with these results, suggesting that
these genes are commonly involved in the pathogenesis at the
elicitation phase.
The gene density peak on chromosome 11, 81- to 83-Mb
locus (#4–6) includes the Ccl and Slfn genes. CCL2, CCL7,
and CCL8, members of the chemokine family, recruit mono-
cytes to sites of injury and infection. CCL2 influences innate
immunity through this effect on monocytes and modulates
adaptive immunity via control of Th2 polarization. An antago-
nist of CCL2 suppresses arthritis in the MRL-lpr mouse model
[38]. CCL5, a T-cell and monocyte chemoattractant, plays an
important role in the development of adjuvant-induced arthritis
[39]. CCL6 was expressed in experimental inflammatory
demyelinating disorders that promote recruitment of macro-
phages [40]. CCL9 recruits CD11b
+
DCs and promotes oste-
oclast differentiation and survival [41,42]. Thus, these
chemokines likely play important roles in the development of
arthritis. Schlafen proteins have been implicated in the regula-
Available online />Page 11 of 13
(page number not for citation purposes)
tion of cell growth and T-cell development [43]. These proteins
form a big family localized to a specific genomic cluster adja-
cent to the Ccl gene cluster. This region coincides with a
number of autoimmune susceptibility loci, including the Idd4,
Eae7, and Orch3 loci [44]. The syntenic region of this locus
on 17q of the human genome is associated with several
autoimmune disorders [45]. Therefore, this genomic region on
chromosome 11 is likely to be critical in the development of
autoimmune arthritis.
The chromosome 6, 124-Mb (#12) locus is one of the non-
MHC susceptibility loci linked to complex autoimmune dis-
eases. The mouse 6 F2 cytoband, the syntenic rat 4q42 and
human 12p13 regions, have been implicated in several inflam-
matory diseases, including arthritis [46-48], systemic lupus
erythematosus, spontaneous diabetes, atheroscrelosis,
encephalomyelitis, asthma or airway hyper-responsiveness,
and allergy. This locus contains complement component
genes and C-type lectin superfamily genes, suggesting the
possible involvement of these protein products in the develop-
ment of arthritis. Chromosome 15, 79-Mb locus (#13) con-
tains GM-CSF receptor, Csf2rb1, and Csf2rb2. It is known
that GM-CSF plays an important role in the effector phase of
arthritis [49]. Ms4a family molecules, CD20 (Ms4a1), and
high-affinity IgE receptor
β
chain (FcΣ RIb; Ms4a2) tended to
be upregulated in these animals, but these genes were not sig-
nificantly altered in this study. Although the upregulation of
Ms4a7, Ms4a4d, Ms4a6d, and Ms4a6c expression in chro-
mosome 19, 11-Mb locus (#14) was also observed in these
models of RA, the roles of these molecules in the development
of arthritis are not yet known [50].
We succeeded in identifying several arthritis-related genes by
transcriptome mapping, but we might have failed to detect
some potentially important genes. Because we analyzed
mRNA preparations from whole joints, but not from a single
species of cell, we could not detect the change of gene
expression in a single species of cell when the content of this
single species of cell was low in the whole joint. Furthermore,
we could not detect the MMP gene cluster consisting of MMP-
1a, MMP-1b, MMP-3, and MMP-13 on chromosome 9, which
were suggested to be involved in the pathogenesis [51]. In
this case, we demonstrated upregulation of MMP-3 and MMP-
9 in both HTLV-I-Tg and IL-1Ra-KO mice. However, MMP-8
and MMP-13 expressions were increased more than three
times in IL-1Ra-KO mice, but not in HTLV-I-Tg mice, excluding
the MMP-8 and MMP-13 genes from significantly activated
genes in this analysis. Unfortunately, MMP-1a and MMP-1b
were not mounted on the GeneChip we used (Murine
Genome U74v2 Set). Nonetheless, the present data are
important for understanding the transcriptome change as a
whole, reflecting the gene expression levels not only in a single
cell but also in the cell population in the joints during arthritis.
Conclusion
We have performed a comprehensive transcriptome analysis
of two etiologically different RA models by using microarrays
and identified many genes that were commonly activated in
both models. Because the initial mechanism of the pathogen-
esis should be different between two models, these genes are
likely to function during the effector phase of the disease.
Moreover, by mapping genes with marginal expression
changes into chromosomes, we succeeded in detecting sev-
eral gene clusters that may be involved in the pathogenesis of
arthritis. A similar approach, using microarrays, will likely be
useful in detecting genes related to multiple disease
processes.
Competing interests
The authors declare that they have no competing interests.
Authors' contributions
NF, SS, and YI participated in the design of the study. SS pre-
pared the RNA samples and carried out northern blot hybridi-
zation with NF. NF carried out the analysis of the microarray
data, developed the transcriptome mapping analysis method,
and drafted this manuscript as a part of his doctoral thesis. YI
planned, designed, and organized the study and finalized the
manuscript. All authors read and approved the final
manuscript.
Additional files
Acknowledgements
We thank Drs. Michiyasu Takeyama and Reiko Sasada at Discovery
Research Laboratories II, Takeda Chemical Industries Ltd., for kind anal-
ysis with microarrays, and Dr. Sumio Sugano, Human Genome Center,
Institute of Medical Science, University of Tokyo, for kindly providing a
mouse spleen cDNA library. We also thank all of the members of the lab-
oratory for their excellent animal care. This research was supported by
grants from the Ministry of Education, Science, Sport and Culture of
The following Additional files are available online:
Additional File 1
An Excel file containing a table that lists the first 1,467
selected genes, the expression of which changed more
than three times in one of the mouse models.
See />supplementary/ar1985-S1.xls
Additional File 2
An Excel file containing a table that lists five hundred fifty-
four non-redundant genes, the expression of which
significantly changed in both models.
See />supplementary/ar1985-S2.xls
Arthritis Research & Therapy Vol 8 No 4 Fujikado et al.
Page 12 of 13
(page number not for citation purposes)
Japan and the Ministry of Health and Welfare of Japan and a fellowship
from the Japan Society for the Promotion of Science.
References
1. Firestein GS, Zvaifler NJ: Rheumatoid Arthritis: A Disease of Dis-
ordered Immunity New York: Raven Press; 1992.
2. Iwakura Y: Roles of IL-1 in the development of rheumatoid
arthritis: consideration from mouse models. Cytokine Growth
Factor Rev 2002, 13:341-355.
3. Iwakura Y, Tosu M, Yoshida E, Takiguchi M, Sato K, Kitajima I,
Nishioka K, Yamamoto K, Takeda T, Hatanaka M, et al.: Induction
of inflammatory arthropathy resembling rheumatoid arthritis
in mice transgenic for HTLV-I. Science 1991, 253:1026-1028.
4. Horai R, Saijo S, Tanioka H, Nakae S, Sudo K, Okahara A, Ikuse T,
Asano M, Iwakura Y: Development of chronic inflammatory
arthropathy resembling rheumatoid arthritis in interleukin 1
receptor antagonist-deficient mice. J Exp Med 2000,
191:313-320.
5. Yoshida M: HTLV-I tax: regulation of gene expression and
disease. Trends Microbiol 1993, 1:131-135.
6. Sugamura K, Hinuma Y: Human Retroviruses: HTLV-I and HTLV-
II Volume 2. New York: Plenum Press; 1993.
7. Iwakura Y, Saijo S, Kioka Y, Nakayama-Yamada J, Itagaki K, Tosu
M, Asano M, Kanai Y, Kakimoto K: Autoimmunity induction by
human T cell leukemia virus type 1 in transgenic mice that
develop chronic inflammatory arthropathy resembling rheu-
matoid arthritis in humans. J Immunol 1995, 155:1588-1598.
8. Horai R, Nakajima A, Habiro K, Kotani M, Nakae S, Matsuki T,
Nambu A, Saijo S, Kotaki H, Sudo K, et al.: TNF-alpha is crucial
for the development of autoimmune arthritis in IL-1 receptor
antagonist-deficient mice. J Clin Invest 2004, 114:1603-1611.
9. Motokawa S, Hasunuma T, Tajima K, Krieg AM, Ito S, Iwasaki K,
Nishioka K: High prevalence of arthropathy in HTLV-I carriers
on a Japanese island. Ann Rheum Dis 1996, 55:193-195.
10. Eguchi K, Origuchi T, Takashima H, Iwata K, Katamine S, Nagataki
S: High seroprevalence of anti-HTLV-I antibody in rheumatoid
arthritis. Arthritis Rheum 1996, 39:463-466.
11. Perrier S, Coussediere C, Dubost JJ, Albuisson E, Sauvezie B: IL-
1 receptor antagonist (IL-1RA) gene polymorphism in
Sjogren's syndrome and rheumatoid arthritis. Clin Immunol
Immunopathol 1998, 87:309-313.
12. Cantagrel A, Navaux F, Loubet-Lescoulie P, Nourhashemi F, Enault
G, Abbal M, Constantin A, Laroche M, Mazieres B: Interleukin-
1beta, interleukin-1 receptor antagonist, interleukin-4, and
interleukin-10 gene polymorphisms: relationship to occur-
rence and severity of rheumatoid arthritis. Arthritis Rheum
1999, 42:1093-1100.
13. Caron H, van Schaik B, van der Mee M, Baas F, Riggins G, van
Sluis P, Hermus MC, van Asperen R, Boon K, Voute PA, et al.: The
human transcriptome map: clustering of highly expressed
genes in chromosomal domains. Science 2001,
291:1289-1292.
14. Lercher MJ, Urrutia AO, Hurst LD: Clustering of housekeeping
genes provides a unified model of gene order in the human
genome. Nat Genet 2002, 31:180-183.
15. Cremer T, Cremer C: Chromosome territories, nuclear architec-
ture and gene regulation in mammalian cells. Nat Rev Genet
2001, 2:292-301.
16. de Laat W, Grosveld F: Spatial organization of gene expres-
sion: the active chromatin hub. Chromosome Res 2003,
11:447-459.
17. Tusher VG, Tibshirani R, Chu G: Significance analysis of micro-
arrays applied to the ionizing radiation response. Proc Natl
Acad Sci U S A 2001, 98:5116-5121.
18. National Center for Biotechnology Information [http://
www.ncbi.nlm.nih.gov/]
19. SOURCE [
]
20. The Bioinformatics Analytical Toolkit [se-
genome.bcm.tmc.edu]
21. Cluster Analysis and Visualization [ />Software.htm]
22. Eisen MB, Spellman PT, Brown PO, Botstein D: Cluster analysis
and display of genome-wide expression patterns. Proc Natl
Acad Sci U S A 1998, 95:14863-14868.
23. Chapuy-Regaud S, Nogueira L, Clavel C, Sebbag M, Vincent C,
Serre G: IgG subclass distribution of the rheumatoid arthritis-
specific autoantibodies to citrullinated fibrin. Clin Exp Immunol
2005, 139:542-550.
24. Ainola MM, Mandelin JA, Liljestrom MP, Li TF, Hukkanen MV, Kont-
tinen YT: Pannus invasion and cartilage degradation in rheu-
matoid arthritis: involvement of MMP-3 and interleukin-1beta.
Clin Exp Rheumatol 2005, 23:644-650.
25. Hurst LD, Pal C, Lercher MJ: The evolutionary dynamics of
eukaryotic gene order. Nat Rev Genet 2004, 5:299-310.
26. Gregersen PK, Brehrens TW: Fine mapping the phenotype in
autoimmune disease: the promise and pitfalls of DNA micro-
array technologies. Genes Immun 2003, 4:175-176.
27. Vallon R, Freuler F, Desta-Tsedu N, Robeva A, Dawson J, Wenner
P, Engelhardt P, Boes L, Schnyder J, Tschopp C, et al.: Serum
amyloid A (apoSAA) expression is up-regulated in rheumatoid
arthritis and induces transcription of matrix
metalloproteinases. J Immunol 2001, 166:2801-2807.
28. Nanki T, Hayashida K, El-Gabalawy HS, Suson S, Shi K, Girschick
HJ, Yavuz S, Lipsky PE: Stromal cell-derived factor-1-CXC
chemokine receptor 4 interactions play a central role in CD4
+
T
cell accumulation in rheumatoid arthritis synovium. J Immunol
2000, 165:6590-6598.
29. Firestein GS: Evolving concepts of rheumatoid arthritis. Nature
2003, 423:356-361.
30. Thornton S, Sowders D, Aronow B, Witte DP, Brunner HI, Giannini
EH, Hirsch R: DNA microarray analysis reveals novel gene
expression profiles in collagen-induced arthritis. Clin Immunol
2002, 105:155-168.
31. Adarichev VA, Vermes C, Hanyecz A, Mikecz K, Bremer EG, Glant
TT: Gene expression profiling in murine autoimmune arthritis
during the initiation and progression of joint inflammation.
Arthritis Res Ther 2005, 7:R196-207.
32. Deighton CM, Walker DJ, Griffiths ID, Roberts DF: The contribu-
tion of HLA to rheumatoid arthritis. Clin Genet 1989,
36:178-182.
33. Marrack P, Kappler J, Kotzin BL: Autoimmune disease: why and
where it occurs. Nat Med 2001, 7:899-905.
34. Ji H, Ohmura K, Mahmood U, Lee DM, Hofhuis FM, Boackle SA,
Takahashi K, Holers VM, Walport M, Gerard C, et al.: Arthritis crit-
ically dependent on innate immune system players. Immunity
2002, 16:157-168.
35. Firneisz G, Zehavi I, Vermes C, Hanyecz A, Frieman JA, Glant TT:
Identification and quantification of disease-related gene
clusters. Bioinformatics 2003, 19:1781-1786.
36. van der Pouw Kraan TC, van Gaalen FA, Huizinga TW, Pieterman
E, Breedveld FC, Verweij CL: Discovery of distinctive gene
expression profiles in rheumatoid synovium using cDNA
microarray technology: evidence for the existence of multiple
pathways of tissue destruction and repair. Genes Immun
2003, 4:187-196.
37. Rioja I, Clayton CL, Graham SJ, Life PF, Dickson MC: Gene
expression profiles in the rat streptococcal cell wall-induced
arthritis model identified using microarray analysis. Arthritis
Res Ther 2005, 7:R101-117.
38. Gong JH, Ratkay LG, Waterfield JD, Clark-Lewis I: An antagonist
of monocyte chemoattractant protein 1 (MCP-1) inhibits arthri-
tis in the MRL-lpr mouse model. J Exp Med 1997, 186:131-137.
39. Barnes DA, Tse J, Kaufhold M, Owen M, Hesselgesser J, Strieter
R, Horuk R, Perez HD: Polyclonal antibody directed against
human RANTES ameliorates disease in the Lewis rat adjuvant-
induced arthritis model. J Clin Invest 1998, 101:2910-2919.
40. Asensio VC, Lassmann S, Pagenstecher A, Steffensen SC, Hen-
riksen SJ, Campbell IL: C10 is a novel chemokine expressed in
experimental inflammatory demyelinating disorders that pro-
motes recruitment of macrophages to the central nervous
system. Am J Pathol 1999, 154:1181-1191.
41. Zhao X, Sato A, Dela Cruz CS, Linehan M, Luegering A, Kucharzik
T, Shirakawa AK, Marquez G, Farber JM, Williams I, et al.: CCL9 is
secreted by the follicle-associated epithelium and recruits
dome region Peyer's patch CD11b
+
dendritic cells. J Immunol
2003, 171:2797-2803.
42. Okamatsu Y, Kim D, Battaglino R, Sasaki H, Spate U, Stashenko
P: MIP-1 gamma promotes receptor-activator-of-NF-kappa-B-
ligand-induced osteoclast formation and survival. J Immunol
2004, 173:2084-2090.
Available online />Page 13 of 13
(page number not for citation purposes)
43. Schwarz DA, Katayama CD, Hedrick SM: Schlafen, a new family
of growth regulatory genes that affect thymocyte
development. Immunity 1998, 9:657-668.
44. Griffiths MM, Encinas JA, Remmers EF, Kuchroo VK, Wilder RL:
Mapping autoimmunity genes. Curr Opin Immunol 1999,
11:689-700.
45. Wandstrat A, Wakeland E: The genetics of complex autoim-
mune diseases: non-MHC susceptibility genes. Nat Immunol
2001, 2:802-809.
46. McIndoe RA, Bohlman B, Chi E, Schuster E, Lindhardt M, Hood L:
Localization of non-Mhc collagen-induced arthritis suscepti-
bility loci in DBA/1j mice. Proc Natl Acad Sci U S A 1999,
96:2210-2214.
47. Lorentzen JC, Glaser A, Jacobsson L, Galli J, Fakhrai-rad H,
Klareskog L, Luthman H: Identification of rat susceptibility loci
for adjuvant-oil-induced arthritis. Proc Natl Acad Sci U S A
1998, 95:6383-6387.
48. Cornelis F, Faure S, Martinez M, Prud'homme JF, Fritz P, Dib C,
Alves H, Barrera P, de Vries N, Balsa A, et al.: New susceptibility
locus for rheumatoid arthritis suggested by a genome-wide
linkage study. Proc Natl Acad Sci U S A 1998,
95:10746-10750.
49. Cook AD, Braine EL, Campbell IK, Rich MJ, Hamilton JA: Block-
ade of collagen-induced arthritis post-onset by antibody to
granulocyte-macrophage colony-stimulating factor (GM-CSF):
requirement for GM-CSF in the effector phase of disease.
Arthritis Res 2001, 3:293-298.
50. Liang Y, Tedder TF: Identification of a CD20-, FcepsilonRIbeta-
, and HTm4-related gene family: sixteen new MS4A family
members expressed in human and mouse. Genomics 2001,
72:119-127.
51. Dorr S, Lechtenbohmer N, Rau R, Herborn G, Wagner U, Muller-
Myhsok B, Hansmann I, Keyszer G: Association of a specific
haplotype across the genes MMP1 and MMP3 with radio-
graphic joint destruction in rheumatoid arthritis. Arthritis Res
Ther 2004, 6:R199-207.