Báo cáo y học: "Long-term cyclical in vivo loading increases cartilage proteoglycan content in a spatially specific manner: an infrared microspectroscopic imaging and polarized light microscopy study" ppt
Bạn đang xem bản rút gọn của tài liệu. Xem và tải ngay bản đầy đủ của tài liệu tại đây (440.65 KB, 8 trang )
Open Access
Available online />Page 1 of 8
(page number not for citation purposes)
Vol 8 No 5
Research article
Long-term cyclical in vivo loading increases cartilage
proteoglycan content in a spatially specific manner: an infrared
microspectroscopic imaging and polarized light microscopy study
Ehsan Saadat
1
, Howard Lan
1
, Sharmila Majumdar
1,2
, David M Rempel
1,3
and Karen B King
1,3,4
1
Department of Bioengineering, University of California, Berkeley, 459 Evans Hall #1762 Berkeley, CA 94720-1762, USA
2
Department of Radiology, University of California, San Francisco, 1700 4th Street, Suite 203, Box 2520, San Francisco, CA 94107, USA
3
Department of Medicine, Division of Occupational Medicine, University of California, San Francisco, Building 30, 5th floor, San Francisco General
Hospital, 1001 Potrero Avenue, San Francisco, CA 94110, USA
4
Department of Orthopaedics, Division of Bioengineering, University of Colorado at Denver and Health Sciences Center, 12800 E. 19th Ave., RC1
N, Room 2103, Mailstop 8343, PO Box 6511, Aurora, CO 80045, USA
Corresponding author: Karen B King,
Received: 16 Jun 2006 Revisions requested: 27 Jul 2006 Revisions received: 18 Aug 2006 Accepted: 6 Sep 2006 Published: 6 Sep 2006
Arthritis Research & Therapy 2006, 8:R147 (doi:10.1186/ar2040)
This article is online at: />© 2006 Saadat et al.; licensee BioMed Central Ltd.
This is an open access article distributed under the terms of the Creative Commons Attribution License ( />),
which permits unrestricted use, distribution, and reproduction in any medium, provided the original work is properly cited.
Abstract
Understanding the changes in collagen and proteoglycan
content of cartilage due to physical forces is necessary for
progress in treating joint disorders, including those due to
overuse. Physical forces in the chondrocyte environment can
affect the cellular processes involved in the biosynthesis of
extracellular matrix. In turn, the biomechanical properties of
cartilage depend on its collagen and proteoglycan content. To
understand changes due to physical forces, this study examined
the effect of 80 cumulative hours of in vivo cyclical joint loading
on the cartilage content of proteoglycan and collagen in the
rabbit metacarpophalangeal joint. The forepaw digits of six
anesthetized New Zealand White adult female rabbits were
repetitively flexed at 1 Hz with an estimated joint contact
pressure of 1 to 2 MPa. Joints were collected from loaded and
contralateral control specimens, fixed, decalcified, embedded,
and thin-sectioned. Sections were examined under polarized
light microscopy to identify and measure superficial and mid
zone thicknesses of cartilage. Fourier Transform Infrared
microspectroscopy was used to measure proteoglycan and
collagen contents in the superficial, mid, and deep zones.
Loading led to an increase in proteoglycan in the cartilage of all
six rabbits. Specifically, there was a 46% increase in the
cartilage deep zone (p = 0.003). The collagen content did not
change with loading. Joint loading did not change the superficial
and mid zone mean thicknesses. We conclude that long-term
(80 cumulative hours) cyclical in vivo joint loading stimulates
proteoglycan synthesis. Furthermore, stimulation is localized to
cartilage regions of high hydrostatic pressure. These data may
be useful in developing interventions to prevent overuse injuries
or in developing therapies to improve joint function.
Introduction
Extracellular matrix composition dictates the mechanical prop-
erties of cartilage. Proteoglycan and collagen are two impor-
tant structural components of the cartilage extracellular matrix
[1,2]. The highly anionic glycosaminoglycan (GAG) compo-
nent of proteoglycan provides hydration and swelling pressure
to the tissue and enables it to resist compressive forces. The
difference between the ionic composition of the cartilage
matrix and the cartilage interstitial fluid gives rise to the
osmotic pressure that is always present in the extracellular
matrix, even in cartilage that is unloaded [3]. Specifically, the
negative fixed charges on the GAGs control the concentration
of mobile ions in cartilage [4]. Because an increase in the con-
centration of mobile ions increases the hydrostatic pressure of
cartilage, there is a direct relation between fixed charged den-
sity and the mechanical properties of cartilage, particularly
stiffness [5]. Collagen fibrils confine the proteoglycan expan-
sion and provide the extracellular matrix with tensile strength
[6,7].
Cartilage is a non-homogeneous tissue. It can be divided into
three distinct zones based on collagen fibril orientation [8].
FDP = flexor digitorum profundus; FTIR = Fourier Transform Infrared; GAG = glycosaminoglycan; MCP = metacarpophalangeal; PLM = polarized
light microscopy; ROI = region of interest; SD = standard deviation.
Arthritis Research & Therapy Vol 8 No 5 Saadat et al.
Page 2 of 8
(page number not for citation purposes)
The superficial zone is characterized with the fibrils aligned
tangentially to the surface, the mid zone shows random align-
ment, whereas the deep zone contains fibrils that are oriented
perpendicularly to the surface [9]. The distribution of prote-
oglycan and collagen varies with depth in different cartilage
zones and is responsible for the load-carrying capability of car-
tilage. Remodeling of cartilage, as well as degradation of pro-
teoglycans and/or the collagen fibrils, not only alters the
chemical makeup of cartilage but also changes its mechanical
properties. The cellular processes involved can be affected by
physical forces in the chondrocyte environment as demon-
strated by studies that have examined the biosynthetic
response of articular cartilage explants to in vitro loading [10-
14]. However, the biosynthetic response of cartilage to physi-
ological loading within intact joints is not clear.
To investigate this response, we have developed a rabbit
model of in vivo cyclical joint loading [15]. After chronic expo-
sure (80 cumulative hours), loaded joints were prepared as
thin sections to evaluate localization of extracellular matrix
changes. The thicknesses of specific cartilage zones were
measured with polarized light microscopy (PLM), which uses
the birefringence of collagen to visualize fiber alignment [9].
Changes in chemical composition in the superficial, mid, and
deep zones were examined using Fourier Transform Infrared
(FTIR) microspectroscopy. FTIR microspectroscopy is a novel
non-destructive method for visualizing the spatial distribution
and the amount of chemical constituents in thin tissue sections
[16]. Absorption peaks in an infrared spectrum represent a fin-
gerprint of the sample under study. Infrared spectroscopy
combined with microscopy can yield molecular information at
the microscopic level. Our hypothesis is that physiologic, in
vivo cyclical joint loading alters the regional chemical compo-
sition of cartilage, specifically proteoglycan.
Materials and methods
Joint loading
A novel in vivo rabbit model of repetitive joint flexion and load-
ing was developed to simulate hand activities associated with
the workplace [15]. All procedures received prior approval and
oversight from the University of California's Care and Use of
Animals Committee and institutional approval. The digits of
adult female New Zealand White rabbits (n = 6) were repeti-
tively flexed and loaded. Loading was performed with the rab-
bits under anesthesia. A Grass-Telefactor stimulator (Grass
Technologies, West Warwick, RI, USA) was used to excite the
flexor digitorum profundus (FDP) muscle of the experimental
limb at 1 Hz, causing the digits to flex. A light-weight finger cuff
was attached to the third digit and connected to a load cell.
The stimulator voltage was adjusted to achieve an equivalent
to 17.5% of the maximum muscle force of this type and size of
rabbit (preliminary data, n = 4 rabbits). This stimulation setting
resulted in the load cell measurement of 0.42 N peak force at
the third digit tip. Applying free-body analysis to our cyclical
joint loading protocol, we estimated that the joint contact force
is approximately 3 N and the 'nominal' joint contact pressure is
between 1 and 2 MPa. Loading was carried out for 80 cumu-
lative hours in 2-hour increments, 3 days a week for 14 weeks.
The contra-lateral limb (control) was neither stimulated nor
loaded.
Once the loading was completed, the rabbits were euthanized
and the metacarpophalangeal (MCP) joints of both limbs were
removed, fixed in formalin, decalcified, embedded in paraffin,
and sectioned in the sagittal plane. One section (7 µm) from
Table 1
Proteoglycan content in cartilage of cyclically loaded rabbit
metacarpophalangeal joints and their contra-lateral controls
Rabbit no. Control PG
a
(absorbance)
Loaded PG
(absorbance)
Difference
1 2.1 7.0 4.9
2 2.1 2.6 0.5
3 6.5 10.3 3.8
4 5.2 6.5 1.3
5 4.6 6.0 1.4
6 6.3 6.9 0.6
Mean 4.4 6.5 2.1
SD 1.9 2.4 1.8
Significance
b
0.03
a
PG content was measured as the mean integrated PG peak (1,185
- 960 cm
-1
) value from the Fourier Transform Infrared spectra;
b
statistical significance was calculated using the two-tailed, paired
Student t test (α = 0.05). PG, proteoglycan; SD, standard deviation.
Table 2
Collagen content in the cartilage of cyclically loaded rabbit
metacarpophalangeal joints and their contra-lateral controls
Rabbit no. Control
collagen
a
(absorbance)
Loaded
collagen
(absorbance)
Difference
1 37.8 31.8 -6.0
2 29.8 28.2 -1.6
3 31.1 33.0 1.9
4 42.6 38.3 -4.3
5 31.0 32.1 1.1
6 39.5 37.5 -2.0
Mean 35.3 33.5 -1.8
SD 5.3 3.8 3.0
Significance
b
>0.05
a
Collagen content was measured as the mean integrated collagen
peak (1,710 - 1,595 cm
-1
) value from the Fourier Transform Infrared
spectra;
b
statistical significance was calculated using the two-tailed,
paired Student t test (α = 0.05). SD, standard deviation.
Available online />Page 3 of 8
(page number not for citation purposes)
each joint was placed onto an infrared-reflecting microscope
slide (MirrIR low-e microscope slides; Kevley Technologies,
Chesterland, OH, USA) for FTIR analyses. Three sections from
each joint were placed onto Starfrost slides (Fisher Scientific
International, Hampton, NH, USA) for PLM.
FTIR analyses
The FTIR data were collected at 16-cm
-1
resolution using a
mid-infrared Michelson-type step-scan interferometer (Ther-
moNicolet 870; Thermo Electron Corporation, Waltham, MA,
USA) coupled to an ImageMax infrared microscope (Thermo
Electron Corporation) with a 64 × 64-pixel mercury cadmium
telluride focal plane array detector [17] under N
2
purge. All
FTIR imaging was carried out at the Musculoskeletal and
Quantitative Imaging Research Center, University of California
(San Francisco, CA, USA). Information on the amounts and
distribution of proteoglycan and collagen was collected in a
200 × 100 µm region of interest (ROI). The 100-µm depth
was found previously to cover the entire uncalcified cartilage
of the rabbit MCP joint [15]. The FTIR images were baseline-
subtracted and background-corrected. A standard paraffin
spectrum was subtracted from the spectra to account for any
changes in the spectra due to the embedding medium. The
paraffin spectrum was collected from a 7-µm-thick section of
the same paraffin as used in the embedding medium. The
amount of proteoglycan was measured as the mean integrated
area of the sugar peak (1,185 - 960 cm
-1
) in the ROI defined
above for each FTIR image [18]. The amount of collagen was
measured as the mean integrated area of the amide I peak
(1,710 - 1,595 cm
-1
) in the same ROIs [18]. All FTIR data
processing was performed using the Isys software package
version 2.1 R1247 (Spectral Dimensions, Inc., Olney, MD,
USA).
Polarized light microscopy
Sections on slides for PLM were immersed in xylene for three
cycles of 5 minutes each at 20°C to remove paraffin, which
interferes with analysis. The sections were unstained and cov-
ered with a coverslip using xylene-based mounting medium
(Cytoseal; Richard-Allan Scientific, Kalamazoo, MI, USA).
Data were collected using a light microscope fitted with polar-
izers (Axioskop2; Carl Zeiss, Göttingen, Germany) and con-
nected to a digital CCD (charge-coupled device) camera
(Axiocam; Carl Zeiss). Specimens were transilluminated by
polarized light. A × 20 objective was used for digital image
collection. Axiovision software version 3.1 (Carl Zeiss) was
used for camera control and digital image collection. During
data collection, the joint articular surface for each section was
aligned 45° to the polarizer axis to achieve a maximum in light
intensity which is dependent upon the angle of the specimen
relative to the axis of the cross polarizers. Digital images were
captured. The superficial and mid zone mean thicknesses of
rabbit MCP cartilage were measured in a 300 × 100 µm ROI
positioned on the palmar surface of the metacarpal bone, a
location used for previous studies [15]. The superficial and
mid zones were outlined manually, and the areas of the zones
were measured. The mean thicknesses for the superficial and
mid zones were calculated as the area divided by the width.
Proteoglycan distribution
Zonal variation of the amounts of proteoglycan and collagen
was determined. Using the data from PLM, thicknesses corre-
sponding to the superficial, mid, and deep zones were
assigned to each FTIR dataset. Based on PLM analysis, the
Table 3
Normalized proteoglycan content in the cartilage of cyclically
loaded rabbit metacarpophalangeal joints and their contra-
lateral controls
Rabbit no. Normalized
a
PG
content (control)
Normalized PG
content (loaded)
Difference
1 0.05 0.22 0.17
2 0.07 0.09 0.02
3 0.21 0.31 0.10
4 0.12 0.17 0.05
5 0.14 0.18 0.04
6 0.16 0.18 0.02
Mean 0.12 0.19 0.07
SD 0.06 0.07 0.06
Significance
b
0.03
a
The normalized values were obtained by dividing the value of PG
content from each joint by the value of the collagen content of that
joint;
b
statistical significance was calculated using the two-tailed,
paired Student t test (α = 0.05). PG, proteoglycan; SD, standard
deviation.
Table 4
Zone thicknesses of articular cartilage in cyclically loaded
rabbit metacarpophalangeal joints and their contra-lateral
controls
Superficial zone thickness (µm) Mid zone thickness (µm)
Rabbit no. Control Loaded Difference Control Loaded Difference
1 8.8 9.7 0.9 51.3 55.9 4.6
2 7.9 8.9 1.0 38.2 40.7 2.5
3 10.0 9.0 -1.1 50.3 49.6 -0.7
4 7.1 8.7 1.5 51.7 34.7 -17.0
5 7.5 8.5 1.0 38.5 40.9 2.4
6 7.2 5.0 -2.3 34.1 52.4 18.4
Mean 8.1 8.3 0.2 44.0 45.7 1.7
SD 1.1 1.7 1.5 7.9 8.1 11.3
Significance
a
>0.05 >0.05
a
Significance was calculated using the two-tailed, paired Student t test
(α = 0.05). SD, standard deviation.
Arthritis Research & Therapy Vol 8 No 5 Saadat et al.
Page 4 of 8
(page number not for citation purposes)
superficial zone was designated from the joint surface (at 0
µm) to 8 µm from the joint surface. The mid zone was from 8
to 53 µm, and the deep zone was from 53 to 100 µm [9]. The
amounts of proteoglycan and collagen were calculated for
each cartilage zone.
Statistical analyses
To identify changes with loading in the biochemical content of
cartilage, the outcome measures were mean integrated value
of total proteoglycan in the full cartilage thickness and mean
integrated value of total collagen in the full cartilage thickness.
To identify changes with loading in the zonal thickness, the
outcome measures were cartilage superficial zone mean thick-
ness and cartilage mid zone mean thickness. To identify depth-
specific changes in proteoglycan due to loading, the outcome
measures were mean integrated value of proteoglycan in the
superficial zone of cartilage, mean integrated value of prote-
oglycan in the mid zone of cartilage, and mean integrated value
of proteoglycan in the deep zone of cartilage.
Two-tailed, paired Student t tests were used to compare con-
trol and loaded specimens (Sigma Plot version 8.1; Systat
Software, Inc., Richmond, CA, USA). The statistical signifi-
cance level alpha (α) was 0.05.
Results
Proteoglycan and collagen content in the total
uncalcified cartilage
The amount of proteoglycan increased in the loaded joint com-
pared with the control joint for all six rabbits (Table 1). The
mean (± standard deviation [SD]) of integrated proteoglycan
peak values of the control joints was 4.4 (± 1.9), which
increased to 6.5 (± 2.4) for the loaded joints (p = 0.03). The
mean percentage increase in proteoglycan due to loading was
64%; the median was 29.5%. A control rabbit was housed
under identical conditions but without FDP stimulation or
anesthesia. No difference in the amount of proteoglycan was
observed between right and left joints of the limbs of this con-
trol rabbit (data not shown).
Collagen content was also measured using FTIR (Table 2).
The mean (± SD) of integrated collagen peak values of the
control joints was 35.3 (± 5.3) and for the loaded joints was
33.5 (± 3.8); the difference was not significant (p = 0.20).
The amount of proteoglycan in each ROI was normalized to
the collagen content (Table 3). The mean (± SD) of normalized
proteoglycan of the control joints was 0.12 (± 0.06), which
increased to 0.19 (± 0.07) for the loaded joints, a statistically
significant difference (p = 0.03). The mean percentage
increase in normalized proteoglycan due to loading was 83%;
the median was 35%. There was no difference between the
right and left limbs of the non-treated control rabbit after nor-
malizing to collagen.
Superficial and mid zone thicknesses
The superficial and mid zone thicknesses of rabbit MCP joint
cartilage were measured using PLM (Figure 1; Table 4). The
mean (± SD) superficial zone thicknesses for the control and
loaded joints were 8.11 µm (± 1.2) and 8.3 µm (± 1.7),
respectively. The mean (± SD) mid zone thicknesses for the
control and loaded joints were 44.03 µm (± 7.9) and 45.72
µm (± 8.2), respectively. There were no statistically significant
differences between the thicknesses of the control versus the
loaded joints for the superficial (p = 0.77) and mid (p = 0.73)
zones.
Zonal variation of proteoglycan
Mean zone thicknesses were applied to the FTIR maps to
measure the zonal variation of proteoglycan (Figure 2). The
mean (± SD) of integrated proteoglycan peak values (normal-
ized to collagen content) of the control joints in the superficial
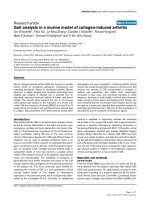
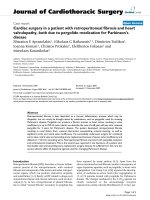
Figure 1
Microscopic images of joint cartilage from region of interestMicroscopic images of joint cartilage from region of interest. (a) Rabbit
MCP joint sections were stained with iron hematoxylin, safranin O, and
fast green. This combination of stains identifies the uncalcified cartilage
(red), calcified cartilage (dark red), and bone (blue-green). The tidemark
(arrow) is apparent and marks the division between the uncalcified and
calcified cartilage. (b) Unstained sections were imaged under polarized
light microscopy. The superficial zone is indicated by the two arrows at
the articular surface. The bracket encloses the mid zone, which due to
the anisotropic arrangement of collagen fibers does not exhibit birefrin-
gence. Bars = 100 µm.
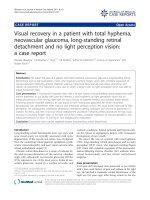
Figure 2
Representative Fourier Transform Infrared maps of proteoglycan in the unloaded and loaded joints of one rabbitRepresentative Fourier Transform Infrared maps of proteoglycan in the
unloaded and loaded joints of one rabbit. The superficial zone was des-
ignated from the joint surface (at 0 µm) to 8 µm from the joint surface.
The mid zone was from 8 to 53 µm, and the deep zone was from 53 to
100 µm. Each image is 100 µm deep and 200 µm wide. Integrated
proteoglycan peak absorbance values are pseudo-colored; red indi-
cates that more proteoglycan is present and blue indicates that less
proteoglycan is present. These maps were typical of all rabbits.
Available online />Page 5 of 8
(page number not for citation purposes)
zone of cartilage was 0.16 (± 0.09) and was 0.18 (± 0.10) for
the loaded joints. The difference between the control and
loaded superficial zone proteoglycans was not significant (p =
0.60). In the mid zone, the mean (± SD) of integrated prote-
oglycan peak values (normalized to collagen content) of the
control joints was 0.14 (± 0.06) and 0.20 (± 0.09) for the
loaded joints. The difference between the control and loaded
mid zone proteoglycan was not significant (p = 0.20).
However, in the deep zone, the amount of proteoglycan
increased significantly with loading (p = 0.003). The mean (±
SD) of integrated proteoglycan peak values of the control
joints (normalized to collagen content) was 0.11 (± 0.07) and
0.17 (± 0.07) for the loaded joints. In all six rabbits, deep zone
proteoglycan increased with loading. The mean of percentage
increase in deep zone proteoglycan between control and
loaded joints was 76%; the median was 46% (Table 5).
Discussion
This is the first study to measure an increase in proteoglycan
content due to physiologic in vivo cyclical joint loading. Using
microscopic FTIR spectroscopy, we demonstrate that the
increase of proteoglycan is localized to the deep zone of car-
tilage, indicating that 80 cumulative hours of physiological joint
loading leads to stimulation of proteoglycan synthesis in a spa-
tially specific manner.
A number of in vitro studies have measured the metabolic
effects of cartilage loading using unconfined compression
[10-14,19]. Sah et al. [10], Larsson et al. [11], and Parkkinen
et al. [19] have observed increased proteoglycan biosynthesis
in bovine articular cartilage explants with dynamic compres-
sion. In contrast, others have found a decrease in proteoglycan
biosynthesis with unconfined compression in vitro [12-14].
These difference can be attributed to both the stimulatory
effects (fluid pressure, convective transport) [20,21] and
inhibitory effects (matrix consolidation due to large strains)
that occur in unconfined compression [14]. Although com-
pressive loading of cartilage explants provides valuable
insights, it does not model true load-carrying in physiologic
joint function. From in vitro experiments, it has been proposed
that stimulation of proteoglycan synthesis is associated with
tissue regions having high interstitial fluid flow [22]. However,
the fluid flow and lateral expansion of the cartilage in vivo are
limited by the surrounding cartilage and bone [23], and it is the
pressurization of the interstitial fluid due to these boundaries
that exerts the effective load on cartilage [24,25]. Ikenoue et
al.[26] have demonstrated increased aggrecan expression
and synthesis in high-density cultures of human chondrocytes
that received intermittent hydrostatic pressure of 1, 5, or 10
MPa at 1 Hz. They also demonstrate increased expression of
type II collagen; however, collagen protein increased only at
high pressure, 10 MPa, and weakly at 5 MPa. The findings of
the low-pressure experiments by Ikenoue et al.[26] are most
relevant to the present study because we estimate that the
hydrostatic pressure generated within the deep zone of the
MCP joints in our experiments is approximately 1 to 2 MPa.
Our findings support the hypothesis that increased levels of
fluid pressure stimulate proteoglycan biosynthesis.
In our study, the increase in proteoglycans was localized to the
deep zone of cartilage. This is in agreement with a previous
finding in vitro [27] in which proteoglycan synthesis increased
by 102% to 114% in the deep zone after 4 hours of dynamic
unconfined loading. The same study, however, found that the
stimulatory effect was decreased after 8 hours. This loss of
effect may be due to the loss of hydrostatic pressure over time.
With unconfined compression in vitro, the fluid can flow out
Table 5
Zonal distribution of proteoglycan
Normalized PG in superficial zone
a
Normalized PG in mid zone
b
Normalized PG in deep zone
c
Rabbit no. Control Loaded Difference Control Loaded Difference Control Loaded Difference
1 0.140.200.060.060.290.230.030.110.08
2 0.05 0.01 -0.04 0.09 0.06 -0.02 0.06 0.09 0.03
3 0.270.330.060.220.310.090.190.280.09
4 0.27 0.18 -0.08 0.13 0.19 0.05 0.07 0.14 0.07
5 0.18 0.17 -0.01 0.17 0.16 -0.01 0.14 0.18 0.04
6 0.060.170.110.150.150.000.180.220.04
Mean 0.16 0.18 0.02 0.14 0.20 0.06 0.11 0.17 0.06
SD 0.09 0.10 0.07 0.06 0.09 0.10 0.07 0.07 0.03
Significance
d
>0.05 >0.05 0.003
a
Superficial zone of cartilage is from 0 to 8 µm;
b
mid zone is from 8 to 53 µm;
c
deep zone is from 53 to 100 µm; the zone thicknesses were
determined by polarized light microscopy;
d
significance was calculated using the two-tailed, paired Student t test (α = 0.05). PG, proteoglycan;
SD, standard deviation.
Arthritis Research & Therapy Vol 8 No 5 Saadat et al.
Page 6 of 8
(page number not for citation purposes)
from the explant edges, and this may lead to lower hydrostatic
pressure and thus lower proteoglycan production than exists
in vivo under the same frequencies and amplitudes of loading.
Our results support the proposed hypothesis that high hydro-
static pressure as produced in cyclical joint loading promotes
matrix synthesis in cartilage [28]. Aggrecan gene expression
may be upregulated by the hydrostatic pressure of physiologic
range that is exerted by cyclical in vivo loading in the deep
zone of cartilage. The deep zone of cartilage is loaded primarily
under hydrostatic pressure and experiences little fluid flow in
vivo [29]. Studies by Hall et al. [30] and Parkkinen et al. [19]
demonstrate in vitro that hydrostatic pressure increases prote-
oglycan synthesis in cartilage explants. Chondrocytes are the
sole regulators of cartilage biosynthetic activity and respond to
external mechanical stimuli such as hydrostatic pressure and
fluid shear [10,28,31]. Stretch-activated ion channels might
be part of the transduction pathway of repetitive forces
[32,33]. We hypothesize that the increase in proteoglycan in
the cartilage deep zone is due to the localized increase in
hydrostatic pressure caused by cyclical in vivo loading that
leads to signal transduction within the resident chondrocytes.
Our experiment is long-term (>3 months), and therefore we
expect all components of proteoglycan synthesis to have been
upregulated. For example, the genes required for aggrecan
synthesis and post-translational modification include the pro-
tein core [34], xylosyl tranferase [35], and sulfotransferases
[36]. Recently, the transcription rates of genes for
sulfotransferases C4ST1, C4ST2, and C6ST1 all have been
shown to increase with in vitro dynamic compression [37].
With FTIR microscpectroscopy, no significant change in the
amount of collagen is found with 80 hours of cumulative
loading. However, this is expected given the extremely long
half-life (200 to 400 years) reported for cartilage collagen
[38]. The turnover rate of collagen is much slower than that of
aggrecan [39,40]. It should be noted, however, that alterations
to the collagen network organization may have occurred with-
out changes in the amount of collagen after loading. Arokoski
et al. [41] observed that, although joint loading through long-
distance running in dogs generally did not significantly change
the thickness of cartilage zones, birefringence intensity
decreased in the superficial zone; the authors attributed this
decrease to a localized loss of collagen network organization.
Because we were unable to measure birefringence intensity,
we cannot make detailed conclusions on collagen network
organization in this study.
Our study does not determine the minimum number of hours
of loading required to detect an increase in proteoglycan, nor
whether this increase is sustained, because all joints were
loaded for 80 cumulative hours and a study with multiple time
points would be required. Also, because a single loading pat-
tern was used, we cannot draw conclusions about the effect
of in vivo loading on proteoglycan at other forces and
frequencies. Future studies will test other durations, peak
forces, and frequencies of in vivo joint loading.
Conclusion
We conclude that cyclical in vivo joint loading increases the
proteoglycan content of the cartilage deep zone via signal
transduction stimulated by increased hydrostatic pressure
(Figure 3). This is clinically significant because the biomechan-
ical properties of cartilage, and therefore its function, depend
to a large extent on its ability to maintain hydration and tissue
thickness under mechanical stresses with normal physiologi-
cal loading. Proteoglycans provide the osmotic resistance
necessary for cartilage to resist compressive loads.
An increase in the amount of cartilage proteoglycan could indi-
cate a healthy mode of joint response to loading in which
chondrocytes detect and respond to changes in their mechan-
ical environment by increasing proteoglycan biosynthesis.
However, the mechanical effect of changing the ratio of prote-
oglycan to collagen was not tested and the contents of other
matrix proteins were not measured. Nonetheless, using our in
vivo joint loading model, we will be able to test different load-
ing patterns to determine thresholds of healthy and damaging
loading. These thresholds would be useful in designing force
and frequency patterns to prevent overuse joint injuries.
Knowledge of the effects of loading patterns may also benefit
tissue engineering strategies and post-surgical rehabilitation.
Competing interests
The authors declare that they have no competing interests.
Figure 3
A proposed mechanism by which cyclical loading leads to changes in articular cartilage mechanical propertiesA proposed mechanism by which cyclical loading leads to changes in articular cartilage mechanical properties. Hydrostatic pressure of cartilage tis-
sue is increased through compression caused by cyclical in vivo joint loading. With loading at physiological frequencies and amplitudes, changes in
cellular signaling pathways lead to a detectable increase in proteoglycan synthesis. Changes in chemical composition of cartilage extracellular matrix
eventually lead to changes in mechanical properties of the tissue in general.
Available online />Page 7 of 8
(page number not for citation purposes)
Authors' contributions
ES carried out the FTIR data acquisition and analysis, per-
formed the statistical analyses, and drafted the manuscript. HL
carried out the PLM data acquisition and analysis and helped
draft the manuscript. SM provided FTIR equipment and
expertise and helped edit the manuscript. DR assisted with the
in vivo model and helped edit the manuscript. KK conceived of
and supervised the project, supervised all data collection and
analysis, and edited the manuscript. All authors read and
approved the final manuscript.
Acknowledgements
The authors thank Yuka Nakamura for animal handling, Alex Portnoy for
tissue sectioning, and Andrew Burghardt for assistance with the FTIR
techniques. This work was supported by the Centers for Disease Con-
trol and Prevention, National Institute of Occupational Safety and Health
(grant no. OH007786 to KK); National Institutes of Health, National
Institute on Aging (grant no. AG17762 to SM); and the University of Cal-
ifornia, Berkeley Summer Bioengineering Research Program (to ES).
References
1. Carney SL, Muir H: The structure and function of cartilage
proteoglycans. Physiol Rev 1988, 68:858-910.
2. Eyre D: Collagen of articular cartilage. Arthritis Res 2002,
4:30-35.
3. Urban JP, Maroudas A, Bayliss MT, Dillon J: Swelling pressures
of proteoglycans at the concentrations found in cartilaginous
tissues. Biorheology 1979, 16:447-464.
4. Maroudas A, Muir H, Wingham J: The correlation of fixed nega-
tive charge with glycosaminoglycan content of human articular
cartilage. Biochim Biophys Acta 1969, 177:492-500.
5. Kempson GE, Muir H, Swanson SA, Freeman MA: Correlations
between stiffness and the chemical constituents of cartilage
on the human femoral head. Biochim Biophys Acta 1970,
215:70-77.
6. Maroudas A, Venn M: Chemical composition and swelling of
normal and osteoarthrotic femoral head cartilage. II. Swelling.
Ann Rheum Dis 1977, 36:399-406.
7. Basser PJ, Schneiderman R, Bank RA, Wachtel E, Maroudas A:
Mechanical properties of the collagen network in human artic-
ular cartilage as measured by osmotic stress technique. Arch
Biochem Biophys 1998, 351:207-219.
8. Aspden RM, Hukins DW: Collagen organization in articular car-
tilage, determined by X-ray diffraction, and its relationship to
tissue function. Proc R Soc Lond B Biol Sci 1981,
212:299-304.
9. Benninghoff A: Form und Bau der Gelenkknorpel in ihren Bez-
iehungen zur Funktion. Erste Mitteilung: Die modellierenden
und formerhaltenden Faktoren des Knorpelreliefs. (Form and
shape of the joint cartilages in their relations with the function.
First report: the modeling and shape-holding factors of the
cartilage relief). Z Gesamte Anatomie Abt 1925, 1:43-64.
10. Sah RL, Kim YJ, Doong JY, Grodzinsky AJ, Plaas AH, Sandy JD:
Biosynthetic response of cartilage explants to dynamic
compression. J Orthop Res 1989, 7:619-636.
11. Larsson T, Aspden RM, Heinegård D: Effects of mechanical load
on cartilage matrix biosynthesis in vitro. Matrix 1991,
11:388-394.
12. Torzilli PA, Grigiene R, Huang C, Friedman SM, Doty SB, Boskey
AL, Lust G: Characterization of cartilage metabolic response to
static and dynamic stress using a mechanical explant test
system. J Biomech 1997, 30:1-9.
13. Steinmeyer J, Knue S: The proteoglycan metabolism of mature
bovine articular cartilage explants superimposed to continu-
ously applied cyclic mechanical loading. Biochem Biophys Res
Commun 1997, 240:216-221.
14. Wong M, Siegrist M, Cao X: Cyclic compression of articular car-
tilage explants is associated with progressive consolidation
and altered expression pattern of extracellular matrix proteins.
Matrix Biol 1999, 18:391-399.
15. King KB, Opel CF, Rempel DM: Cyclical articular joint loading
leads to cartilage thinning and osteopontin production in a
novel in vivo rabbit model of repetitive finger flexion. Osteoar-
thritis Cartilage 2005, 13:971-978.
16. Wetzel DL, LeVine SM: Imaging molecular chemistry with infra-
red microscopy. Science 1999, 285:1224-1225.
17. Lewis EN, Treado PJ, Reeder RC, Story GM, Dowrey AE, Marcott
C, Levin IW: Fourier transform spectroscopic imaging using an
infrared focal-plane array detector. Anal Chem 1995,
67:3377-3381.
18. Camacho NP, West P, Torzilli PA, Mendelsohn R: FTIR micro-
scopic imaging of collagen and proteoglycan in bovine
cartilage. Biopolymers 2001, 62:1-8.
19. Parkkinen JJ, Lammi MJ, Helminen HJ, Tammi M: Local stimulation
of proteoglycan synthesis in articular cartilage explants by
dynamic compression in vitro. J Orthop Res 1992, 10:610-620.
20. Maroudas AI: Balance between swelling pressure and collagen
tension in normal and degenerate cartilage. Nature 1976,
260:808-809.
21. O'Hara BP, Urban JP, Maroudas A: Influence of cyclic loading on
the nutrition of articular cartilage. Ann Rheum Dis 1990,
49:536-539.
22. Buschmann MD, Kim Y-J, Wong M, Frank E, Hunziker EB, Grodzin-
sky AJ: Stimulation of aggrecan synthesis in cartilage explants
by cyclic loading is localized to regions of high interstitial fluid
flow. Arch Biochem Biophys 1999, 366:1-7.
23. Mizrahi J, Maroudas A, Lanir Y, Ziv I, Webber TJ: The "instantane-
ous" deformation of cartilage: effects of collagen fiber orienta-
tion and osmotic stress. Biorheology 1986, 23:311-330.
24. Setton LA, Zhu W, Mow VC: The biphasic poroviscoelastic
behavior of articular cartilage: role of the surface zone in gov-
erning the compressive behavior. J Biomech 1993,
26:581-592.
25. Soltz MA, Ateshian GA: Experimental verification and theoreti-
cal prediction of cartilage interstitial fluid pressurization at an
impermeable contact interface in confined compression. J
Biomech 1998, 31:927-934.
26. Ikenoue T, Trindade MC, Lee MS, Lin EY, Schurman DJ, Goodman
SB, Smith RL: Mechanoregulation of human articular chondro-
cyte aggrecan and type II collagen expression by intermittent
hydrostatic pressure in vitro. J Orthop Res 2003, 21:110-116.
27. Kiraly K, Hyttinen MM, Parkkinen JJ, Arokoski JA, Lapvetelainen T,
Torronen K, Kiviranta I, Helminen HJ: Articular cartilage collagen
birefringence is altered concurrent with changes in proteogly-
can synthesis during dynamic in vitro loading. Anat Rec 1998,
251:28-36.
28. Wong M, Carter DR: Articular cartilage functional histomor-
phology and mechanobiology: a research perspective. Bone
2003, 33:1-13.
29. Carter DR, Beaupre GS, Wong M, Smith RL, Andriacchi TP,
Schurman DJ: The mechanobiology of articular cartilage devel-
opment and degeneration. Clin Orthop Relat Res 2004,
427(suppl):S69-77.
30. Hall AC, Urban JP, Gehl KA: The effects of hydrostatic pressure
on matrix synthesis in articular cartilage. J Orthop Res 1991,
9:1-10.
31. Collins-Racie LA, Flannery CR, Zeng W, Corcoran C, Annis-Free-
man B, Agostino MJ, Arai M, DiBlasio-Smith E, Dorner AJ, Georgi-
adis KE, et al.: ADAMTS-8 exhibits aggrecanase activity and is
expressed in human articular cartilage. Matrix Biol 2004,
23:219-230.
32. Chiquet M: Regulation of extracellular matrix gene expression
by mechanical stress. Matrix Biol 1999, 18:417-426.
33. Chiquet M, Fluck M: Early responses to mechanical stress:
from signals at the cell surface to altered gene expression. In
Protein Adaptations and Signal Transduction Edited by: Storey K,
Storey J. Amsterdam: Elsevier; 2001:97-110.
34. Valhmu WB, Palmer GD, Rivers PA, Ebara S, Cheng JF, Fischer S,
Ratcliffe A: Structure of the human aggrecan gene: exon-intron
organization and association with the protein domains. Bio-
chem J 1995, 309(Pt 2):535-542.
35. Gotting C, Kuhn J, Zahn R, Brinkmann T, Kleesiek K: Molecular
cloning and expression of human UDP-d-Xylose:proteoglycan
core protein beta-d-xylosyltransferase and its first isoform XT-
II. J Mol Biol 2000, 304:517-528.
Arthritis Research & Therapy Vol 8 No 5 Saadat et al.
Page 8 of 8
(page number not for citation purposes)
36. Kusche-Gullberg M, Kjellen L: Sulfotransferases in gly-
cosaminoglycan biosynthesis. Curr Opin Struct Biol 2003,
13:605-611.
37. Szafranski JD, Grodzinsky AJ: The effects of mechanical defor-
mation, tissue age, and culture duration on the transcription of
the chondroitin sulfate biosynthesis associated transcription
enzymes in a bovine cartilage explants. Osteoarthritis Cartilage
2005, 13A:S21.
38. Maroudas A, Palla G, Gilav E: Racemization of aspartic acid in
human articular cartilage. Connect Tissue Res 1992,
28:161-169.
39. Bank RA, Bayliss MT, Lafeber FP, Maroudas A, Tekoppele JM:
Ageing and zonal variation in post-translational modification
of collagen in normal human articular cartilage. The age-
related increase in non-enzymatic glycation affects
biomechanical properties of cartilage. Biochem J 1998, 330(Pt
1):345-351.
40. Maroudas A, Bayliss MT, Uchitel-Kaushansky N, Schneiderman R,
Gilav E: Aggrecan turnover in human articular cartilage: use of
aspartic acid racemization as a marker of molecular age. Arch
Biochem Biophys 1998, 350:61-71.
41. Arokoski JP, Hyttinen MM, Lapvetelainen T, Takacs P, Kosztaczky
B, Modis L, Kovanen V, Helminen H: Decreased birefringence of
the superficial zone collagen network in the canine knee (sti-
fle) articular cartilage after long distance running training,
detected by quantitative polarised light microscopy. Ann
Rheum Dis 1996, 55:253-264.