Báo cáo y học: "Gait analysis in a murine model of collagen-induced arthritis" ppsx
Bạn đang xem bản rút gọn của tài liệu. Xem và tải ngay bản đầy đủ của tài liệu tại đây (949.01 KB, 7 trang )
Open Access
Available online />Page 1 of 7
(page number not for citation purposes)
Vol 9 No 6
Research article
Gait analysis in a murine model of collagen-induced arthritis
Jon Vincelette
1
, Yifan Xu
1
, Le-Ning Zhang
1
, Caralee J Schaefer
1
, Ronald Vergona
1
,
Mark E Sullivan
1
, Thomas G Hampton
2
and Yi-Xin (Jim) Wang
1
1
Bayer HealthCare Pharmaceuticals, 800 Dwight Way, Berkeley, CA 94701, USA
2
Mouse Specifics, Inc., 28 State St., Suite 1112, Boston, MA 02109, USA
Corresponding author: Le-Ning Zhang,
Received: 12 Sep 2007 Revisions requested: 8 Oct 2007 Revisions received: 4 Nov 2007 Accepted: 24 Nov 2007 Published: 24 Nov 2007
Arthritis Research & Therapy 2007, 9:R123 (doi:10.1186/ar2331)
This article is online at: />© 2007 Vincelette et al.; licensee BioMed Central Ltd.
This is an open access article distributed under the terms of the Creative Commons Attribution License ( />),
which permits unrestricted use, distribution, and reproduction in any medium, provided the original work is properly cited.
Abstract
Murine collagen-induced arthritis (CIA) has become a valuable
animal model for elucidating pathogenic mechanisms and
evaluating therapeutic effects for rheumatoid arthritis. Recent
advances in digital imaging and computer technology have
enabled gait analysis to develop into a powerful tool for
objectively detecting functional deficits in human and animal
models. The present study explored the use of non-invasive
video-capture gait analysis in the evaluation of a murine CIA
model. CIA was induced in 45 female DBA/1LacJ mice (8 to 10
weeks old) by immunization with lyophilized bovine articular type
II collagen. Gait parameters were determined by ventral plane
videography and were correlated to traditional arthritis clinical
scores. Our results showed that increases in clinical scores that
measure the severity of CIA corresponded to changes in
multiple gait parameters that reflect both morphologic
(increases in paw area) and functional (increase in stride
frequency, decrease in stride length, hind-limb paw placement
angle, as well as stride, stance, and braking times) deficits. Our
work indicated that the non-invasive video-capture device may
be used as a simple and objective data acquisition system for
quantifying gait disturbances in CIA mice for the investigation of
mechanisms and the evaluation of therapeutic agents.
Introduction
Rheumatoid arthritis (RA) is an autoimmune disease charac-
terized by chronic inflammation in the limbs and joints, cyclic
progressive cartilage and bone destruction, and severe disa-
bility [1]. The disease has a prevalence of 1% in the adult pop-
ulation worldwide, making RA one of the most common
chronic inflammatory diseases [1]. Although different types of
treatment can be used to alleviate symptoms, there is no
known cure for RA. Further research to understand the patho-
genic mechanisms and to develop novel therapeutics, there-
fore, is necessary [2,3]. Collagen-induced arthritis (CIA) in
susceptible strains of mice has become a valuable animal
model in RA research because of its simplicity, rapid disease
onset, and reproducibility. The availability of transgenic or
gene-deficient mice further enhances the power of the CIA
mouse model for the investigation of the molecular mechanism
of the disease [4]. The most commonly used method for
assessing the severity of CIA is a semi-quantitative clinical
scoring system based on the degree of inflammatory
responses in the paws and joints, which is subjectively deter-
mined by the investigator [5-10]. Currently, no established
method is available to objectively evaluate the functional
abnormality in the mouse CIA model. Gait analysis has been
used as a powerful technique in evaluating locomotion in
humans and laboratory animals with RA [11]. Recently, ventral
plane videographic treadmill gait analysis (DigiGait Imaging
System; Mouse Specifics, Inc., Boston, MA, USA) has been
proven as a simple, sensitive, and objective method for detect-
ing the gait abnormalities in amyotrophic lateral sclerosis [12]
and in Parkinson and Huntington diseases [13] in mice. There-
fore, the aim of this study was to evaluate the novel 'objective'
gait analysis system in relation to the traditional 'subjective'
clinical scoring system in a mouse model of CIA.
Materials and methods
Animal model
Forty-five female DBA/1LacJ mice, 8 to 10 weeks old (20 g),
were obtained from The Jackson Laboratory (Bar Harbor, ME,
USA) and group-housed. All experimental procedures were
conducted according to a protocol approved by the Institu-
tional Animal Care and Use Committee. Lyophilized bovine
articular type II collagen (purchased from Marie Griffiths, Uni-
CIA = collagen-induced arthritis; RA = rheumatoid arthritis.
Arthritis Research & Therapy Vol 9 No 6 Vincelette et al.
Page 2 of 7
(page number not for citation purposes)
versity of Utah, Salt Lake City, UT, USA) was dissolved in 0.01
N acetic acid (2 mg/mL) and kept at 4°C for 24 hours prior to
immunization. The type II collagen was mixed with an equal vol-
ume of Freund's complete adjuvant (4 mg/mL; Chondrex, Inc.,
Redmond, WA, USA) on ice, using cold tuberculin syringes
and a three-way stopcock. Each mouse was weighed and
injected intradermally at the base of the tail with 0.1 mL of
emulsion containing 100 μg collagen, using a 1-mL glass
tuberculin syringe with a 26-guage needle.
Clinical scores
The severity of arthritis was scored based on the level of
inflammation in each of the four paws and recorded as one of
four grades: 0, no symptoms; 1, erythema and edema; 2, joint
distortion; and 3, joint ankylosis [5,8]. The average score for
each animal was determined by summating the score of all
individual limbs and dividing by 4. The clinical score was eval-
uated weekly over the course of 10 weeks by an experienced
investigator who was blinded to experimental groups. To avoid
the interruption of the natural progress of the disease by intro-
ducing the animals to treadmill walking, a baseline gait analysis
was performed only at week 3 following immunization before
disease symptoms became evident (clinical score = 0), and an
endpoint was taken at the conclusion of the 10-week study
when disease severity was high. To analyze the correlation
between the clinical score and gait parameters, the individual
animals or limbs were further grouped by the severity of the
disease measured at the end of the experiment, with average
clinical scores of less than or equal to 1 designated as 'mild',
less than or equal to 2 as 'moderate', and less than or equal to
3 as 'severe'.
Gait analysis
Analysis of the ambulatory gait of mice was quantified using
the DigiGait Imaging System (Mouse Specifics, Inc.). This sys-
tem enables mice to walk on a motorized transparent treadmill
belt, below which a video camera is mounted to capture the
image of the ventral side of the animals. DigiGait automatically
pixelates and vectorizes the ventral view of the subject (Figure
1a). The proprietary software and artificial intelligence algo-
rithms analyze the resulting digital images and define the area
of each paw corresponding to its movement to generate a set
of periodic waveforms that describe the advance and retreat
of the four limbs relative to the treadmill belt through consecu-
tive strides (Figure 1b). The software automatically identifies
the portions of the paw that are in contact with the treadmill
belt as the stance phase of the stride and the portions not in
contact with the treadmill belt as the swing phase of the stride
(Figure 1a). Numerous postural and kinematic metrics of gait
dynamics were determined by dissecting the time each limb is
spent in various portions of the walking phase, including paw
area, paw placement angle during stance, stride length, step-
ping frequency, and stance width, as described in detail in
Table 1.
A range of walking speeds were investigated in a pilot experi-
ment to determine a maximal speed that all animals were able
to 'walk', thereby eliminating differences in self-selected
speeds as the most important confounder in the interpretation
of subjects walking over ground. In this study, the treadmill
speed was set at 15 cm/s, at which all of the mice, including
those with severe pathology (average clinical score of greater
than 2), were able to consistently ambulate for at least four
complete strides.
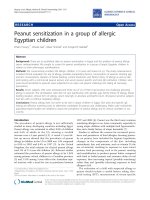
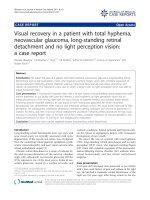
Figure 1
Diagrammatic illustration of gait parametersDiagrammatic illustration of gait parameters. (a) The ventral view of the test mouse. Computer-digitized paw images used to represent stride length,
paw angle, and paw area (left). One complete stride is the summation of the periods in which each paw spends in the phases of stance and swing
(right). The stance phase is further divided into braking and propulsion phases. (b) Screen-captured image of periodic waveforms representing the
advance and retreat of each of four limbs' motion relative to the treadmill belt. LF, left front; LR, left rear; RF, right front; RR, right rear.
Available online />Page 3 of 7
(page number not for citation purposes)
Statistics
All results are presented as the mean ± standard error of the
mean. DigiGait parameters measured at the end of the 10-
week study were compared with the baseline value measured
at week 3 by means of a paired Student t test. Differences
were considered statistically significant when the p value was
less than 0.05.
Results
Clinical score
Animals were evaluated weekly throughout the progressive
phase of arthritis development. The average clinical scores of
animals, which were determined by summating the score of all
individual limbs and dividing by 4, started to increase at week
4 and progressively increased over the 10-week time course
(Figure 2, top). As described in Materials and methods, the
animals were grouped as mild, moderate, and severe based on
the clinical score to analyze the correlation between the clini-
cal score and gait parameters, such as stride frequency and
stance time and so on. The greatest number of animals were
distributed in the mild group (Figure 2, middle). For the param-
eters of paw area and hind-limb stance angle, which provide
information about pathology of the individual limb, each limb
was scored individually and pooled by the severity of the clini-
cal score, regardless of cohort limbs. Similarly, the greatest
number of limbs were distributed in the mild group (Figure 2,
bottom). There was an overall even distribution between fore
and hind limbs, except in the severe group, which did not con-
tain fore limbs.
Gait and posture indices
Paw area and angle
The baseline paw area during stance on week 3 before clinical
evidence of disease was present was 0.67 ± 0.02 cm
2
and
exhibited no evident inflammation. This area progressively
increased in animals with increasing clinical scores (Figure 3,
top). The hind-limb paw angle (the angle of the hind paws dur-
ing peak stance in relation to the long axis of the body and its
direction of motion) showed a baseline value of 11.4 degrees,
which also progressively decreased with increasing clinical
scores, indicating that those paws with greatest swelling
rotated inward during stance to be more parallel with the long
axis of the body (Figure 3, bottom).
Stride parameters
Stride frequency (the average number of times a paw contacts
the belt per second) increased linearly with increasing clinical
score (Figure 4, top). Subsequently, with an increase in stride
frequency at a fixed walking speed (15 cm/s), stride length
(the distance between initial contact of the same paw in a
complete stride) (Figure 4, middle) and stride time (Figure 4,
bottom) progressively decreased with increasing clinical
scores.
Phases of the step cycle
One complete stride for a limb is the summation of the stance
and swing phases (Figure 5). The stance time (the weight-
bearing portion of the stride in which the paw remains in con-
tact with the belt) decreased progressively with increasing
clinical scores. A shorter stance time indicates a briefer period
in which an inflamed paw or limb is weight-bearing. The swing
time (the portion of the stride in which the paw is not in contact
with the belt) also decreased progressively with the increase
in clinical scores. The stance phase is further divided into the
braking and propulsion phases. The braking time (the time
interval between initial and maximal paw contacts with the
belt) decreased significantly from baseline at the end of the
study in animals with greater pathology. The propulsion time
(the period between the stance phases and beginning of the
swing phase when the paw is not in contact with the belt)
decreased progressively with the increasing clinical scores.
Discussion
The present study explored the use of the non-invasive video-
capture gait-analysis instrumentation in the evaluation of a
mouse model of CIA. We demonstrated that postural and kin-
Table 1
Gait indices and descriptions
Gait index Description
Paw area The maximal paw area in contact with the treadmill during the stance phase of the step cycle
Paw angle The angle of the hind paws in relation to the long axis of the body and its direction of motion
Stride frequency The average number of times a paw contacts the treadmill belt per second
Stride length The distance between initial contacts of the same paw in one complete stride
Stride time The amount of time to complete one complete stride for one limb
Stance time The portion of the stride in which the paw remains in contact with the belt
Swing time The forward portion of the stride in which the paw is not in contact with the belt
Braking time The time between initial paw contact with the belt and the maximal paw contact
Propulsion time Time between maximal contact and the end of stance, just prior to swing
Arthritis Research & Therapy Vol 9 No 6 Vincelette et al.
Page 4 of 7
(page number not for citation purposes)
ematic gait disturbances corresponded to clinical scores with
increasing severity of the CIA. CIA mice exhibited increased
paw areas, increased stride frequency, shorter stride length,
relative paw placement inversion, and reduced stride, stance,
braking, swing, and propulsion durations. To the best of our
knowledge, this is the first work seeking to apply comprehen-
sive gait analysis in rodent CIA models.
RA is an autoimmune disease of unknown etiology which leads
to chronic inflammation in the joints and subsequent destruc-
tion of the cartilage and erosion of the bone [1]. The rodent
model of CIA has been proven as a successful animal model
for RA research because it is also an autoimmune model and
in many ways resembles RA, including the chronic inflamma-
tion [4,14]. The primary manifestation of this model is the
inflammation-induced joint swelling [15-17]. Although the
clinical scoring system may give a numerical score corre-
sponding to the degree of inflammation based on the severity
of joint swelling and redness, it provides a semi-quantitative
and subjective assessment. Although the degree of inflamma-
tion and joint swelling can also be determined by measuring
the volume of the paws using a water displacement method in
a rat model of CIA [18,19], this method is less practical in mice
given the small size and volume of the paws. Using DigiGait,
we are able to quantify the maximal paw area in contact with
the treadmill during the stance phase of the step cycle and
demonstrate that the paw area increased with increasing clin-
ical scores. Thus, the paw area measured digitally by DigiGait
is an objective index of tissue swelling and inflammation, which
is superior to other parameters of joint inflammation and swell-
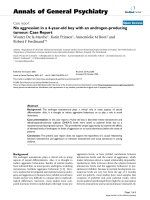
Figure 2
Disease progression over time following collagen immunization as measured by average clinical score of all mice, which was obtained by the summation of the clinical scores of the four limbs in each mouse divided by 4 (top)Disease progression over time following collagen immunization as
measured by average clinical score of all mice, which was obtained by
the summation of the clinical scores of the four limbs in each mouse
divided by 4 (top). Distribution of the total number of mice in corre-
sponding disease severity group (middle). Distribution of the total
number of limbs in corresponding disease severity group, regardless of
the cohort limbs (bottom).
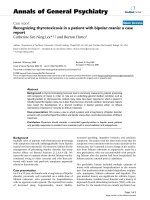
Figure 3
Paw area (top) and hind-limb paw angle (bottom) correspond to dis-ease severity as grouped by clinical score in individual pawsPaw area (top) and hind-limb paw angle (bottom) correspond to dis-
ease severity as grouped by clinical score in individual paws. Paw area
progressively increased, whereas hind-limb paw angle progressively
decreased, with increasing clinical scores in individual paws. Values
are means ± standard error of the mean (p < 0.05 versus baseline).
Available online />Page 5 of 7
(page number not for citation purposes)
ing, such as paw joint thickness [7] and ankle diameter [6], by
avoiding experimenter biases.
Ankylosis and joint angle malformation are major pathological
changes in CIA, especially at the late stage of the disease
[20]. X-ray radiographic analysis has been used to assess this
change [6,8]; however, this method is an endpoint outcome,
requiring sacrificing the animals, and is also based on a semi-
quantitative scoring system [6,8]. In the present study, we
used the DigiGait system to measure the paw angle. The
measured paw angle corresponds to the severity of the clinical
scores. This may reflect either ankylosis or joint angle malfor-
mation which forces the placement of paws at these angles or
may reflect a conscious compensation for balance or gait dis-
turbances caused by joint pain or inflammation. Thus, to the
best of our knowledge, this is the first work indicating that gait
analysis by this non-invasive video-capture device could pro-
vide a simple alternative way to detect the joint malformation in
CIA mice.
To date, the major examination in studies of CIA mouse mod-
els includes clinical symptoms as well as radiographic and his-
tological assessments of arthritis. Most of them are endpoint
examinations, and there is no method available for assessment
of the functional and behavioral defects during the progression
of the disease [5-10]. Although an animal's locomotion veloc-
ity over ground itself can provide valuable information relating
to pain and gait deficits, a change in velocity would make it dif-
ficult to analyze the gait parameters. By allowing the investiga-
tors to set the treadmill belt speed (15 cm/s), the DigiGait
system enables the evaluation and comparison of changes in
numerous gait parameters between subjects without the inter-
ference of changes in velocity and the requisite changes in
gait. In the present study, we measured the stride frequency,
stride length, as well as stride, stance, braking, propulsion, and
swing times. It has been reported that arthritic changes in the
articular surfaces within the joint manifest themselves as an
increase in the frequency and a reduction in the length of
strides in both human and animal subjects [21]. In the present
study, we have observed that the stride frequency indeed
increased and the stride length decreased linearly with
increasing clinical scores, thus confirming this important
observation in the current CIA model. Consistent with these
changes, we also observed a linear decrease in stride time.
Changes in stride frequency can also be reflected in changes
in stance, swing, propulsion, and braking times. Each of these
individual parameters comprises one portion of a full stride.
Consistent with a decrease in stride time, the time spent in
these four phases also decreased linearly with increasing clin-
ical scores. Thus, the present data demonstrate that gait
parameters could be used as objective indices for the progres-
sion of CIA.
Conclusion
The present data demonstrate that video-capture gait analysis
using the DigiGait system strongly corresponds to measurable
pathophysiological changes as determined by the clinical
scoring system in a mouse model of CIA. Thus, this non-inva-
sive video-capture device could be used as a simple and
objective data acquisition system for quantifying the abnormal
movement patterns in CIA mice and evaluating treatment
effectiveness.
Competing interests
TGH is employed by Mouse Specifics, Inc., a purveyor of the
DigiGait technology applied in this study. All other authors
declare that they have no competing interests.
Authors' contributions
YW and LZ contributed to study design, analysis and interpre-
tation of data, and manuscript preparation. JV contributed to
study design, acquisition of data, analysis and interpretation of
data, manuscript preparation, and statistical analysis. CJS
contributed to study design and manuscript preparation. YX
contributed to acquisition of data. TGH contributed to
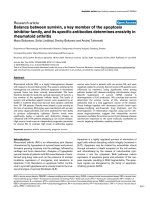
Figure 4
Stride frequency (top), stride length (middle), and stride time (bottom) correspond to disease severity as grouped by average clinical score in individual animalsStride frequency (top), stride length (middle), and stride time (bottom)
correspond to disease severity as grouped by average clinical score in
individual animals. Stride frequency progressively increased, whereas
stride length and time progressively decreased, with increasing clinical
scores in individual animals. Values are means ± standard error of the
mean (p < 0.05 versus baseline).
Arthritis Research & Therapy Vol 9 No 6 Vincelette et al.
Page 6 of 7
(page number not for citation purposes)
acquisition of data and manuscript preparation. MES and RV
contributed to manuscript preparation. JV and YX contributed
equally to the work for this manuscript. All authors read and
approved the final manuscript.
Acknowledgements
We are grateful to the members of the Animal Care Group (Richmond,
CA, USA) for their excellent advice and technical assistance.
References
1. Firestein GS: Evolving concepts of rheumatoid arthritis. Nature
2003, 423:356-361.
2. Kremers HM, Nicola P, Crowson CS, O'Fallon WM, Gabriel SE:
Therapeutic strategies in rheumatoid arthritis over a 40-year
period. J Rheumatol 2004, 31:2366-2373.
3. O'Dell JR: Therapeutic strategies for rheumatoid arthritis. N
Engl J Med 2004, 350:2591-2602.
4. Luross JA, Williams NA: The genetic and immunopathological
processes underlying collagen-induced arthritis. Immunology
2001, 103:407-416.
5. Bauer K, Knipper A, Hoang TR, Koczan D, Kreutzer HJ, Nizze H,
Mix E, Thiesen HJ, Holmdahl R, Ibrahim SM: Perforin deficiency
attenuates collagen-induced arthritis. Arthritis Res Ther 2005,
7:R877-884.
6. Kop EN, Adriaansen J, Smeets TJ, Vervoordeldonk MJ, van Lier RA,
Hamann J, Tak PP: CD97 neutralisation increases resistance to
collagen-induced arthritis in mice. Arthritis Res Ther 2006,
8:R155.
7. Paniagua RT, Sharpe O, Ho PP, Chan SM, Chang A, Higgins JP,
Tomooka BH, Thomas FM, Song JJ, Goodman SB, Lee DM, Gen-
ovese MC, Utz PJ, et al.: Selective tyrosine kinase inhibition by
imatinib mesylate for the treatment of autoimmune arthritis. J
Clin Invest 2006, 116:2633-2642.
8. Saito H, Kojima T, Takahashi M, Horne WC, Baron R, Amagasa T,
Ohya K, Aoki K: A tumor necrosis factor receptor loop peptide
mimic inhibits bone destruction to the same extent as anti-
tumor necrosis factor monoclonal antibody in murine colla-
gen-induced arthritis. Arthritis Rheum 2007, 56:1164-1174.
9. Sakuma M, Hatsushika K, Koyama K, Katoh R, Ando T, Watanabe
Y, Wako M, Kanzaki M, Takano S, Sugiyama H, Hamada Y, et al.:
TGF-beta type I receptor kinase inhibitor down-regulates
rheumatoid synoviocytes and prevents the arthritis induced by
type II collagen antibody. Int Immunol 2007, 19:117-126.
10. Strid J, Tan LA, Strobel S, Londei M, Callard R: Epicutaneous
immunization with type II collagen inhibits both onset and pro-
gression of chronic collagen-induced arthritis. PLoS ONE
2007,
2:e387.
11. Chester VL, Biden EN, Tingley M: Gait analysis. Biomed Instrum
Technol 2005, 39:64-74.
12. Wooley CM, Sher RB, Kale A, Frankel WN, Cox GA, Seburn KL:
Gait analysis detects early changes in transgenic
SOD1(G93A) mice. Muscle Nerve 2005, 32:43-50.
13. Amende I, Kale A, McCue S, Glazier S, Morgan JP, Hampton TG:
Gait dynamics in mouse models of Parkinson's disease and
Huntington's disease. J Neuroeng Rehabil 2005, 2:20.
14. Brand DD, Kang AH, Rosloniec EF: Immunopathogenesis of col-
lagen arthritis. Springer Semin Immunopathol 2003, 25:3-18.
Figure 5
Stance, swing, braking, and propulsion times correspond to disease severity as grouped by average clinical score in individual animalsStance, swing, braking, and propulsion times correspond to disease severity as grouped by average clinical score in individual animals. All four
parameters progressively increased with increasing clinical scores in individual animals. Values are means ± standard error of the mean (p < 0.05
versus baseline).
Available online />Page 7 of 7
(page number not for citation purposes)
15. Anthony DD, Haqqi TM: Collagen-induced arthritis in mice: an
animal model to study the pathogenesis of rheumatoid
arthritis. Clin Exp Rheumatol 1999, 17:240-244.
16. Kakimoto K: Collagen-induced arthritis – characteristics of the
animal model and implications for the treatment of autoim-
mune disease. Chin Med Sci J 1991, 6:78-83.
17. Myers LK, Rosloniec EF, Cremer MA, Kang AH: Collagen-
induced arthritis, an animal model of autoimmunity. Life Sci
1997, 61:1861-1878.
18. Coulthard P, Pleuvry BJ, Brewster M, Wilson KL, Macfarlane TV:
Gait analysis as an objective measure in a chronic pain model.
J Neurosci Methods 2002, 116:197-213.
19. Simjee SU, Pleuvry BJ, Coulthard P: Modulation of the gait defi-
cit in arthritic rats by infusions of muscimol and bicuculline.
Pain 2004, 109:453-460.
20. Williams RO: Collagen-induced arthritis in mice: a major role
for tumor necrosis factor-alpha. Methods Mol Biol 2007,
361:265-284.
21. Gorska T, Zmyslowski W, Majczynski H: Overground locomotion
in intact rats: interlimb coordination, support patterns and sup-
port phases duration. Acta Neurobiol Exp (Wars) 1999,
59:131-144.