Báo cáo khoa học: "Use of kilovoltage X-ray volume imaging in patient dose calculation for head-and-neck and partial brain radiation therapy" pptx
Bạn đang xem bản rút gọn của tài liệu. Xem và tải ngay bản đầy đủ của tài liệu tại đây (1.17 MB, 10 trang )
Hu et al. Radiation Oncology 2010, 5:29
/>Open Access
RESEARCH
BioMed Central
© 2010 Hu et al; licensee BioMed Central Ltd. This is an Open Access article distributed under the terms of the Creative Commons Attri-
bution License ( which permits unrestricted use, distribution, and reproduction in any
medium, provided the original work is properly cited.
Research
Use of kilovoltage X-ray volume imaging in patient
dose calculation for head-and-neck and partial
brain radiation therapy
Weigang Hu
1
, Jinsong Ye
2
, Jiazhou Wang
1
, Xuejun Ma
1
and Zhen Zhang*
1
Abstract
Background: To evaluate the accuracy of using kilovoltage x-ray cone-beam computed tomography (kV-CBCT)
imaging for in vivo dose calculations.
Methods: A Region-of-Interest (ROI) CT number mapping method was developed to generate the cone-beam CT
number vs. relative electron density calibration curve for 3D dose calculations. The stability of the results was validated
for three consecutive months. The method was evaluated on three brain tumors and three head-and-neck tumor
cases. For each patient, kV-CBCT images were acquired on the first treatment day and two-week intervals on the Elekta
XVI system. The delivered dose distributions were calculated by applying the patients' treatment plans to the kV-CBCT
images. The resulting dose distributions and dose volume histograms (DVHs) of the tumor and critical structures were
compared to the original treatment plan.
Results: The kV-CBCT electron density calibration was stable within 1.5% over a three-month period. The DVH and
dose distribution comparison based on the planning CT and the initial kV-CBCT showed good agreements for majority
of cases. The doses calculated from the planning CT and kV-CBCT were compared on planes perpendicular to the
beam axes and passing through the isocenter. Using γ analysis with a criterion of 2 mm/2% and a threshold of 10%,
more than 99.5% of the points on the iso-planes exhibited γ <1. For one patient, kV-CBCT images detected 5.8% dose
variation in the right parotid due to tumor shrinkage and patient weight loss.
Conclusions: ROI mapping method is an effective method for the creation of kV-CBCT electron density calibration
curves for head-and-neck and brain tumor patients. Dose variations as monitored using kV-CBCT imaging suggest that
some patients can benefit from adaptive treatment plan re-optimization.
Background
Patients with head-and-neck and definitive brain tumor
are routinely treated with intensity-modulated radiother-
apy (IMRT) to enable delivery of highly conformal dose
distribution to the tumor while sparing surrounding criti-
cal structures. Precise target localization is important for
such treatments [1-3]. Ideally, the cumulative dose deliv-
ered over the whole treatment course should match the
total planned dose. However, many uncertainties can be
incurred due to patient set-up, anatomic changes and the
organ motions during the course of treatment. Barker JL
Jr. et al. reported that relative median loss in gross tumor
volume was 69.5% and measurable anatomic changes
were found throughout the fractionated radiotherapy in
head-and-neck patients[4]. As a result of these changes
the actual delivered dose deviates from the original
planned dose distribution, potentially affecting the tumor
control and the normal tissue complication rates.
Cone-beam computed tomography (CBCT) systems
mounted on the linear accelerator has become available
for image-guided radiotherapy (IGRT). Currently, there
are two types of commercially available CBCT imaging
systems: (1) the kV-CBCT system, which includes the
Varian On-Board-Imaging (OBI) (Varian Medical Sys-
tems, Palo Alto, CA) and the Elekta XVI Synergy system
(Elekta, Stockholm, Sweden); and (2) the Siemens MVi-
sion system (Siemens Medical Solutions, Malvern, PA)
* Correspondence:
1
Department of Radiation Oncology, Cancer Hospital, Department of
Oncology, Shanghai Medical college, Fudan University, Shanghai, China
Full list of author information is available at the end of the article
Hu et al. Radiation Oncology 2010, 5:29
/>Page 2 of 10
[5-7]. In our hospital, we commissioned an Elekta Syn-
ergy™ accelerator with on-board kV-CBCT in 2006. The
main clinical application of CBCT is to improve the geo-
metric accuracy of target localization in radiation ther-
apy, where the volumetric images of patient acquired
immediately before the treatment are registered to the
reference planning CT images to correct the patient setup
error [8,9]. KV-CBCT imaging has shown enough soft
tissue contrast and spatial resolution for soft-tissue based
setup, but the image quality is affected by the acquisition
parameters. In principle the kV-CBCT data set can be
used to calculate the dose distribution, which means that
the planned dose distribution can be evaluated and veri-
fied on every treatment day [10]. In order to use CBCT
images for dose calculation, the image pixel values need
to be converted from dimensionless CT numbers to
either electron or physical density. Methods for calibrat-
ing conventional fan-beam CT to electron density have
been widely used in clinical dose calculation[11]. How-
ever, compared to conventional CT scanners, kV-CBCT
images have increased artifacts and reduced contrast due
to photon scatter. As a result, the calibration of kV-CBCT
images for dose calculation is an active area of research
[12-15].
The purpose of this study is to assess the feasibility of
using a mapping method to calibrate the kV-CBCT
images for dose calculation in head-and-neck and defini-
tive brain tumor radiation treatments. By monitoring the
dose that patient receives from each fraction, physicians
will be able to track the dose distribution during the
course of radiation therapy and modify the treatment
plan as needed based on the actual dose delivered.
Methods
KV CBCT data acquisition
The kV CBCT images were acquired on a linear accelera-
tor equipped with an integrated kV X-ray volumetric
imaging system (Elekta, Synergy S, XVI, Crawley, UK).
For imaging the head-and-neck and brain tumor patients,
we used the following parameters: 100 kVp, S20 collima-
tor and F0 filter, total 65 mAs and a high-resolution
reconstruction (512 × 512). A total of about 650 projec-
tions were acquired in a full rotation. The CBCT images
were reconstructed with slice thickness of 2.5 mm and
then transferred to the treatment planning system (TPS,
Philips Pinnacle3 V8.0d, Fitchburg, WI, USA) for image
registration and dose calculations.
KV-CBCT Stability
A phantom, Catphan-600 module CTP503 (Phantom
Laboratory, NY) was used to evaluate the stability and
uniformity of the CBCT numbers. The phantom has
seven embedded rods made of different materials: air,
PMP, LDPE, polystyrene, acrylic, Delrin and Teflon. Their
electron densities relative to water range from 0.00 to
2.16. The CBCT image of the phantom was acquired
every month for three consecutive months, and the
CBCT numbers were obtained from the TPS and the rel-
ative electron densities were recorded accordingly. We
also evaluated the maximal fluctuation in CBCT num-
bers on the image uniformity module part of the phan-
tom.
Calibration of relative electron density
For the dose calculation in a treatment planning system,
the relative electron density or physical density of each
voxel of the CT images is required for inhomogeneity
corrections [11]. In this study, calibration of conventional
CT (AcQsim CT Simulator, Philips Medical System,
Cleveland, OH) number to physical density was per-
formed on a CT phantom (CIRS model 062, Norfolk,
VA). However, each individual patient's CBCT scan has a
different scatter component that affects the HU mea-
sured in the image. A significant dose error was observed
if we directly applied the calibration method for conven-
tional CT to kV-CBCT.
We used a Region-of-interest (ROI) CT number map-
ping method similar to Richter's report to generate the
CT number to physical density conversion curve for the
dose calculation [14]. This process was applied to a single
patient with head and neck cancer. The CBCT images for
this patient were acquired at the same day of planning
CT, so that there was no visible change in patient anat-
omy between the two images. A brief description of the
calibration progress is as follows: (1) register the planning
CT images and kV-CBCT images in the ADAC Pinnacle
treatment planning system; (2) map the regions of inter-
ests (ROIs) from conventional CT dataset to the CBCT
dataset, and record the mean CBCT number values of
these ROIs, and (3) Generate the kV-CBCT numbers to
physical density calibration curve based on the density
values measured on the conventional CT.
Clinical Implementation
Three head-and-neck cases and three brain patients with
different tumor sites treated on Elekta Synergy were
selected for retrospective evaluation of the accuracy of
CBCT-based dose calculations. The head-and-neck cases
included two natural killer/T-cell (NK/T) lymphoma
cases and one nasopharyngeal carcinoma (NPC) case. For
all patients, conventional CT was acquired with slice
thickness of 5 mm and the target and critical structures
were delineated by the attending physicians. IMRT plans
were designed according to the physician's prescriptions
with beams of 6 MV. The beam angles were 0, 50, 110,
250 and 310 degree for NK/T cases, and 0, 45, 90, 120,
160, 200, 240, 280 and 320 degree for NPC cases. For
brain cases, gantry angles were 0, 60, 230, 300 and 45
Hu et al. Radiation Oncology 2010, 5:29
/>Page 3 of 10
degree with a 90-degree couch kick. Two sets of CBCT
images were acquired, one on the first treatment day and
the other on two weeks later. The patients were initially
set up to the skin markers then followed with a CBCT
scanning. The CBCT images were acquired according to
the appropriate protocol and then reconstructed with
slice thickness of 2.5 mm. All images were transferred to
treatment planning system for analysis. For each case, the
CBCT images were first registered to the conventional
kV-CT images using an automatic registration method
based on normalized mutual information algorithm, and
then manual adjustments were performed to achieve the
optimal match. A second set of CBCT images were
acquired two weeks later and registered to the reference
planning CT with the same method. The contours were
mapped from CT to CBCT images with slight changes if
them were beyond the skin.
For dose calculation, all the parameters (e.g., iso-center
location, beam angles, MLC shapes, and monitor units)
in the initial treatment plan were applied to the kV-CBCT
images, and then the dose distribution was recalculated
based on the new calibration curve. The dose calculation
was performed in the Pinnacle treatment planning sys-
tem using the collapsed cone superposition convolution
algorithm with an isotropic 2 mm dose grid resolution.
The contours delineated on the conventional CT were
also mapped onto the kV-CBCT image data sets. Finally,
the initial dose distribution matrix calculated on the
planning CT was imported in the treatment planning sys-
tem and displayed on the kV-CBCT dataset using scripts
developed in-house. Dose volume histogram and the
dose to tumor and normal structures were compared on
the two image data sets. The differences in the dose dis-
tributions of the two plans were analyzed using γ analysis
along planes through the isocenter perpendicular to each
beam axis using commercial software (MapCheck,
Version4.0, Sun Nuclear, Melbourne, FL)[16].
Results
The stability of kV-CBCT numbers
Because most patients complete their treatment courses
within five weeks, we consider the three-month length of
the stability test to be adequate. The maximal difference
in CBCT numbers was 21, with a maximum standard
error of less than 1.5%. The stability of kV-CBCT number
and electron density indicates acceptable overall perfor-
mance of the kV-CBCT system. The kV-CBCT images of
the uniformity section of the phantom shows the maxi-
mal fluctuation of the CBCT numbers is ± 35 Hounsfield
unit (HU), which translates to a fluctuation of approxi-
mately 1% in electron density values.
Conversion of kV-CBCT numbers to relative electron
density
A total of 13 different ROIs were used in generating the
conversion curve, which include air, skin, muscle, brain
stem, spinal cord, parotid gland, outer bone, inner bone,
tooth and other structures. Table 1 shows the CBCT
numbers and their corresponding physical density values.
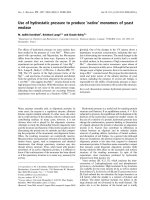
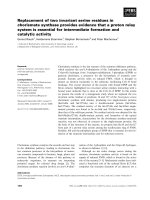
The calibration curves, as shown in Figure 1, were imple-
mented in treatment planning system for the dose calcu-
lations. Large discrepancies were noted from these two
curves. In particular, some discontinuous steps were
observed on the calibration curve of kV-CBCT images.
Clinical cases
Only minimal changes and deformations were observed
in the anatomical structures on the patients' first CBCT
images as compared with the reference planning CT. The
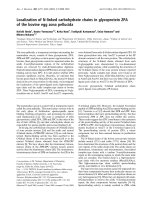
DVHs of one NK/T lymphoma case (patient1), one NPC
case (patient2) and one brain tumor case (patient3) are
shown in Figure 2 as an example. The solid lines repre-
sented the DVHs based on conventional CT images and
the dash lines were based on the dose calculated from the
KV-CBCT images. Figure 3(a)-(c) are the dose distribu-
tions on the transverse planes of the three patients. The
left images represent dose distributions based on the kV-
CBCT and the right had images represent the dose on
kV-CT images. There is no significant dose difference
between the conventional CT images and kV-CBCT
images.
For all clinical cases, the dose comparison was per-
formed at a plane through the isocenter for each individ-
ual beam. Good agreement was found between the
conventional CT and the first kV-CBCT based dose cal-
culations. Using the γ analysis with a criterion of 2 mm
and 2% and a threshold of 10%, more than 99.5% of the
points at the iso-plane have the γ value less than 1.0.
Table 2 shows the distance to agreement (DTA) and
gamma analysis results of the three cases. For most of the
Table 1: The densities and CBCT numbers.
Region of interest (ROI)12345678910111213
CBCT Numbers (HU) 0 1379 1500 1950 1990 2000 2103 2158 2468 2500 2670 3293 3847
Density
(g/cm
3
)
0.0 0.0 0.9 0.9 1.02 1.03 1.06 1.09 1.30 1.50 1.62 1.84 1.86
The densities and CBCT numbers for generating the CBCT calibration curve
Hu et al. Radiation Oncology 2010, 5:29
/>Page 4 of 10
beams, the pass rate for distance to agreement were bet-
ter than 96% except one beam which has the data of
94.5%.
Table 3 shows the dose to the tumor and some normal
structures of the three patients in the planning CT data
sets and the first CBCT data sets. The differences of the
dose to tumor and some normal tissues were within 1%
and 3.2%, respectively. The difference of maximal dose in
tumor is 0.49% and in normal structures are 3.15%.
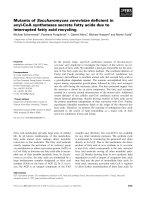
Five out of six patients didn't show significant anatomy
changes and setup variations between the first CBCT
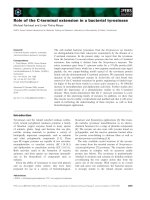
images and the second CBCT images. But for one NK/T
patient (patient5), a slight anatomical change in the
patient's skin contour and air cavity was found in the sec-
ond CBCT images compared to the conventional CT
images, as shown in Figure 4. The dose comparisons of
the reference kVCT, the 1st and 2nd kV CBCTs for that
patient are listed in Table 4. On the first treatment day,
the dose difference in gross tumor volume (GTV), clinical
tumor volume (CTV) and planning tumor volume (PTV)
between reference CT and cone beam CT (kV-CBCT1)
were 0.98%, 0.54%, 0.54%, respectively. The maximal dose
difference was found on the spinal cord (-1.87%). For the
second cone beam CT (kV-CBCT2) acquired two weeks
later, the maximal dose difference of spinal cord
increased to 3.77%, and the maximal dose difference was
found in the right parotid (5.81%). While for tumor and
other structures, the dose agreement was still within
1.0%.
Discussion
On-board CBCT volumetric imaging can improve the
accuracy of radiation therapy in two aspects, namely tar-
get localization and delivered dose verification [12,17,18].
By acquiring 3D CBCT images with patient on the treat-
ment couch just before the treatment delivery, patient
setup error can be corrected and the accuracy of target
positioning localization accuracy can be improved.
CBCT image data sets obtained throughout the treat-
ment course can be used for dose calculation, hence pro-
viding a clinical quality assurance tool for radiotherapy.
However, the CBCT image quality is susceptible to many
factors, such as scattering, beam hardening effects and
organ motion, etc [19]. Morin et al studied dose calcula-
tion based on MV CBCT images and reported that the
MV CBCT could be used to estimate the dose variation
due to the anatomical changes in the head-and-neck
region [20]. In this study, we investigated the feasibility
and the accuracy of using kV CBCT images for direct
Figure 1 Calibration curves for kV CT and kV CBCT. The calibration curves for kV-CT and kV-CBCT based dose calculations in the treatment planning
system.
Hu et al. Radiation Oncology 2010, 5:29
/>Page 5 of 10
Figure 2 DVH displays of three clinical cases. The DVHs of three cases: one NK/T lymphoma (a), one NPC (b) and one Brain (c). The solid lines rep-
resent the dose based on conventional CT and the dash lines represent the dose based on kV CBCT.
Hu et al. Radiation Oncology 2010, 5:29
/>Page 6 of 10
dose calculation in head-and-neck and brain tumor
radiotherapy with a simple and effective method.
The relative electron density can directly affect the dose
calculation accuracy when inhomogeneity correction is
involved. Unlike conventional kV CT or MV CBCT, kV-
CBCT has a larger scatter radiation component and the
image quality suffers from the beam hardening effect [21-
23]. It has been reported that the effect of scatter radia-
tion can be partly corrected or reduced by calibrating the
kV-CBCT system [24,25]. The conventional CT number
to the relative electron density conversion was performed
with a CT number calibration phantom embedded with
different types of tissue-equivalent inserts. However if
such method was used directly for kV-CBCT, a dose cal-
culation error can be introduced. Based on our tests, if we
used the calibration curve generated by the phantom
directly, the dose difference between first CBCT and
planning CT would be more than 5%, which agrees with
the reports from Yang et al and Tucking et al [12,26].
In this study, we used the ROI mapping method to gen-
erate calibration curve for kV CBCT image-based dose
calculation [14]. Obviously, accurate image registration is
needed for this method. The registration of different
image modalities is widely used in radiotherapy for delin-
eating the region of interests[27]. As the registration algo-
rithms in the commercial treatment planning systems
generally use rigid body transformations, we selected the
head-and-neck and brain tumor cases for our study,
where this assumption was generally valid.
The calibration curve for kV-CBCT is different from
that for conventional CT. The conventional CT number is
zero for the air outside the patient skin in the planning
system; however, the CBCT number in such situation is
much greater than zero. The mean CBCT value in the air
around the skin is 1379 for the selected case, similar to
other report [14]. The steps in the kV CBCT electron
density conversion curve is mainly caused by scatter and
beam hardening effects.
A good agreement of the calculated doses to the tumor
and normal structures was found between the conven-
tional CT and the first kV-CBCT images because there
were virtually no anatomical changes between these
images. The maximal dose deviation was found in the eye
mainly due to the residual registration error and contour
deviations, as the slice thickness was 5 mm for the con-
ventional CT and 2.5 mm for CBCT images. The struc-
tures near the skin showed larger differences. The DTA
and γ index analysis results also showed the good agree-
ment between kV-CBCT based and conventional CT
based dose calculation. Richter et al. used the same
method and reported the dose difference between the
planning CT and CBCT was 1.36% ± 1.96% in head
patients with three-dimensional conformal plans. Our
data showed the difference was within 1% of the target,
which was consistent with their result. Our results dem-
onstrated that the mapping method for CBCT correction
is accurate both for three-dimensional conformal plans
and IMRT plans in head and brain cases.
Furthermore, we generated the density conversion table
based on one patient and applied the same table to the
other patients. There were only a small discrepancy
between the doses calculated by using kV CBCT and con-
ventional CT in all 6 cases with different tumor locations.
This result suggests that, for head-and-neck and brain
patients, variations in the scatter effect in imaging differ-
ent tumor sites is relatively small from patient to patient,
and therefore it is reasonable to use the same electron
density conversion curve for kV CBCT based dose calcu-
lation. Compared to the patient group based conversion
table in report of Richter et al. or CT-based HU mapping
method in Mathilda et al., this specific case mapping
method is less complex to develop and implement, but it
is limited to the preset scanning parameters.
Figure 3 Dose distributions of three clinical cases. The transverse
views of dose distributions of the NK/T lymphoma (a), NPC (b) and
brain tumor (c). Left: calculated dose based on CBCT images; Right: cal-
culated dose based on planning CT images. They show good agree-
ment on both relative high and low isodoses.
Hu et al. Radiation Oncology 2010, 5:29
/>Page 7 of 10
Overall, our study showed good accuracy in CBCT
based dose calculation. However, it is not recommended
to replace the conventional planning CT by kV CBCT for
the purpose of treatment planning as the inferior image
quality of kV CBCT may affect the accuracy of target and
normal structures delineation.
The kV CBCT can also be used to evaluate the dose to
tumor or the normal structures. In this study, one NK/T
patient had slight changes in anatomy after two weeks'
treatment, dose variations were found in the spinal cord
and the right parotid gland. These results suggested that
even within a relatively short period such as 2 weeks,
dose verification based on CBCT or CT will be necessary
for certain patients to account for dosimetric effects due
to patient anatomical changes.
Anatomic changes for head-and-neck patients, includ-
ing nodal mass shrinkage and patient weight loss during
the course of radiation therapy, can occur [28,29]. For
these cases, repeat CT imaging and re-planning may be
essential to ensure the adequate dose delivered to the
tumor and proper sparing of the surrounding sensitive
structures.
Technically, the 26 cm field of view for the S20 collima-
tor may limit the use of kV CBCT for dose calculation of
patients with beams going through their shoulders. How-
ever for most head-and-neck patients, the FOV is suffi-
ciently large to evaluate the dose to PTV, brain stem,
spinal cord, eyes and parotid glands. For those patients
who receive thoracic or pelvic treatment, S20 is not large
enough to encompass all the structures and skin. Dose
verification for other sites is part of our future research.
Conclusions
ROI mapping method is a feasible method to overcome
the effects of scatter for generating the kV CBCT relative
electron density calibration curve for head-and-neck can-
cer and brain tumor patients. Dose variations as moni-
tored using kV CBCT imaging were observed in a
relatively short period of two weeks, which suggests
potential benefits of adaptive treatment plan re-optimiza-
tion for certain head-and-neck and brain tumor patients.
Declaration of competing interests
The authors declare that they have no competing inter-
ests.
Table 2: The comparison of iso-plane dose distributions.
Patients Beam index DTA
(3 mm, 3%, 10%)
Pass rate (%)
Gamma index analysis
(2 mm, 2%, 10%, γ<1)
Pass rate (%)
NK/T 1 99.0 100.0
2 100.0 100.0
3 99.4 100.0
4 99.5 100.0
5 99.2 100.0
NPC 1 97.2 99.5
2 98.8 99.8
3 99.8 99.8
4 98.9 100.0
5 96.3 99.6
6 94.5 99.9
7 99.8 100.0
8 99.5 100.0
9 99.0 100.0
Brain Tumor 1 99.7 100.0
2 99.8 100.0
3 96.3 100.0
4 100.0 100.0
5 100.0 100.0
The comparison of iso-plane dose distributions based on conventional CT and KVCBCT for 3 clinical cases using distance to agreement (DTA)
and gamma index analysis in all the beams.
Hu et al. Radiation Oncology 2010, 5:29
/>Page 8 of 10
Table 3: Dose comparisons in targets and normal tissues.
Patients
1st kVCBCT (Gy)
kVCT (Gy) Difference (%)
NK-T lymphoma
(patient1)
1PTV: mean dose 51.03 51.28 0.49%
1Right-eye: mean dose 11.68 11.76 0.70%
1Left-eye: mean dose 10.54 10.58 0.37%
1Spinal cord: max dose 47.14 47.65 1.07%
1Whole body: max dose 59.18 59.44 -0.43%
NPC
(patient2)
2GTV: mean dose 67.8 67.78 -0.03%
2CTV: mean dose 64.9 64.89 -0.02%
2PTV: mean dose 63.76 63.78 0.03%
2Brain Stem: max dose 53.83 54.36 0.98%
2Spinal cord: max dose 32.85 32.73 -0.34%
2L-parotid: mean dose 34.92 34.11 -2.37%
2R-parotid: mean dose 33.38 32.91 -1.41%
2Whole body: max dose 70.73 70.12 0.87%
Brain Tumor
(patient3)
3CTV: mean dose 61.85 61.84 -0.02%
3PTV: mean dose 60.64 60.57 -0.11%
3Brain: max dose 50.13 50.02 -0.22%
3Left-eye: mean dose 19.42 19.4 -0.13%
3Right-eye: mean dose 9.94 9.64 -3.15%
3Whole body: max dose 67.21 67.66 0.66%
Dose comparisons of the first kVCBCT to the planning kVCT in targets and normal tissues for the three clinical cases (NK-T lymphoma, NPC
and Brain Tumor). The difference of maximal dose in tumor is 0.49% and in normal structures are -3.15%. The numbers before the contours
are the indexes of patients, 1PTV means the PTV in patient1.
Figure 4 The transverse views of CT and the 2nd CBCT. The transverse views of the reference CT (a) and cone beam CT (b) after two weeks of the
treatment. A slight change happened in the external contour and air cavity.
Hu et al. Radiation Oncology 2010, 5:29
/>Page 9 of 10
Authors' contributions
Each author has participated sufficiently in the work to take public responsibil-
ity for appropriate portions of the content. JY, ZZ designed the study. WH, JW
performed the study and analysis. XM provided the patients' images. The man-
uscript was written by WH, all other authors helped and finally approved the
final manuscript.
Acknowledgements
The authors thank the Drs. Lijun Ma and Andrew Huwang for helpful discus-
sions and editing of the paper.
Author Details
1
Department of Radiation Oncology, Cancer Hospital, Department of
Oncology, Shanghai Medical college, Fudan University, Shanghai, China and
2
Department of Radiation Oncology, Swedish Cancer Institute, Seattle, WA,
USA
References
1. Hong TS, Tomé WA, Chappell RJ, Chinnaiyan P, Mehta MP, Harari PM: The
impact of daily setup variations on head-and-neck intensity-
modulated radiation therapy. Int J Radiat Oncol Biol Phys 2005,
61:779-88.
2. Xing L, Lin Z, Donaldson SS, Le QT, Tate D, Goffinet DR, Wolden S, Ma L,
Boyer AL: Dosimetric effects of patient displacement and collimator
and gantry angle misalignment on intensity modulataed radiation
therapy. Radiother Oncol 2000, 56:97-108.
3. Han C, Chen YJ, Liu A, Schultheiss TE, Wong JY: Actual dose variation of
parotid glands and spinal cord for nasopharyngeal cancer patients
during radiotherapy. Int J Radiat Oncol Biol Phys 2008, 70:1256-62.
4. Barker JL Jr, Garden AS, Ang KK, O'Daniel JC, Wang H, Court LE, Morrison
WH, Rosenthal DI, Chao KS, Tucker SL, Mohan R, Dong L: Quantification of
volumetric and geometric changes occurring during fractionated
radiotherapy for head-and-neck cancer using an integrated CT/linear
accelerator system. Int J Radiat Oncol Biol Phys 2004, 59:960-70.
5. Kim GY, Pawlicki T, Le QT, Luxton G: Linac-based on-board imaging
feasibility and the dosimetric consequences of head roll in head-and-
neck IMRT plans. Med Dosim 2008, 33(1):93-9.
6. Oelfke U, Tücking T, Nill S, Seeber A, Hesse B, Huber P, Thilmann C: Linac-
integrated kV-cone beam CT: technical features and first applications.
Med Dosim 2006, 31:62-70.
7. Morin O, Gillis A, Chen J, Aubin M, Bucci MK, Roach M, Pouliot J:
Megavoltage cone-beam CT: system description and clinical
applications. Med Dosim 2006, 31:51-61.
8. Chang J, Mageras GS, Yorke E, De Arruda F, Sillanpaa J, Rosenzweig KE,
Hertanto A, Pham H, Seppi E, Pevsner A, Ling CC, Amols H: Observation of
interfractional variations in lung tumor position using respiratory
gated and ungated megavoltage cone-beam computed tomography.
Int J Radiat Oncol Biol Phys 2007, 67:1548-58.
9. Fatunase T, Wang Z, Yoo S, Hubbs JL, Prosnitz RG, Yin FF, Marks LB:
Assessment of the Residual Error in Soft Tissue Setup in Patients
Undergoing Partial Breast Irradiation: Results of a Prospective Study
Using Cone-Beam Computed Tomography. Int J Radiat Oncol Biol Phys
2008, 70:1025-34.
10. Varadhan R, Hui SK, Way S, Nisi K: Assessing prostate, bladder and rectal
doses during image guided radiation therapy need for plan
adaptation? J Appl Clin Med Phys 2009, 10(3):2883.
11. Thomas SJ: Relative electron density calibration of CT scanners for
radiotherapy treatment planning. Br J Radiol 1999, 72:781-6.
12. Yang Y, Schreibmann E, Li T, Wang C, Xing L: Evaluation of on-board kV
cone -beam CT (CBCT)-based dose calculation. Phys Med Biol 2007,
52(3):685-705.
13. van Zijtveld M, Dirkx M, Heijmen B: Correction of conebeam CT values
using a planning CT for derivation of the "dose of the day". Radiother
Oncol 2007, 85(2):195-200.
14. Richter A, Hu Q, Steglich D, Baier K, Wilbert J, Guckenberger M, Flentje M:
Investigation of the usability of conebeam CT data sets for dose
calculation. Radiat Oncol 2008, 3:42.
15. Guan H, Dong H: Dose calculation accuracy using cone-beam CT
(CBCT) for pelvic adaptive radiotherapy. Phys Med Biol 2009,
54(20):6239-50.
16. Low DA, Harms WB, Mutic S, Purdy JA: A technique for the quantitative
evaluation of dose distributions. Med Phys 1998, 25:656-61.
17. Thilmann C, Nill S, Tücking T, Höss A, Hesse B, Dietrich L, Bendl R, Rhein B,
Häring P, Thieke C, Oelfke U, Debus J, Huber P: Correction of patient
positioning errors based on in-line cone beam CTs: clinical
implementation and first experiences. Radiat Oncol 2006, 1:16.
18. Grills IS, Hugo G, Kestin LL, Galerani AP, Chao KK, Wloch J, Yan D: Image-
Guided Radiotherapy Via Daily Online Cone-Beam CT Substantially
Reduces Margin Requirements for Stereotactic Lung Radiotherapy. Int
J Radiat Oncol Biol Phys 2008, 70:1045-56.
19. Jaffray DA, Battista JJ, Fenster A, Munro P: X-ray scatter in megavoltage
transmission radiography: physical characteristics and influence on
image quality. Med Phys 1994, 21:45-60.
20. Morin O, Chen J, Aubin M, Gillis A, Aubry JF, Bose S, Chen H, Descovich M,
Xia P, Pouliot J: Dose calculation using megavoltage cone-beam CT. Int
J Radiat Oncol Biol Phys 2007, 67:1201-10.
21. Ding GX, Duggan DM, Coffey CW: Characteristics of kilovoltage x-ray
beams used for cone-beam computed tomography in radiation
therapy. Phys Med Biol 2007, 52:1595-615.
22. Siewerdsen JH, Jaffray DA: Cone-beam computed tomography with a
flat-panel imager: magnitude and effects of x-ray scatter. Med Phys
2001, 28:220-31.
Received: 18 January 2010 Accepted: 19 April 2010
Published: 19 April 2010
This article is available from: 2010 Hu et al; licensee BioMed Central Ltd. This is an Open Access article distributed under the terms of the Creative Commons Attribution License ( ), which permits unrestricted use, distribution, and reproduction in any medium, provided the original work is properly cited.Radiation O ncology 2010, 5:29
Table 4: Dose comparisons of the first and second CBCT images.
Mean dose (Gy) Maximal dose (Gy)
GTV CTV PTV Left-parotid Right-parotid Brain-stem Spinal-cord Whole-body
kV CT 50.72 51.04 51.02 32.14 30.40 50.92 31.76 55.78
1
st
kV CBCT 50.23 50.77 50.74 31.88 30.57 51.21 31.17 55.63
Dose difference between 1
st
kV
CBCT and kV CT(%)
0.98% 0.54% 0.54% 0.8% -0.56% 0.57% -1.87% -0.26%
2
nd
kV CBCT 50.37 50.77 50.76 32.56 28.73 51.36 32.96 55.71
Dose difference between 2
nd
kV
CBCT and kV CT(%)
0.7% 0.53% 0.52% -1.3% 5.81% 0.86% 3.77% -0.11%
Dose comparison of the first and second CBCTs to the reference planning kVCT in a patient (patient 4) with marked anatomical changes. The
largest changes in dose difference between CBCT and planning CT are found in the spinal cord (from -1.87% to 3.77%) and in the right parotid
(from -0.56% to 5.81%).
Hu et al. Radiation Oncology 2010, 5:29
/>Page 10 of 10
23. Reitz I, Hesse BM, Nill S, Tücking T, Oelfke U: Enhancement of image
quality with a fast iterative scatter and beam hardening correction
method for kV CBCT. Z Med Phys 2009, 19(3):158-72.
24. Létourneau D, Wong R, Moseley D, Sharpe MB, Ansell S, Gospodarowicz
M, Jaffray DA: Online planning and delivery technique for radiotherapy
of spinal metastases using cone-beam CT: image quality and system
performance. Int J Radiat Oncol Biol Phys 2007, 67:1229-37.
25. Siewerdsen JH, Jaffray DA: Optimization of x-ray imaging geometry
(with specific application to flat-panel cone-beam computed
tomography). Med Phys 2000, 27:1903-14.
26. Tucking T, Nill S, Oelfke U: Dose calculation on linac integrated KV-cone
beam CT. Radiotherapy and oncology 2006, 81(Supplement 1):26.
27. Brock KK: Image registration in intensity-modulated, image-guided and
stereotactic body radiation therapy. Front Radiat Ther Oncol 2007,
40:94-115.
28. Beaver ME, Matheny KE, Roberts DB, Myers JN: Predictors of weight loss
during radiation therapy. Otolaryngol Head Neck Sur 2001, 125:645-8.
29. Hansen EK, Bucci MK, Quivey JM, Weinberg V, Xia P: Repeat CT imaging
and replanning during the course of IMRT for head-and-neck cancer.
Int J Radiat Oncol Biol Phys 2006, 64:355-62.
doi: 10.1186/1748-717X-5-29
Cite this article as: Hu et al., Use of kilovoltage X-ray volume imaging in
patient dose calculation for head-and-neck and partial brain radiation ther-
apy Radiation Oncology 2010, 5:29