Báo cáo khoa học: "Planning target volume margins for prostate radiotherapy using daily electronic portal imaging and implanted fiducial markers" docx
Bạn đang xem bản rút gọn của tài liệu. Xem và tải ngay bản đầy đủ của tài liệu tại đây (504.03 KB, 11 trang )
RESEARC H Open Access
Planning target volume margins for prostate
radiotherapy using daily electronic portal imaging
and implanted fiducial markers
David Skarsgard
1*
, Pat Cadman
2
, Ali El-Gayed
3
, Robert Pearcey
4
, Patricia Tai
5
, Nadeem Pervez
4
, Jackson Wu
1
Abstract
Background: Fiducial markers and daily electronic portal imaging (EPI) can reduce the risk of geographic miss in
prostate cancer radiotherapy. The pur pose of this study was to estimate CTV to PTV margin requirements, without
and with the use of this image guidance strategy.
Methods: 46 patients underwent placement of 3 radio-opaque fiducial markers prior to prostate RT. Daily pre-
treatment EPIs were taken, and isocenter placement errors were corrected if they were ≥ 3 mm along the left-right
or superior-inferior axes, and/or ≥ 2 mm along the anterior-posterior axis. During-treatment EPIs were then
obtained to estimate intra-fraction moti on.
Results: Without image guidance, margins of 0.57 cm, 0.79 cm and 0.77 cm, along the left-right, superior-inferior
and anterior-posterior axes respectively, are required to give 95% probability of complete CTV coverage each day.
With the above image guidance strategy, these margins can be reduced to 0.36 cm, 0.37 cm and 0.37 cm
respectively. Correction of all isocenter placement errors, regardless of size, would permit minimal additional
reduction in margins.
Conclusions: Image guidance, using implanted fiducial markers and daily EPI, permits the use of narrower PTV
margins without compromising coverage of the target, in the radiotherapy of prostate cancer.
Background
Several randomized trials have shown improved bio-
chemical relapse-free survival with the use of higher
doses of radiotherapy (RT) in subsets of patients with
organ-confined prostate cancer [1-3]. Although such
higher doses may result in a greater risk of acute and
late toxicity [4], these risks may be mitigated by the use
of narrower normal tissue margins around the target.
Narrower margins could, however, lead to an increased
risk of geographic miss, because of variation in the day-
to-day position of the prostate relative to the skin mark-
ings (inter-fraction mot ion), and internal movement of
the prostate over the course of a single treatment (intra-
fraction motion).
In order to reduce the risk of geographic miss, radio-
opaque fiducial markers can be implanted within the
prostate. Electronic portal imaging (EPI) is then per-
formed prior to each treatment, and isocenter placement
errors are corrected if they exceed pre-determined toler-
ance levels [5]. This approach minimizes the effect of
systematic and random set-up error, such that the ulti-
mate accuracy of the treatment should depend solely on
residual error inherent to the correction protocol that is
used, together with intra-fraction motion of the target.
A prospective phase I/II study was conducted at four
regional cancer centers in the Canadian provinces of
Alberta and Saskatchewan, to evaluate acute and late
toxicity associated with the u se of a hypofractionated
RT schedule of 55 Gy in 16 fractions over four weeks
(4 fractions/week), using image guidance with fiducial
markers and daily EPIs. The purpose of this study was
to examine t he size of PTV margins that would be
required to confidently cover the target, without a nd
with the use of the above image guidance strategy.
* Correspondence:
1
Department of Radiation Oncology, Tom Baker Cancer Center and
University of Calgary; 1331 29 St NW, Calgary AB, T2N 4N2, Canada
Skarsgard et al. Radiation Oncology 2010, 5:52
/>© 2010 Skarsgard et al; licensee BioMed Central Ltd. This is an Open Access article distributed under the terms of the Creative
Commons Attribution Li cense ( which permits unrestricted use, distribution, and
reproduction in any medium, provided the original work is properly cited.
Methods
Patient data
A total of 72 patients were recruited to a prospective
multicenter phase I/II trial between 2004 and 2 006 of
escalated biological dose short course hypofractionated
radiotherapy for low and intermediate risk prostate can-
cer. Eligible patients had to have low or intermediate
risk adenocarcinoma, stage T1-T2b N0-x M0, with a
Gleason score of 7 or less and a PSA level of not more
than 20. Patients were ineligible if they had a prosthetic
hip or other similar hardware t hat would interfere with
visualization of the fiducial marke rs on d aily portal
images. The study was approved by the local Research
Ethics Board of each participating institution, and all
patients signed a study-specific consent form.
This report describes positioning and targeting accu-
racy in the 46 patients on this study who were treated
on conventional linear accelerators without integrated
couch adjustment systems. A further 26 patients who
were treated on a dedicated stereotactic unit with on-
board kV imager and an integrated couch adjustment
system were excluded from the present analysis.
Preparation and treatment planning
All patients underwent implantation into the prostate of
3 gold marker seeds (24 K gold, 0.95 mm in diameter
and 3 mm in length) under trans-rectal ultrasound gui-
dance. The gold seeds were placed in the prostate base,
mid-gland and apex. Antibiotic prophylaxis was used,
and typically consisted of ciprofloxacin 500 mg twice
dailyforthreedays,startingthedaybeforetheimplan-
tation procedure.
Patients then underwent CT-simulation in the supine
position, with immobilization according to the institu-
tional standard. This typically consisted of a non-custo-
mized foot holding device, in some cases with the
addition of a soft roll behind the knees. Rigid immobiliza-
tion devices were not used. Patients were instructed to
have a filled bladder and an empty rectum for their CT-
simulation and for each treatment appointment. Bowel
and bladder instructions that were given to patients were
institution specific but typically involved the ingestion of
a specified amount of water at a certain interval prior to
treatment, and the use of a mild laxative such as milk o f
magnesia as needed to maintain a regular bowel habit. A
suppository or enema prior to CT-simulation was recom-
mended but was not mand atory. The CT simulation was
performed with out contrast, at a slice thickness of 3 mm.
Urethrograms were not performed.
The clinical target volume (CTV) consisted of the
prostate gland +/- the proximal seminal vesicles. The
planning target volume (PTV) was created by symmetri-
cally expanding the CTV by 1.0 cm in all dire ctions
except posteriorly, where it was expanded by 0.5 cm.
This was done empirically because of uncertainty about
rectal toxicity with this hypofractionated RT regimen,
and we anticipated there would be reliable coverage of
the CTV with the use of daily image guidance.
Patients were planned and treated in the supine posi-
tion using 3-dimensi onal conformal RT (3D -CRT) or, if
dose constraints of the study could not be met, with
intensity modulated RT (IMRT). The prescription dose
was 55 Gy i n 16 fractions over 4 weeks, delivered as 4
fractions per week. The PTV was required to be covered
by 98% of the prescription dose and none of the CTV
was allowed to receive less than 55 Gy.
High resolution digitally reconstructed radiographs
(DRRs) were generated for the anterior (0°) and lateral
(90° or 270°) gantry angles, whether or not they were
actual treatment fields, and these were electronically
attached to the patient’ s file in the Varis Vision® system.
Target localization and treatment delivery
Patients were positioned each day for radiotherapy by
lining up room-mounted lasers to skin markings that
had been made at the time of CT-simulation, then mak-
ing a prescribed set of moves as dictated by the treat-
ment plan to arrive at a skin entry point that was
consistent across all treatments. This was the standard
practice at the time of the study at all 4 participating
institutions, for prostate patients who were being treated
without image guidance.
Daily orthogonal electronic portal images (EPIs) were
then taken from the anterior and lateral gantry angle s,
from a consistent skin entry point as defined above. A
total of 32 images were planned (16 anterior, 16 lateral)
for each treatment course. A radiation dose of 8 moni-
tor units (appro ximately 4 – 6 cGy at the prescription
point) was attributed to each i mage, and this dose was
incorpor ated into the treatment plan such that the total
delivered dose remained at 5500 cGy.
The position of the gold markers on each daily pair
of EPIs was compared to their intended position, as
seen on the reference DRR, to determine isocenter pla-
cement error, by using the anatomy matching func-
tions of the Varis Vision® software. The anterior EPI
was used to determine error along the left-right (L-R)
axis, while the lateral EPI was used to determine error
along the superior-inferior (S-I) and anterior-posterior
(A-P) axes.
Tolerance for isocenter placement error was empiri-
cally defined as less than 3 mm along the L-R and S-I
axes, and less than 2 mm alo ng the A-P axis. Therefore,
if an isocenter placement error of 3 mm or greater wa s
measured on any treatment day along the L-R and/or
S-I axes, the lateral and/or longitudinal position of the
Skarsgard et al. Radiation Oncology 2010, 5:52
/>Page 2 of 11
treatment table was a djusted as needed to completely
correct this error. Simila rly, if an isocenter placement
error of 2 mm or greater was measured along the A-P
axis, the table height was adjusted as needed to comple-
tely correct this error. At all participating institutions,
this required radiation therapy staff to enter the treat-
ment room and manually adjust the couch position in
the opposite direction to the error along each of the
affected axes. Rotation could be used, if necessary, to
facilitate matching, but rotational errors were not
recorded or corrected. Localization EPIs were not
repeated to confirm that isocenter placement errors had
been corrected properly prior to treatment, because the
additional dose of radiation that would have been
incurred by this ad hoc procedure had not been
accounted for in the planning process.
Repeat EPIs were captured during treatment delivery,
again from anterior and lateral gantry angles. Although
the protocol did not specify when these were to be
done, they were t ypically performed about mid-way
through the treatment fraction. With the use of an
amorphous silicon electronic portal imaging device at
the high resolution setting and at the appropriate
photon energy, the gold seeds were well visualized in all
of our patients. The position of the isocenter on these
verification EPIs was compared with its intended posi-
tion as per the DRRs, along the L-R, S-I and A-P axes.
Since the isocenter position on the during-treatment
EPIs could have been affected by both intrafraction
motion and residual uncorrected isocenter placement
error, we used the following formula to estimate the
magnitude of intrafraction motion alone:
Intrafraction motion =
L-R, S-I, A-P
L-R
2
––L-R
1
c
L-R
[
]
,
A-P
2
––A-P
1
c
A-P
[
]
S-I
2
––S-I
1
c
S-I
[
]
,
where L-R
2
, S-I
2
and A-P
2
, and L-R
1
,S-I
1
and A-P
1
,
represent during-treatment and pre-t reatment (uncor-
rected) isocenter positions along the L-R, S-I and A-P
axes respectively, and c
L-R
,c
S-I
and c
A-P
represent the
corrections that were made along each of those axes.
For example, if the pre-treatment (uncorrected) i socen-
ter position along the S-I axis was +4 m m, such that a
correction of -4 mm was made before treatment, and
the during-treatment isocenter position was -2 mm,
then the estimated intra-fraction motion along the S-I
axis would be (-2) – (+4 ) – (-4) = -2 mm. PTV margins
thatwouldberequiredtogive95%probabilityofCTV
coverage on any treatment day were calculated using
the method described by Antolak [6]. Briefly, this
involved expanding the CTV in three dimensions using
an ellipsoid with major axes of 1.65 times the total stan-
dard deviation in each direction.
Results
Table 1 shows the clinical characteristics of the
46 patients included in the study.
Isocenter placement accuracy with set-up relative to skin
markings
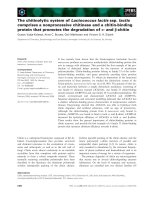
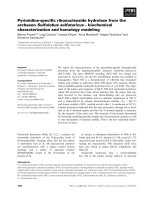
Figure 1 shows, for each fraction of RT that was given,
the isocenter placeme nt error on the pre-treatment
EPIs, relative to the intended position of the isocenter
on the corresponding reference image, along the S-I and
A-P (Figure 1a) and the S-I and L-R (Figure 1b) axes.
Summary statistics are shown in Table 2, in the left-
hand columns (“pretreatment”). These EPIs were taken
after the patient had been set up for treatment in the
conventional fashion using the previously-described
method. Any deviation of individual points from the
intersection of the x an d y axes represents the isocenter
placement error for one fraction. The mean pre-treat-
ment isocenter position (± SD), relative to that on the
Table 1 Patient characteristics (n = 46)
Age (years)
Median 70
Mean 68.6
SD 6.9
T-category (%)
T1a 1 (1%)
T1c 20 (43%)
T2a 11 (24%)
T2b 8 (17%)
T2c 5 (11%)
Unknown 1 (2%)
Gleason score (%)
3 + 3 20 (43%)
3 + 4 17 (37%)
4 + 3 9 (20%)
No. of positive biopsy cores (%)
2 or fewer 15 (33%)
3 – 4 16 (35%)
5 or more 12 (26%)
Unknown 3 (7%)
Last pre-treatment PSA (%)
0 – 3.9 8 (17%)
4.0 – 9.9 29 (63%)
10.0 – 14.9 7 (15%)
15.0 – 20.0 2 (4%)
Mean 6.8
Median 6.3
Minimum 0.4
Maximum 19.4
Skarsgard et al. Radiation Oncology 2010, 5:52
/>Page 3 of 11
reference image was 0.01 ± 0.35 cm, -0.24 ± 0.48 cm
and 0.01 ± 0.47 cm along the L-R, S-I and A-P axes
respectively. As these numbers indicate, although confi-
dence intervals overlap ze ro, there was a trend toward a
systematic error of over 2 mm in the inferior direction,
which may be due to greater patient relaxation during
treatment than at the time of CT-simulation. The ellipse
on each of figures 1a and 1b indicates the 95% confi-
dence interval for isocenter placement along each axis,
relative to the reference image. If daily set-up verifica-
tion and correction were not performed, CTV to PTV
margins of 0.57 cm, 0.79 cm and 0.77 cm would be
required along the L-R, S-I and A-P axes respectively, to
give a 95% probability of complete CTV coverage on
any given treatment day.
Of the total 736 daily fractions that were administered,
pre-treatment EPIs showed isocenter placement errors
that exceeded protocol specifications (3 mm or more in
all directions except 2 mm or more along the anterior-
posterior axis) in 31%, 52% and 63% of treatments along
the L-R, S-I and A-P axes respectively, of which 14%,
31% and 29% were larger than 5 mm. In 88% of all
treatments, the patient’s position had to be adjusted
because of an isocenter placement error that exceeded
tolerance limits a long one or more axes. In 55% of all
treatments, the initial set-up without image guidance
resulted in an isocenter placement error of greater than
5 mm along at least 1 axis.
Isocenter placement accuracy during-treatment, using a
daily EPI and correction protocol
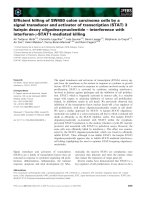
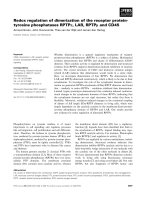
Figure 2 shows, for each fraction of RT, the during-
treatment isocenter position relative to its intended
position on the reference image along the S-I and A-P
(Figure 2a) and the S-I and L-R (Figure 2b) axes. Sum-
mary statistics are shown in Table 2, in the right-hand
columns ("during treatment”). In the figures, any devia-
tion of individual points from the intersection of the
x and y axes represents a combination o f residual
(uncorrected) pre-treatment isocenter placement error
(i.e. within the tolerance limits of the correction proto-
col) and intra-fraction motion. The mean during-treat-
ment isocenter position (± SD), relative to that on the
reference image, was 0.01 ± 0.22 cm, 0.01 ± 0.22 cm
and 0.03 ± 0.22 cm along the L-R, S-I and A-P axes
respecti vely. As these numbers indicate, after correcti on
Figure1 Isocenter placement errors (in cm) relative to DRR on pre-treatment EPIs (gray circles; n = 736 fractions), along a): S-I and A-P
axes, and b): S-I and L-R axes. Ellipse shows 95% confidence intervals for CTV coverage in each direction.
Table 2 Pre-treatment and during treatment isocenter placement errors
Pre-treatment (cm) During treatment (cm)
Min Mean Median Max SD Min Mean Median Max SD
A-P mismatch -1.40 0.01 0.03 2.00 0.47 -1.10 0.03 0.03 0.75 0.22
R-L mismatch -1.20 0.01 0.00 2.20 0.35 -2.66 0.01 0.02 0.80 0.22
S-I mismatch -2.15 -0.24 -0.20 1.50 0.48 -0.89 0.01 0.00 1.15 0.22
Skarsgard et al. Radiation Oncology 2010, 5:52
/>Page 4 of 11
of pre-trea tment errors according to our protocol, there
was no significant remaining systematic error in position
of the isocenter compared to the reference images.
The inner ellipse on eac h of figures 2a and 2b indi-
cates the 95% confidence interval for isocenter place-
ment relative to the reference image. With our
correction protocol,CTVtoPTVmarginsof0.36cm,
0.37 cm and 0.37 cm would be required along the L-R,
S-I andA-P axes respectively, to give a 95% probability
of complete CTV coverage on a given treatment day.
The percentage of treatments having an isocenter place-
ment error of 5 mm or greater in any direction on the
during-treatment EPIs was 8.3%. The outer box on each
of these figures shows the PTV margins that were used
on this protocol; 10 mm in all directions except poster-
iorly, where a 5 mm margin was used. As can be seen,
these margins gave adequate coverage of the CTV in
almost all of the 530 fractions for which during-treat-
ment EPIs were taken. In one case, a 2.7 cm isocenter
placement error on the during-treatment EPI was
observed. This was attributed to a mistake that was
made on the treatment unit in co rrecting a 3 mm error
along the L-R axis on the pre-treatment EPI (figure 2b).
Although this point was included in our calculation of
CTV to PTV margins required for 95% probability of
CTV coverage, the exclusion of this one point would
have had little effect on the result.
Intra-fraction motion
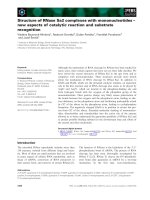
Figure 3 shows, for each fraction of RT, the estimated
intra-fraction motion (assuming there was no residual
uncorrected isocenter placement error prior to treat-
ment), along the S-I and A-P axes (figure 3a) and the
S-I and L-R axes (figure 3b). The mean intrafraction
motion (± SD) was 0.01 ± 0.20 cm, 0.05 ± 0. 19 cm a nd
0.04 ± 0.21 cm along the L-R, S-I and A-P axes respec-
tively. Because the means are close to zero along each
axis, this suggests that intra-fraction motion was a ran-
dom process in the population of patients that we
studied.
The ellipse on figures 3a and 3b indicates the 95%
confidence interval for isocenter placement relative to
its pre-treatment position, which was assumed to be the
intended isocenter position. If all pre-treatment isocen-
ter placement errors were completely corrected, regard-
less of size, leaving intra-fraction motion as the only
variabl e affecting during-treatment isocenter placement,
PTV margins of 0.33 cm, 0.32 cm and 0.35 cm would
be required along the L-R, S-I and A-P axes respectively,
to give a 95% probability of complete CTV coverage on
any given treatment day.
Discussion
The use of implanted fiducial markers, with daily pre-
treatment electronic portal imaging during a course of
prostate RT, makes it possible to estimate the extent of
variation in prostate position relative to external skin
markings, from one fraction to another (inter-fraction
motion), and during a single fraction (intra-fraction
motion). We found that th e use of daily image guidance
by fiducial markers and a threshold-based correction
process would have permitted a substantial reduction in
Figure 2 Isocenter placement errors (in cm) relative to DRR on during-treatment EPIs (gray circles; n = 530 fractions), along a): S-I and
A-P axes, and b): S-I and L-R axes. Outer box shows PTV margins used in the study; inner ellipse shows 95% confidence intervals for CTV
coverage in each direction.
Skarsgard et al. Radiation Oncology 2010, 5:52
/>Page 5 of 11
PTV margins, from 0.57 cm, 0.79 cm and 0.77 cm to
0.36 cm, 0.37 cm and 0.37 cm in the left-right, superior-
inferior, and anterior-posterior directions respectively.
Our strategy of adjusti ng the patient’spositionifneces-
sary prior to treatment, to correct isocenter placement
errors of 3 mm or larger along the L-R and S-I axes,
and 2 mm or larger along the A-P axis, effectively
reduced the combined systematic and random error to
within 3 mm along the L-R and S-I axes and 2 mm
along the A-P axis.
Our image guidance procedure of taking a pre-treat-
ment EPI, comparing it to the reference image and
adjusting the patient position as required, added about
5 minutes to the daily treatment time. On this protocol
with only 16 fractions per treatment course, this extra
time on the treatment machine wa s more than made up
for by the reduction in number of fractions compared to
conventional regimens of 35 to 39 fractions.
We wondered whether correction of all isocenter pla-
cement errors on the pre-treatment EPIs, regardless of
size, would have permitted the use of even narrower
CTV to PTV margins than are shown in figures 2a and
2b. To estimate the CTV to PTV margins that would be
required to account only for intra-fraction motion,
assuming there was no residual (uncorrected) isocenter
placement error, we re-constructed figures 2a and 2b
after normalizing the pre-treatment position to zero
along each axis, to mimic the situation in which all iso-
center placement errors are corrected. By comparing
CTV to PTV margins in figures 3a and 3b with those in
figures 2a and 2b, it can be seen that residual (uncor-
rected) isocenter placement error plays a very small
role, compared to intra-fraction movement, in determin-
ing the ultimate accuracy of treatment. We estimated
that, had we corrected all isocenter placement errors
along each of the 3 axes, we would have been able to
further reduce CTV to PTV margins by not more t han
0.05 cm along any axis, and by a clinically meaningless
0.02 cm along the most significant A-P axis. This indi-
cates that, at least on treatment machines with non-
automated correction of isocenter placement errors,
there is little to be gained from correcting errors that
are smaller than the tolerance levels that were used in
this study. Automated, operator-i ndep endent correction
of all isocenter placement errors would, however,
remov e the risk o f human error that resulted, for exam-
ple, in a 2.7 cm error in the “corrected” isocenter posi-
tion, as shown in Figure 2b.
Table 3 shows intra-fraction motion (IFM) estimates
from a selection of published reports. A variety of differ-
ent methods have been used to estimate IFM, including
i) fiducial markers imaged with EPID a nd/or port films
[present study, 7–10], cone beam CT [11] and aSi
“movies” [12]; ii) real-time monitoring of the position of
electromagnetic transponders [13]; iii) cine-MRI [14]; iv)
B-mode acquisition and targeting (BAT) ultrasound
[15]; and v) serial CT scans [16].
Our indirect method of estimating intra-fraction motion,
because it is based on the comparison of prostate position
on only two EPIs, may be less accurate than methods
Figure 3 Isocente r placeme nt errors (in cm) on during-tre atment EPIs (gray circles; n = 530 fractions), relative to the expected pre-
treatment isocenter position, along a): S-I and A-P axes, and b): S-I and L-R axes. Ellipse shows 95% confidence intervals for CTV coverage
in each direction.
Skarsgard et al. Radiation Oncology 2010, 5:52
/>Page 6 of 11
which involve real-time tracking of the prostate’s position
over the course of treatment [12,13]. It also may not cap-
ture spontaneous target displacements due to physiologic
or physical factors (e.g. bowel gas or patient mov ement).
Nevertheless, our results are not dissimilar to other
published reports which used different methods. This
includes along the S-I axis, even though the 3 mm CT
slice thickness theoretically introduces an additional error
of +/- 1.5 mm (one half the slice thickness) compared to
other axes. An exception is along the L-R axis, where our
Table 3 Intra-fraction motion (IFM) in various series
Series (no. of
patients)
Treatment set-up details Standard deviation of
IFM (cm)
Comments
L-R S-I A-P
Present series
(n = 46)
Supine, knee cushion. Comfortably full
bladder, empty rectum.
0.20 0.19 0.21 3 fiducial markers, imaged with aSi EPID. IFM estimated by
comparing during-treatment EPI isocenter position with
presumed pre-treatment position (after any correction; not
verified by a repeat EPI).
Cheung [7]
(n = 33)
Custom vacuum lock bag. Empty bladder
and rectum.
0.09 0.12 0.18 3 fiducial markers, imaged with EPID. IFM estimated by
comparing pre and post-treatment EPIs on days 1 to 9 of
phase I.
Aubry [8]
(n = 18)
Supine, immobilization not stated. Full
bladder, empty rectum.
0.08 0.11 0.16 2 - 3 implanted fiducial markers. Multiple daily sets of
portal images to estimate intrafraction motion. IFM was <
5 mm in 100%, 99.5% and 99% of cases along L - R, S - I
and A - P axes respectively.
Chung [9]
(n = 17)
Supine, custom vacuum lock bag, standard
leg immobilizing device. Comfortably full
bladder, empty rectum.
ns 0.25 0.32 3 implanted fiducial markers. Lateral portal images prior to
treatment. Correction of isocenter placement errors > 3
mm in any direction. Post-correction EPI to confirm
correction.
J Wu [10]
(n = 13)
Supine, alpha cradle, soft foam
immobilization device supporting lower
legs. Partially full bladder, empty rectum.
ns 0.21 0.23 3 implanted fiducial markers. Daily EPI to confirm field
placement. 3 × weekly lateral port films to measure
random and systematic field placement errors. Data
shown are with respect to center of mass.
Letourneau
[11] (n = 8)
Not stated ns 0.09 0.09 3 implanted fiducial markers. Initial set-up according to
skin marks, then cone beam CT verification of marker
position and correction as required, followed by repeat
cone beam CT for confirmation. Movement of markers
relative to bony landmarks was assessed with kV x-rays;
shown are standard deviations of IFM based on first and
last radiographs that were taken between the 2 cone
beam CTs, approximately 15 - 25 minutes apart.
Nederveen
[12] (n = 10)
Supine, knee cushion. Empty bladder; no
bowel instructions.
ns 0.07 0.05 Real-time aSi “movies” showing movement of fiducial
markers within the prostate over a 2 - 3 minute period.
Litzenberg
[13] (n = 11)
Supine, flat couch, knee support. No
bladder or bowel instructions.
0.02 0.12 0.08 3 electromagnetic transponders (Calypso®) implanted in
the prostate. Monitoring of position of transponders for 8
minutes.
Ghilezan [14]
(n = 6)
Supine, no immobilization. Empty bladder,
full rectum.
ns 0.17 (mid-
posterior) 0.13
(apex)
Sagittal cine-MRI at 6 sec intervals over 1 hour on 3 days.
Measured movement was in sagittal plane; no distinction
between A - P and S - I axes. Rectal filling based on
qualitative assessment of the amount of gas and feces in
the rectum on a particular scan.
As above, empty rectum. ns 0.08 (mid-
posterior) 0.10
(apex)
Huang [15]
(n = 20)
Supine. No additional details. 0.04 0.10 0.13 BAT ultrasound images before and after treatment. IFM
was < 5 mm in 100%, 99.5% and 99% of cases along L -
R, S - I and A - P axes respectively.
Stroom [16]
(n = 15) a)
Supine
Supine, knee roll, foot support. Suppository
prior to planning CT; partially full bladder
for all CTs.
0.06 0.25 0.28 Planning CT, 3 repeat CTs, at 2, 4 and 6 weeks of
treatment. Changes in CTV position relative to bony
anatomy were compared on the 4 CT datasets to
estimate IFM.
Stroom [16]
(n = 15) b)
Prone
Prone with belly board. Otherwise as above. 0.05 0.15 0.17 As above.
Abbreviations: L - R = left to right; S - I = superior to inferior; A - P = anterior to posterior; aSi = amorphous silicon; EPID = electronic portal im aging device;
EPI = electronic portal image; ns = not stated; BAT: B-mode acquisition and targeting.
Skarsgard et al. Radiation Oncology 2010, 5:52
/>Page 7 of 11
Table 4 CTV to PTV margin recommendations in various series, without image guidance
Series
(number
of
patients)
Treatment set-up details CTV - PTV margin
requirement (cm)
Comments
L-R S-I A-P
Present
series
(n = 46)
Supine, knee cushion. Comfortably full bladder,
empty rectum.
0.57 0.79 0.77 3 fiducial markers, no correction of isocenter placement
errors. Margins required for 95% probability of CTV
coverage for any given fraction.
van der
Heide [5]
(n = 453)
Supine, knee cushion. Empty bladder, no
bowel instructions.
0.36 0.48 0.79 2 - 4 fiducial markers. Daily aSi EPI. Results without
application of a correction protocol. Standard deviations
were provided, from which we calculated margins required
to give 95% probability of CTV coverage (CTV - PTV margin
calculated as SD × 1.65 [6]).
Litzenberg
[13]
(n = 11)
Supine, flat couch, knee support. No bowel or
bladder instructions.
0.82 1.25 1.02 3 implanted Calypso® markers. Real time tracking of
transponder position for 8 minutes, to provide information
about intra-fraction motion. “Average” CTV to PTV margins,
calculated using the method of van Herk [17], to give 90%
probability of covering the target with at least 95% of the
prescribed dose.
Stroom [16]
a) Supine
(n = 15)
Supine. Knee roll, foot support Suppository
prior to planning CT; partially full bladder for all
CTs
0.40 0.82 0.83 CT scan in treatment position, repeated at weeks 2, 4 and
6 of treatment. Position of prostate registered with initial
treatment planning CT. CTV to PTV margins required to
cover target with an unspecified isodose line are calculated
using the formula: CTV-PTV = 2Σ
tot
+ 0.7s
tot
, where Σ
tot
and s
tot
are the quadratically summed contributions of
translational set-up uncertainty and internal organ motion.
Stroom [16]
b) Prone
(n = 15)
Prone. Belly board. Otherwise as above 0.37 0.66 0.88 As above.
Poli [18]
(n = 387)
Supine, foam between knees, ankles in
Styrofoam block. Full bladder, no bowel
instructions.
0.77
right
0.66
left
1.11
sup
0.69
inf
0.27
ant
1.49
post
Daily localization of target using 2D BAT ultrasound for at
least 4 consecutive fractions (average 27 per patient).
Margins required for 95% probability of target coverage,
including the effect of systematic shift (average 0.61 cm
posteriorly).
Tinger [19]
(n = 8)
Supine, alpha cradle. Urethrogram, rectal probe.
Full bladder. No bowel instructions.
0.53 0.73 0.66 Weekly CT, registered to planning CT, to measure center of
volume motion of the prostate. Daily EPIs registered to
simulator films to measure setup displacement. Data were
provided on standard deviation (SD) of total uncertainty of
CTV position, from which we calculated margins required
to give 95% probability of CTV coverage (CTV-PTV margin
calculated as SD × 1.65).
Meijer [20]
(n = 30)
Position and immobilization not specified.
Bladder instructions given. Bowel instructions
not specified.
0.40 0.80
sup
1.10
inf
0.80
ant
1.10
post
4 fiducial markers. Simulation study based on 8 CT scans
spaced over the course of treatment. Set-up to skin
markers then daily on-line imaging, with no correction of
set-up errors. Margins calculated using a dose warping
technique to give 90% probability of covering the CTV
with at least 95% of the prescribed dose.
Beltran [21]
(n = 40)
Position, immobilization, bladder and bowel
instructions not specified.
0.73 0.81 1.05 4 fiducial markers. Set up to skin markers, then daily
imaging without correction of set-up errors. Margins were
calculated using the method of van Herk [18], to give 90%
probability of covering the CTV with at least 95% of the
prescribed dose.
Nairz [22]
(n = 27)
Supine, immobilization not specified, no bowel
or bladder instructions
0.87 1.20 1.58 Daily cone beam CT without correction of set-up errors.
Margins were calculated using the method of van Herk
[17], to give 90% probability of covering the CTV with at
least 95% of the prescribed dose.
Graf [23] (n
= 23)
Supine, no rigid immobilization. Full bladder,
no bowel instructions (although scan repeated
if excessive rectal filling)
0.70 0.95 0.95 3 - 5 fiducial markers. Daily EPI without corrections.
Margins were calculated using the method of Van Herk
[17].
Abbreviations: As in table 3. Also, 2D = 2-dimensional; SD = standard deviati on; s
tot
= total random variation; Σ
tot
= total systematic variation.
Skarsgard et al. Radiation Oncology 2010, 5:52
/>Page 8 of 11
estimate of SD was larger than what was reported in other
studies that provided this information. There are a num-
ber of possible explanations for this observation. There is
some subjectivity inherent to our matching procedure,
such that inter and intra-observer variability in determina-
tion of isocenter placement errors is likely to be on the
order of 1 – 2 mm. Corrections were performed manually,
by entering the treatment room and moving the couch in
the direction(s) opposite to the error. Accuracy of the digi-
tal readout on the treatment couch was to ± 1 mm, and
accuracy of the manual correction process was likely simi-
lar to this. Post-corr ection EPIs were not performed,
which would have confirmed the correct couch adjust-
ments but at a cost of introducing extra time and radiation
exposure. It is apparent that some “corrections” were per-
formed in the wrong direction, resulting in a potentially
Table 5 CTV to PTV margin recommendations in various series, with image guidance
Series
(number
of
patients)
Treatment set-up details CTV – PTV
margin
requirement
(cm)
Comments
R-L S-I A-P
Present
series
(n = 46)
As in table 4 0.36 0.37 0.37 As in table 4, with correction of isocenter placement
errors 3 mm or greater in size on R-L and S-I axes,
2 mm or greater on A-P axis. No post-correction EPI.
van der
Heide [5]
(n = 453)
Supine, knee cushion. Empty bladder, no bowel
instructions.
0.18 0.25 0.40 2 - 4 fiducial markers. Daily aSi EPI. Correction of all
errors prior to treatment. Standard deviations were
provided, from which we calculated margins required
to give 95% probability of CTV coverage (CTV - PTV
margin calculated as SD × 1.65 [6]).
Cheung [7]
(n = 33)
Supine, vacuum lock bag. Empty bladder and rectum. 0.30 0.30 0.40 3 fiducial markers. Pre- and post-RT EPI days 1-9 to
calculate individualized CTV-PTV margins (averages
shown), which were used during the IMRT boost phase,
during which daily on-line correction was performed
according to fiducial marker position. A 2 mm factor
was added in quadrature to the total error, to account
for inaccuracies in the on-line correction process.
Average individualized CTV to PTV margins are shown,
although several patients had margins larger than 0.7
cm along the A-P axis.
J Wu [10]
(n = 13)
Supine, alpha cradle, soft foam support for lower legs.
Empty rectum and partially full bladder (drink 500 mL
water 45 mins before) for CT and treatment
ns 0.53 0.60 3 fiducial markers. Daily pre-treatment portal images 3×
per week over the course of treatment. CTV to PTV
margin required to give 99% probability of CTV
coverage by 95% isodose line. Margins calculated
according to movement of center of mass.
Litzenberg
[13]
(n = 11)
Supine, flat couch, knee support. No bowel or bladder
instructions.
0.18 0.70 0.58 As in table 4, with the inclusion of intra-fraction
motion.
Meijer [20]
(n = 30)
As in table 4 0.20 0.40
sup
0.60
inf
0.20 4 fiducial markers. Simulation study based on 8 CT
scans spaced over the course of treatment. Set-up to
skin markers then daily on-line imaging, with correction
of all set-up errors. Margins calculated using a dose
warping technique to give 90% probability of covering
the CTV with at least 95% of the prescribed dose.
Beltran [21]
(n = 40)
As in table 4 0.43 0.49 0.48 As in table 4, with daily correction of all errors.
Nairz [22]
(n = 27)
As in table 4 0.61 0.96 1.07 As in table 4, with daily correction of all errors.
Graf [23]
(n = 23)
As in table 4 0.49 0.51 0.48 As in table 4, with daily correction of all errors.
Q Wu [24]
(n = 28)
Not stated 0.30 0.30 0.30 15 CT scans obtained during the course of treatment
and registered with respect to bony anatomy with
planning CT. Evaluation of both image-based and
contour-based registration methods. Analysis based on
both geometric and dosimetric parameters. Estimated
CTV to PTV margins required to allow a dose reduction
on the prostate (D99) of not more than 2% for 90% of
patients.
Abbreviations: As in table 4.
Skarsgard et al. Radiation Oncology 2010, 5:52
/>Page 9 of 11
much larger isocenter placement error than existed on the
pre-treatment EPI. Although we are not able to identify
with certainty all of the individual treatment fractions for
which this occurred, we know this is the explanation for at
least some of the outlying points on figure 3, as mentioned
previously. We did not exclude from the analysis any data
points that we felt had been “corrected” in the wrong
direction. Since our procedure is potentially affected by
human error, we did not feel the effects of those errors
should be omitted from the results. If we had excluded the
single point estimate of IFM of 2.6 cm to the left (figure
3b), the standard deviation of IFM along the L-R axis
would have fallen from 0.19 cm to 0.15 cm, and the CTV
to PTV margin required to give a 95% likelihood of CTV
coverage along that axis would have decreased by 0.06 cm.
Although this additional margin reduction is perhaps tri-
vial, the case for automated correction of errors is strong
especially with hypofractionated RT, since a geographic
miss on even one out of 16 fractions could result in a
significant lowering of tumor control probability.
Tables 4 and 5 respectively shows estimates of
required CTV to PTV margins from a selection of stu-
dies without [5,13,16-23] and with [5,7,10,13,20-24] the
use of image guidance. As with the quantification of
intra-fraction motion, a variety of different techniques
have been used to estimate margin requirements, and
the level of confidence of target coverage with the speci-
fied margins varies between different reports, making
direct comparisons difficult. What can be concluded,
however, is that the use of image guidance techniques
permits the use of narrower CTV to PTV margins than
if these techniques are not used. While our estimates of
CTV to PTV margin requirements along the S – Iand
A – P axes are comparable to other reports, our esti-
mate of margin r equirement along the L – Raxis
appears to be slightly larger than in the other reports
using image guidance. This is related to our larger esti-
mate of intra-fraction motion along this axis, for reasons
outlined in the previous paragraph. Since margins along
the L-R axis have the least effect on treatment morbid-
ity, there is probably little to be gained from a method
that provides more precise estimates of IFM.
Our estimates of intrafraction motion, and therefore
of CTV to PTV margin requirements, are based on a
single pair of orthogonal during-treatment EPIs for each
fraction, which were compared with a corresponding
pair of pre-treatment EPIs. This might under or over-
estimate the true extent of intra-fraction motion. The
use of electromagnetic transponders [13] and cine-MRI
imaging [14] have shown that the prostate can move
throughout the course of a single radiation treatment. If
either or both of the pair of EPI s happened to capture a
transient extrem e in position of the prostat e, this might
lead to incorrect conclusions about the required size of
the CTV to PTV margins, at least if this happened in a
systematic way. Whether or not the estimated CTV to
PTV margin requirements in figures 1 and 2 (without
and with image guidance) are accurate, however, the
relative reductions in PTV margins that are possible
with our image guidance protocol are likely to be real,
since under or overestimation of intra-fraction motion
should be a random process and should therefore occur
similarly whether or not image guidance is being used.
Conclusions
In the radiotherapy of localized prostate ca ncer, an
image guidance strategy using implanted fiducial mar-
kers, daily pre-treatment portal imaging, and adjustment
of isocenter position based on pre-defined criteria, per-
mits the u se of narrower CTV to PTV margins, and a
smaller PTV volume, without compromising coverage of
the target. The CTV to PTV margins used in this study
(1.0 cm along all axes except 0.5 cm posteriorly) pro-
vided reliable coverage of the target with maximum
sparing of the rectum. Although the anterior, L-R and
S-I CTV to PTV margins of 1.0 cm appear over-gener-
ous, they may be justifiable to account for contouring
uncertainty and/or microscopic disease extension. Any
strategy that p ermits the use of narrower CTV to PTV
margins may allow for safe dose escalation, which may
improve the outcome of radical RT for prostate cancer.
Acknowledgements
This work was supported by grants from the Calgary Health Region Prostate
Cancer Research Competition (2004) and the Alberta Cancer Board Research
Initiative Program (2004). The following radiation oncologists contributed
patients to this study. Tom Baker Cancer Center, Calgary AB Canada: Steve
Angyalfi, Alex Balogh, Siraj Husain, Harold Lau, David Skarsgard, Jackson Wu;
Saskatoon Cancer Center, Saskatoon SK Canada: Ali El-Gayed, David
Skarsgard; Cross Cancer Institute, Edmonton AB Canada: Robert Pearcey,
Nadeem Pervez; Allan Blair Memorial Clinic, Regina SK Canada: Patricia Tai,
Kurian Joseph, Evgeny Sadikov. We are also grateful to radiation therapists
Lindsay Braithwaite (Tom Baker Cancer Center) and Colette Schiltz
(Saskatoon Cancer Center).
Author details
1
Department of Radiation Oncology, Tom Baker Cancer Center and
University of Calgary; 1331 29 St NW, Calgary AB, T2N 4N2, Canada.
2
Department of Medical Physics, Saskatoon Cancer Center; 20 Campus Drive,
Saskatoon SK, S7N 4H4, Canada.
3
Department of Radiation Oncology,
Saskatoon Cancer Center; 20 Campus Drive, Saskatoon SK, S7N 4H4, Canada.
4
Department of Radiation Oncology, Cross Cancer Institute; 11560 University
Ave, Edmonton AB, T6G 1Z2, Canada.
5
Department of Radiation Oncology,
Allan Blair Cancer Center; 4101 Dewdney Avenue, Regina SK, S4T 7T1,
Canada.
Authors’ contributions
JW designed the study, with assistance from DS and RP. PC analyzed the
data. All authors helped to interpret the findings. DS wrote the manuscript,
which was approved by all authors.
Competing interests
The authors declare that they have no competing interests.
Skarsgard et al. Radiation Oncology 2010, 5:52
/>Page 10 of 11
Received: 3 March 2010 Accepted: 10 June 2010
Published: 10 June 2010
References
1. Zietman A, DeSilvio M, Slater J, Rossi C, Miller D, Addams J, Shipley W:
Comparision of conventional-dose vs high-dose conformal radiation
therapy in clinically localized adenocarcinoma of the prostate: a
randomized clinical trial. JAMA 2005, 294:1233-1239.
2. Peeters S, Heemsbergen W, Koper P, van Putten W, Slot A, Dielwart M,
Bonfrer J, Incrocci L, Lebesque J: Dose-response in radiotherapy for
localized prostate cancer: results of the Dutch multicenter randomized
phase III trial comparing 68 Gy of radiotherapy with 78 Gy. J Oncol Pract
2006, 24:1990-1996.
3. Kuban D, Tucker S, Dong L, Starkschall G, Huang E, Cheung M, Lee A,
Pollack A: Long-term results of the M.D. Anderson randomized dose-
escalation trial for prostate cancer. Int J Radiat Oncol Biol Phys 2008,
70:67-74.
4. Skwarchuk M, Jackson A, Zelefsky M, Venkatraman E, Cowen D, Levegrun S,
Burman C, Fuks Z, Leibel S, Ling C: Late rectal toxicity after conformal
radiotherapy of prostate cancer (I): multivariate analysis and dose-
response. Int J Radiat Oncol Biol Phys 2000, 47:103-113.
5. van der Heide U, Kotte A, Dehnad H, Hofman P, Lagenijk J, van Vulpen M:
Analysis of fiducial marker-based position verification in the external
beam radiotherapy of patients with prostate cancer. Radiother Oncol
2007, 82:38-45.
6. Antolak J, Rosen I, Childress C, Zagars G, Pollack A: Prostate target volume
variations during a course of radiotherapy. Int J Radiat Oncol Biol Phys
1998, 42:661-672.
7. Cheung P, Sixel K, Morton G, Loblaw D, Tirona R, Pang G, Choo R,
Szumacher E, DeBoer G, Pignol J-P: Individualized PTV for intrafraction
motion during hypofractionated IMRT boost for prostate cancer. Int J
Radiat Oncol Biol Phys 2005, 62:418-425.
8. Aubry J-F, Beaulieu L, Girouard L-M, Aubin S, Tremblay D, Laverdière J,
Vigneault E: Measurements of intrafraction motion and interfraction and
intrafraction rotation of prostate by three-dimensional analysis of daily
portal imaging with radiopaque markers. Int J Radiat Oncol Biol Phys 2004,
60:30-39.
9. Chung P, Haycocks T, Brown T, Cambridge Z, Kelly V, Alasti H, Jaffray D,
Catton C: On-line aSi portal imaging of implanted fiducial markers for
the reduction of interfraction error during conformal radiotherapy of
prostate carcinoma. Int J Radiat Oncol Biol Phys 2004, 60:329-334.
10. Wu J, Haycocks T, Alasti H, Ottewell G, Middlemiss N, Abdolell M, Warde P,
Toi A, Catton C: Positioning errors and prostate motion during conformal
prostate radiotherapy using on-line isocenter set-up verification and
implanted prostate markers. Radiother Oncol 2001, 61:127-133.
11. Letourneau D, Martinez A, Lockman D, Yan D, Vargas C, Ivaldi G, Wong J:
Assessment of residual error for online cone-beam CT-guided treatment
of prostate cancer patients. Int J Radiat Oncol Biol Phys 2005,
62:1239-1246.
12. Nederveen A, Van Der Heide U, Dehnad H, Van Moorselaar R, Hofman P,
Lagenduk J: Measurements and clinical consequences of prostate motion
during a radiotherapy fraction. Int J Radiat Oncol Biol Phys 2002,
53:206-214.
13. Litzenberg D, Balter J, Hadley S, Sandler H, Willoughby T, Kupelian P,
Levine L: Influence of intrafraction motion on margins for prostate RT. Int
J Radiat Oncol Biol Phys 2006, 65:548-553.
14. Ghilezan M, Jaffray D, Siewerdsen J, Van Herk M, Shetty A, Sharpe M, Jafri S,
Vicini F, Matter R, Brabbins D, Martinez A: Prostate gland motion assessed
with cine-magnetic resonance imaging (cine-MRI). Int J Radiat Oncol Biol
Phys 2005, 62:406-417.
15. Huang E, Dong L, Chandra A, Kuban D, Rosen I, Evans A, Pollack A:
Intrafraction prostate motion during IMRT for prostate cancer. Int J
Radiat Oncol Biol Phys 2002, 53:261-268.
16. Stroom J, Koper P, Korevaar G, van Os M, Janssen M, de Boer H,
Levandag P, Heijmen B: Internal organ motion in prostate cancer patients
treated in prone and supine position. Radiother Oncol 1999, 51:237-248.
17. Van Herk M, Remeijer P, Rasch C, Lebesque J: The probability of correct
target dosage: dose-population histograms for deriving treatment
margins in radiotherapy. Int J Radiat Oncol Biol Phys 2000, 47:1121-1135.
18. Poli M, Parker W, Patrocinio H, Souhami L, Shenouda G, Campos L,
Podgorsak E: An assessment of PTV margin definitions for patients
undergoing conformal 3D external beam radiation therapy for prostate
cancer based on an analysis of 10,327 pretreatment daily ultrasound
localizations. Int J Radiat Oncol Biol Phys 2007, 67:1430-1437.
19. Tinger A, Michalski JM, Cheng A, Low D, Zhu R, Bosch W, Purdy J, Perez C:
A critical evaluation of the planning target volume for 3-D conformal
radiotherapy of prostate cancer. Int J Radiat Oncol Biol Phys 1998,
42:213-221.
20. Meijer G, de Klerk J, Bzdusek K, van den Berg H, Janssen R, Kaus M,
Rodrigus P, van der Toorn P-P: What CTV-to-PTV margins should be
applied for prostate irradiation? Four-dimensional quantitative
assessment using model-based deformable image registration
techniques. Int J Radiation Oncology Biol Phys 2008, 72:1416-25.
21. Beltran C, Herman M, Davis B: Planning target margin calculations for
prostate radiotherapy based on intrafraction and interfraction motion
using four localization methods. Int J Radiation Oncology Biol Phys 2008,
70:289-95.
22. Nairz O, Merz F, Deutschmann H, Kopp P, Schöller H, Zehentmayr F,
Wurstbauer K, Kametriser G, Sedlmayer F: A strategy for the use of image-
guided radiotherapy (IGRT) on linear accelerators and its impact on
treatment margins for prostate cancer patients. Strahlenther Onkol 2008,
184:663-7.
23. Graf R, Wust P, Budach V, Boehmer D: Potentials of on-line repositioning
based on implanted fiducial markers and electronic portal imaging in
prostate cancer radiotherapy. Radiation Oncology 2009, 4:13.
24. Wu Q, Ivaldi G, Liang J, Lockman D, Yan D, Martinez A: Geometric and
dosimetric evaluations of an online image-guidance strategy for 3D-CRT
of prostate cancer. Int J Radiat Oncol Biol Phys 2006, 64:1596-1609.
doi:10.1186/1748-717X-5-52
Cite this article as: Skarsgard et al.: Planning target volume margins for
prostate radiotherapy using daily electronic portal imaging and
implanted fiducial markers. Radiation Oncology 2010 5:52.
Submit your next manuscript to BioMed Central
and take full advantage of:
• Convenient online submission
• Thorough peer review
• No space constraints or color figure charges
• Immediate publication on acceptance
• Inclusion in PubMed, CAS, Scopus and Google Scholar
• Research which is freely available for redistribution
Submit your manuscript at
www.biomedcentral.com/submit
Skarsgard et al. Radiation Oncology 2010, 5:52
/>Page 11 of 11