Báo cáo khoa học: "Independent position correction on tumor and lymph nodes; consequences for bladder cancer irradiation with two combined IMRT plan" pptx
Bạn đang xem bản rút gọn của tài liệu. Xem và tải ngay bản đầy đủ của tài liệu tại đây (794.19 KB, 9 trang )
van Rooijen et al. Radiation Oncology 2010, 5:53
/>Open Access
RESEARCH
© 2010 van Rooijen et al; licensee BioMed Central Ltd. This is an Open Access article distributed under the terms of the Creative Com-
mons Attribution License ( which permits unrestricted use, distribution, and reproduc-
tion in any medium, provided the original work is properly cited.
Research
Independent position correction on tumor and
lymph nodes; consequences for bladder cancer
irradiation with two combined IMRT plans
Dominique C van Rooijen*, René Pool, Jeroen B van de Kamer, Maarten CCM Hulshof, Caro CE Koning and Arjan Bel
Abstract
Background: The application of lipiodol injections as markers around bladder tumors combined with the use of CBCT
for image guidance enables daily on-line position correction based on the position of the bladder tumor. However, this
might introduce the risk of underdosing the pelvic lymph nodes. In this study several correction strategies were
compared.
Methods: For this study set-up errors and tumor displacements for ten complete treatments were generated; both
were based on the data of 10 bladder cancer patients. Besides, two IMRT plans were made for 20 patients, one for the
elective field and a boost plan for the tumor. For each patient 10 complete treatments were simulated. For each
treatment the dose was calculated without position correction (option 1), correction on bony anatomy (option 2), on
tumor only (option 3) and separately on bone for the elective field (option 4). For each method we analyzed the D
99%
for the tumor, bladder and lymph nodes and the V
95%
for the small intestines, rectum, healthy part of the bladder and
femoral heads.
Results: CTV coverage was significantly lower with options 1 and 2. With option 3 the tumor coverage was not
significantly different from the treatment plan. The ΔD
99%
(D
99%, option n
- D
99%, treatment plan
) for option 4 was small, but
significant. For the lymph nodes the results from option 1 differed not significantly from the treatment plan. The
median ΔD
99%
of the other options were small, but significant. ΔD
99%
for PTV
bladder
was small for options 1, 2 and 4, but
decreased up to -8.5 Gy when option 3 was applied. Option 4 is the only method where the difference with the
treatment plan never exceeds 2 Gy. The V
95%
for the rectum, femoral heads and small intestines was small in the
treatment plan and this remained so after applying the correction options, indicating that no additional hot spots
occurred.
Conclusions: Applying independent position correction on bone for the elective field and on tumor for the boost
separately gives on average the best target coverage, without introducing additional hot spots in the healthy tissue.
Background
External beam radiotherapy is the treatment of choice for
bladder cancer patients unfit for a radical cystectomy or
willing to preserve their bladder function. Conventional
radiotherapy generally consists of irradiation of the entire
bladder. However, when the tumor is unifocal, a focal
tumor boost has been shown to provide a high local con-
trol rate with acceptable toxicity [1,2]. In focal bladder
cancer irradiation, however, the large day-to-day varia-
tion of the tumor position causes a major problem [3-8].
The implementation of image-guided radiotherapy
(IGRT) and daily on-line position correction for unifocal
bladder tumors will reduce the positional uncertainty and
could enable margin reduction.
At our department, bladder tumor irradiation involves
additional pelvic lymph node irradiation by an elective
field. The movement of the lymph nodes with respect to
the bony anatomy is relatively small [9] and is indepen-
dent of the movement of the bladder. Therefore the
implementation of on-line position correction for the
* Correspondence:
1
Department of Radiation Oncology, Academic Medical Center, Amsterdam,
T
he Netherlands
Full list of author information is available at the end of the article
van Rooijen et al. Radiation Oncology 2010, 5:53
/>Page 2 of 9
bladder tumor might introduce the risk of underdosing
the pelvic lymph nodes. A couple of studies have
addressed this problem for the prostate and two possible
correction methods are proposed.
Ludlum et al. have developed an algorithm that adjusts
the position of the MLC leaves conformal to the prostate,
while keeping the other leaves unchanged [10]. The ratio-
nale behind this correction method is that the table posi-
tion correction does not have to be applied for the tumor
and bone separately. Unfortunately, it is currently not
possible to adjust the leaves during treatment.
Rossi et al. show that a considerable degradation of the
delivered dose to the pelvic lymph nodes might occur
when on-line position correction is applied based on the
prostate position [11]. They propose to start the treat-
ment with the execution of the boost plan. After a num-
ber of fractions, the uncertainty of the prostate position
can be estimated and with that the PTV margin for the
lymph nodes can be determined. For the bladder treat-
ment used at our department this method is not an
option, because the lymph nodes are being irradiated in
almost all fractions. Hence, the uncertainty of the tumor
position cannot be estimated before the treatment of the
lymph nodes starts.
Our proposal is to make two treatment plans and cor-
rect them separately, despite the overhead of additional
image analysis and possible couch correction. The pur-
pose of this study is to investigate if the plans can be sep-
arated and moved without losing either tumor or bladder
and lymph node coverage. This correction strategy is
compared with correction on bony anatomy, correction
on tumor position and no position correction.
Methods
Patients and prescribed dose
This simulation study included 20 patients with a histo-
logically proven bladder tumor who received a treatment
at our department. Our current department policy is to
prescribe 55 Gy if the tumor is close to the small intes-
tines and 60 Gy if the small intestines are not at risk. Ten
patients were given a prescribed dose of 55 Gy on the
tumor and ten patients were given a prescribed dose of 60
Gy. For all patients an elective dose of 40 Gy was pre-
scribed to the lymph nodes and healthy part of the blad-
der. The patients were treated with a full bladder. They
were instructed to void the bladder and drink 250 cc of
water one hour before the treatment.
All patients were actually treated with our current tech-
nique [1]. The patients who were treated with 55 Gy,
received 20 fractions of 2 Gy to the elective field and a
concomitant boost of 0.75 Gy to the tumor. The patients
who were treated with 60 Gy, received the same schedule
as the 55 Gy patients in the first 20 fractions, with two
subsequent fractions of 2.5 Gy to the tumor.
Delineation and treatment planning
For all patients a planning CT with 3 mm slices was
acquired with the patient in supine position. Before the
planning CT was acquired lipiodol was injected under
cystoscopic guidance on 3 to 5 locations, thereby indicat-
ing the border of the tumor [12]. Lipiodol is a contrast
medium that is visible on CT as well as on CBCT. The lip-
iodol guided the GTV delineation and it enabled on-line
position verification. More details regarding the clinical
application of the lipiodol injections were given by Pos et
al. [12]. The lipiodol spots remained visible throughout
the entire course of radiotherapy. The tumor was delin-
eated by an experienced radiation oncologist. The delin-
eated tumor volume was defined as CTV [13]. The
bladder, rectum, pelvic lymph nodes, femoral heads and
small bowel were delineated as well.
In consideration of daily on-line position correction, a
CTV - PTV
tumor
margin of 5 mm and a lymph node (ln) -
PTV
ln
margin of 5 mm were chosen [14]. Because the
bladder volume has a substantial day-to-day variation we
opted for a bladder - PTV
bladder
margin of 20 mm in the
cranial and anterior direction and 10 mm in the posterior,
lateral and caudal direction.
Intensity modulated radiotherapy (IMRT) plans were
made with the planning system PLATO (Nucletron BV,
Veenendaal, The Netherlands), using an energy of 10 MV.
The following beam angles were used for each plan: 40°,
110°, 180°, 250° and 320°. Two separate IMRT plans were
made. The first plan was the boost of 15 Gy to the tumor
in 20 fractions and the second plan was 40 Gy to the elec-
tive field in 20 fractions. Both plans were administered in
each fraction, with the option to adjust the patient posi-
tion in between the execution of both plans. After 20
fractions, the patients with a prescribed dose of 60 Gy
received an additional boost of 5 Gy on the tumor in 2
fractions. To prevent overdosage and hotspots, the dose
of the boost plans was taken into account while making
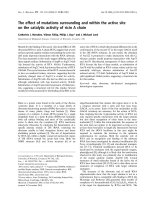
the elective plan. Figure 1 shows an example of the dose
distribution of a boost plan, an elective plan and the com-
posite dose distribution.
The requirement of the plans was that 99% of the vol-
ume of the target received 95% of the prescribed dose,
which is 52.25 Gy or 57 Gy for the PTV
tumor
and 38 Gy for
the PTV
bladder
and PTV
ln
.
Simulation of tumor displacement and correction
The lipiodol that was injected to guide the delineation of
the tumor can also be used as marker for on-line position
verification [15]. The set-up error and tumor displace-
ment of ten bladder cancer patients with 5 to 9 CBCT
scans were determined using XVI release 3.5 (Elekta,
Crawley, UK) for the registration. The set-up error was
the result of the match on the bony anatomy and the
van Rooijen et al. Radiation Oncology 2010, 5:53
/>Page 3 of 9
tumor displacement was the displacement of the tumor
with respect to the bony anatomy. For each of the ten
patients the mean set-up error (± sd) and the mean tumor
displacement (± sd) were determined in each direction.
From this, set-up errors and tumor displacements of ten
complete treatments were generated using a Monte Carlo
generator, assuming a Gaussian distribution. The gener-
ated distributions of deviations were applied for all 20
patients for whom IMRT plans were made, resulting in
200 simulated treatments. For the dose calculation the
body was displaced with respect to the beams to simulate
set-up errors. In addition, the delineated tumor was
moved with respect to the bony anatomy to simulate
tumor movement (figure 2). A full dose calculation was
done for every fraction and afterwards the dose was sum-
mated for each organ separately. All reported results are
therefore the results of a complete treatment. For each
treatment, the dose distribution was calculated for the
following four situations:
1. No position correction
2. Daily position correction based on the bone match
for both plans
3. Daily position correction based on the tumor
match for both plans
4. Daily position correction based on the bone match
for the elective plan and based on the tumor match
for the boost plan
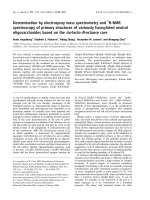
Figure 2 shows an example of a simulated fraction. The
position of the tumor has changed and position correc-
tion has been applied based on the tumor match (option
3). The dose distribution in this new situation was calcu-
lated. This was done for every treatment fraction.
A stand-alone version of PLATO's dose engine was
used for the dose calculations [16]. This PC version of
PLATO was highly optimized for fast dose calculations
on a graphical card [17].
Data analysis
For the bladder, it was less obvious to determine how the
dose was affected by the four correction options. The
bladder volume changes substantially, but these volume
changes were not simulated. Figure 2 shows schematically
what was simulated. To determine the hot spots in the
bladder, the bladder was shifted with the tumor in the
simulation. The rationale behind this was that the hot
spots were expected to be near the tumor. In the case that
the bladder was considered as a target, we analyzed the
PTV
bladder
, because the PTV is supposed to cover the
whole bladder and possible volume changes were incor-
porated in the margin.
Results
Tumor displacement data
For ten patients, the mean set-up error (± sd) and the
mean tumor displacement (± sd) were determined for
each main direction. The tumor displacement was deter-
mined with respect to the bony anatomy. The results for
all patients are shown in table 1. Most of the systematic
set-up errors were within 2 mm, with one exception of 4.4
Figure 2 Schematic representation of simulation. The black lines
represent a CT slice of the patient in the treatment planning situation.
The red tumor represents the tumor after internal displacement. For
analyzing the hot spots in the bladder, the bladder moves with the tu-
mor. The red lines represent the treatment beams when position cor-
rection based on tumor position (option 3) is applied.
Figure 1 Dose distributions. An example of the dose distribution in Gy of a boost plan (a), an elective plan (b) and the composite plan (c) for one
patient.
a b
c
van Rooijen et al. Radiation Oncology 2010, 5:53
/>Page 4 of 9
Table 1: The match results of ten bladder cancer patients
Tumor
MLR (mm ± sd) MCC (mm ± sd) MDV (mm ± sd)
Vector length V (mm)
Patient 1 1.4 (± 1.1) -1.4 (± 1.1) -4.4 (± 1.6) 4.8
Patient 2 0.4 (± 0.7) 1.3 (± 2.6) -7.4 (± 1.3) 7.5
Patient 3 -0.9 (± 1.4) 2.3 (± 1.9) 4.2 (± 4.5) 4.9
Patient 4 2.7 (± 1.0) -5.9 (± 4.1) 0.5 (± 3.8) 6.5
Patient 5 0.3 (± 0.8) -1.9 (± 1.8) 0.7 (± 1.8) 2.1
Patient 6 -0.4 (± 1.1) -4.7 (± 3.3) -1.5 (± 1.8) 4.9
Patient 7 2.4 (± 1.6) 5.0 (± 2.1) 3.5 (± 3.0) 6.6
Patient 8 2.4 (± 1.6) -2.8 (± 4.6) 1.0 (± 3.3) 3.8
Patient 9 0.4 (± 2.5) -6.0 (± 4.6) -3.6 (± 2.4) 7.0
Patient 10 1.0 (± 0.9) -1.6 (± 3.1) 6.5 (± 4.5) 6.8
Set-up
Patient 1 0.6 (± 1.2) 1.0 (± 2.3) 1.6 (± 1.4)
Patient 2 -0.9 (± 4.6) -1.0 (± 2.2) 0.2 (± 3.4)
Patient 3 -1.9 (± 2.0) 0.0 (± 0.9) -2.5 (± 3.7)
Patient 4 -0.8 (± 6.0) 0.6 (± 2.1) -0.2 (± 2.3)
Patient 5 2.1 (± 2.8) -1.1 (± 1.8) 0.0 (± 2.1)
Patient 6 -1.7 (± 3.9) 1.8 (± 1.1) -1.3 (± 2.9)
Patient 7 -2.7 (± 2.4) -0.4 (± 1.0) 2.3 (± 1.4)
Patient 8 -1.4 (± 3.5) 1.2 (± 4.6) -2.3 (± 2.1)
Patient 9 -1.4 (± 0.9) -0.3 (± 1.3) -4.4 (± 0.7)
Patient 10 -2.1 (± 2.7) 0.8 (± 0.7) -1.1 (± 0.7)
The upper half of the table shows the results of the tumor registration. The lower half shows the results of the registration on bony anatomy.
M
LR
is the mean in the left-right direction; M
CC
is the mean in the craniocaudal direction and M
DV
is the mean in the dorsoventral direction.
The vector length V is the absolute tumor displacement and is defined as:
VM M M
LR CC AP
=++
22 2
van Rooijen et al. Radiation Oncology 2010, 5:53
/>Page 5 of 9
mm. The results of the tumor registration showed more
variation. The systematic tumor displacement ranged
from 0.3 mm to 7.4 mm in a single direction. All simula-
tions in this study were based on these displacement data.
Targets
Because ΔD
99%
was not normally distributed we report
the median ΔD
99%
(range) and the data were tested with
the Wilcoxon signed rank test. For the CTV the correc-
tion based on tumor match (option 3) was the only strat-
egy in which the D
99%
of the tumor was not statistically
significant lower than in the treatment plan (p = 0.33).
The median ΔD
99%
of this option was 0.01 Gy (range: -
0.44 to 0.46). The D
99%
of all other treatment options was
significantly lower (p < 0.001) than in the treatment plan
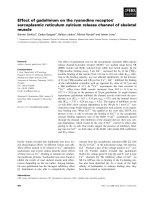
(table 2). However, figure 3 shows that for option 4 most
simulations resulted in a ΔD
99%
of less than 1.0 Gy, where
for option 1 and 2 the ΔD
99%
exceeds 2.0 Gy in a number
of simulations.
For the lymph nodes option 1 (no correction) was not
statistically significant different from the treatment plan
(table 2). When option 2 was applied (correction on bony
anatomy), the median ΔD99% was 0.01 Gy (range -0.11 to
0.36). This small difference was significant (p < 0.001),
because the data were not normally distributed and the
positive values were larger than the negative values. Cor-
rection based on tumor coverage (option 3) gives the low-
est target coverage for the lymph nodes (figure 4).
For the bladder as target we analyzed the PTV
bladder
,
because the possible volume change is incorporated in
the CTV-PTV margin. When option 3 was applied
underdosages up to 8.5 Gy can occur (figure 5).
Option 4 is the method that gives the highest coverage
in all targets. The difference with the treatment plan
never exceeded 2 Gy in all 200 simulations.
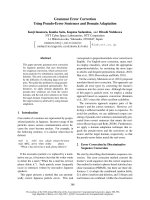
Hot spots
The V
95%
of the small intestines in the treatment plan was
very small, the median was 0.0 cc (range 0 - 28.9 cc) and
remained small after application of any of the four
options (figure 6a). The V
95%
of the rectum in the treat-
ment plan was also small, the median was 0.6% (range 0-
18.7) and remained small after application of any of the
four options (figure 6b). One patient had undergone rec-
tum resection in the past, so the results for rectum are for
19 patients. The V
95%
of the femoral heads was zero for all
options in all patients.
For the bladder as OAR, we determined the hot spots in
the same way as for the small intestines and the rectum,
except that movement was simulated for the bladder. The
V
95%
for the bladder was much larger than that of the
other OARs (figure 6c). This was expected because the
tumor is a part of the bladder wall. Hence, the PTV over-
laps with the bladder. The bladder itself is also a target.
Discussion
The goal of this study was to investigate the possibilities
to separate the treatment plans for the boost and the elec-
tive field and move them independently without adverse
effects. We found that the dose in all targets (tumor, blad-
der and lymph nodes) is adequate when position correc-
tion was applied separately for tumor and bony anatomy
(option 4). This method offers several benefits. First, the
table can be corrected with millimeter accuracy. In addi-
tion, the margins on both tumor and lymph nodes can be
minimized. Moreover, the technique is instantly available
for clinical practice.
When the median ΔD
99%
of each treatment option is
considered, the difference between all four correction
strategies is relatively small (table 2) and the question
arises whether position correction is necessary for this
patient group. However, it is clear that patients with a
large systematic tumor displacement benefit from the
application of position correction while position correc-
tion for patients with a small systematic tumor displace-
ment does not seem necessary (figures 3 to 5).
Unfortunately it cannot be predicted in which patients
large systematic tumor displacement will occur. Five out
Table 2: The ΔD
99%
(D
99%, option n
- D
99%, treatment plan
) of the targets with the four correction options
Option 1Option 2Option 3Option 4
GTV -0.41 Gy *
(-2.44 - 0.51)
-0.45 Gy *
(-2.32 - 0.39)
0.02 Gy
(-0.44 - 0.46)
-0.06 Gy *
(-1.27 - 0.48)
Lymph nodes 0.01 Gy
(-1.09 - 0.91)
0.01 Gy *
(-0.11 - 0.36)
-0.09 Gy *
(-4.21 - 1.65)
0.08 Gy *
(-1.77 - 1.60)
PTV
bladder
-0.05 Gy *
(-3.32 - 0.7)
0.01 Gy
(-0.2 - 0.17)
-0.99 Gy *
(-8.45 - 0.95)
-0.07 Gy *
(-1.21 - 1.34)
The results are displayed as: median (range)
* P-value significant
van Rooijen et al. Radiation Oncology 2010, 5:53
/>Page 6 of 9
Figure 3 CTV coverage. These figures show the ΔD
99%
of the CTV versus the tumor displacement vector for the four correction strategies. Note that
some of the tumor displacement vector lengths overlap (see table 1)
CTV Option 1
-4
-3
-2
-1
0
1
02468
Tumor displacement (mm)
'
D
99%
(Gy)
a
CTV Option 2
-4
-3
-2
-1
0
1
02468
Tumor displacement (mm)
'
D
99%
(Gy)
b
CTV Option 3
-4
-3
-2
-1
0
1
02468
Tumor displacement (mm)
'
D
99%
(Gy)
c
CTV Option 4
-4
-3
-2
-1
0
1
02468
Tumor displacement (mm)
'
D
99%
(Gy)
d
Figure 4 Lymph node coverage. These figures show the ΔD
99%
of the lymph nodes versus the tumor displacement vector for the four correction
strategies. Note that some of the tumor displacement vector lengths overlap (see table 1)
Lymph nodes Option 1
-5
-4
-3
-2
-1
0
1
2
02468
Tumor displacement (mm)
'
D
99%
(Gy)
a
Lymph nodes Option 2
-5
-4
-3
-2
-1
0
1
2
02468
Tumor displacement (mm)
'
D
99%
(Gy)
b
Lymph nodes Option 3
-5
-4
-3
-2
-1
0
1
2
02468
Tumor displacement (mm)
'
D
99%
(Gy)
c
Lymph nodes Option 4
-5
-4
-3
-2
-1
0
1
2
02468
Tumor displacement (mm)
'
D
99%
(Gy)
d
van Rooijen et al. Radiation Oncology 2010, 5:53
/>Page 7 of 9
Figure 5 PTV
bladder
coverage. These figures show the ΔD
99%
of the PTV
bladder
versus the tumor displacement vector for the four correction strategies.
Note that some of the tumor displacement vector lengths overlap (see table 1)
PTV
bladder
Option 1
-10
-8
-6
-4
-2
0
2
02468
Tumor displacement (mm)
'
D
99%
(Gy)
a
PTV
bladder
Option 4
-10
-8
-6
-4
-2
0
2
02468
Tumor displacement (mm)
'
D
99%
(Gy)
d
PTV
bladder
Option 3
-10
-8
-6
-4
-2
0
2
02468
Tumor displacement (mm)
'
D
99%
(Gy)
c
PTV
bladder
Option 2
-10
-8
-6
-4
-2
0
2
02468
Tumor displacement (mm)
'
D
99%
(Gy)
b
Figure 6 Hot spots. Hot spots (volume that receives more than 95% of the prescription dose) of the small intestines, rectum and bladder.
Small intestines
option1 option2 option3 option4 plan
Volume (cc)
0
10
20
30
40
50
a
Bladder
option1 option2 option3 option4 plan
Volume (%)
0
10
20
30
40
50
60
70
c
Rectum
option1 option2 option3 option4 plan
Volume (%)
0
5
10
15
20
25
30
b
van Rooijen et al. Radiation Oncology 2010, 5:53
/>Page 8 of 9
of the ten patients that were used to determine the sys-
tematic and random displacement have a tumor displace-
ment vector length of more than 6 mm and those patients
will have decreased tumor coverage when no position
correction or position correction based on bony anatomy
was applied.
The hot spots in the OARs do not significantly change
when position correction is applied, indicating that it is a
safe procedure.
Hsu et al. found that in case of prostate and lymph node
treatment, the dose in the lymph nodes decreased with
less than 1% when position correction based on the pros-
tate position was applied [9]. However, they have simu-
lated random displacements only of which the effect will
probably cancel out in a treatment of more than 20 frac-
tions. They also show that large dose decreases occur in
individual fractions, indicating that the nodal coverage
can decrease when large systematic displacements occur.
Ludlum et al. and Rossi et al. also conclude that the dose
in the lymph nodes decreases if there is a large systematic
error in the prostate position [10,11].
Theoretically, the dose in the lymph nodes in option 2
(correction on bony anatomy) and the treatment plan
should be exactly the same, because no movement of the
lymph nodes was simulated and perfect position correc-
tion was applied (figure 4). The minor difference, 0.01 Gy
(± 0.03) on average, is caused by the algorithm used for
the dose-volume histogram (DVH) calculation. The dose
in 10,000 random points in each organ was determined
for the DVH of the treatment plan. During the dose cal-
culation of each simulated treatment new random points
were generated.
This study only considered translations. Rotations and
deformations were neglected. The main goal of this study
was to investigate whether the lymph nodes are being
irradiated sufficiently when IGRT is applied on the blad-
der tumor. Translations are the only uncertainties that we
can currently correct for in our department. However, we
also determined the CTV coverage in this study, without
simulating rotations and deformations. Rotations are
rather small, as demonstrated by Lotz et al [4]. Present lit-
erature on bladder tumor deformation is not unequivo-
cal. Lotz et al found that bladder tumor tissue is very rigid
and that only small deformations occur [4]. However,
Chai et al found that deformations are small when the
tumor is small, but significant deformation was found for
tumors with an elongated shape [15]. The possible impact
of these deformations on the dose will need to be investi-
gated.
A drawback of daily on-line position verification and
correction is an increase in treatment time. During the
period required for the image acquisition and evaluation
the bladder volume can increase and the tumor might
move again. This additional uncertainty should be incor-
porated in the applied margin, but is expected to be com-
pensated by the increased accuracy. In this study, every
simulated tumor displacement and set-up error was cor-
rected for, without applying a threshold. We expect a
minimal effect on the dose when displacements of a few
millimeters are not corrected, considering the standard
applied safety margins. When a robotic couch can be
used on a large scale and the radiotherapy technologists
do not have to enter the treatment room anymore to cor-
rect the table position, carrying out small corrections on
a daily basis will become clinically applicable.
Conclusions
Based on this study we conclude that applying indepen-
dent position correction on bone for the elective field and
on tumor for the boost gives on average the best target
coverage, without introducing additional hot spots in the
healthy tissue.
Competing interests
This work was supported by a grant from Elekta.
Authors' contributions
DR made the IMRT plans for this study, did the simulations and the statistical
analysis and is the main author of the manuscript. JK gave support with treat-
ment planning and the design of the study. RP and AB provided the software
for the simulation. MH delineated the structures necessary for treatment plan-
ning. AB gave support with the statistics. AB, CK and JK were the senior
researchers and provided coordination during the study. JK, RP, MH, CK and AB
reviewed the manuscript. All authors have read and approved the manuscript.
Acknowledgements
The authors would like to thank Elekta (Crawley, United Kingdom) for the gen-
erous grant to support this research. Nucletron (Veenendaal, the Netherlands)
is acknowledged for providing the source code of PLATO's dose algorithm.
Author Details
Department of Radiation Oncology, Academic Medical Center, Amsterdam,
The Netherlands
References
1. Pos FJ, van Tienhoven G, Hulshof MC, Koedooder K, Gonzalez Gonzalez D:
Concomitant boost radiotherapy for muscle invasive bladder cancer.
Radiother Oncol 2003, 68:75-80.
2. Piet AH, Hulshof MC, Pieters BR, Pos FJ, de Reijke TM, Koning CC: Clinical
results of a concomitant boost radiotherapy technique for muscle-
invasive bladder cancer. Strahlenther Onkol 2008, 184:313-318.
3. Fokdal L, Honore H, Hoyer M, Meldgaard P, Fode K, von der Maase H:
Impact of changes in bladder and rectal filling volume on organ
motion and dose distribution of the bladder in radiotherapy for
urinary bladder cancer. Int J Radiat Oncol Biol Phys 2004, 59:436-444.
4. Lotz HT, Pos FJ, Hulshof MC, van Herk M, Lebesque JV, Duppen JC,
Remeijer P: Tumor motion and deformation during external
radiotherapy of bladder cancer. Int J Radiat Oncol Biol Phys 2006,
64:1551-1558.
5. Meijer GJ, Rasch C, Remeijer P, Lebesque JV: Three-dimensional analysis
of delineation errors, setup errors, and organ motion during
radiotherapy of bladder cancer. Int J Radiat Oncol Biol Phys 2003,
55:1277-1287.
6. Miralbell R, Nouet P, Rouzaud M, Bardina A, Hejira N, Schneider D:
Radiotherapy of bladder cancer: relevance of bladder volume changes
in planning boost treatment. Int J Radiat Oncol Biol Phys 1998,
41:741-746.
Received: 6 April 2010 Accepted: 15 June 2010
Published: 15 June 2010
This article is available from: 2010 van Rooijen et al; licensee BioMed Central Ltd. This is an Open Access article distributed under the terms of the Creative Commons Attribution License ( which permits unrestricted use, distribution, and reproduction in any medium, provided the original work is properly cited.Radiation Onc ology 2010, 5:53
van Rooijen et al. Radiation Oncology 2010, 5:53
/>Page 9 of 9
7. Muren LP, Smaaland R, Dahl O: Organ motion, set-up variation and
treatment margins in radical radiotherapy of urinary bladder cancer.
Radiother Oncol 2003, 69:291-304.
8. Pos FJ, Koedooder K, Hulshof MC, van Tienhoven G, Gonzalez Gonzalez D:
Influence of bladder and rectal volume on spatial variability of a
bladder tumor during radical radiotherapy. Int J Radiat Oncol Biol Phys
2003, 55:835-841.
9. Hsu A, Pawlicki T, Luxton G, Hara W, King CR: A study of image-guided
intensity-modulated radiotherapy with fiducials for localized prostate
cancer including pelvic lymph nodes. Int J Radiat Oncol Biol Phys 2007,
68:898-902.
10. Ludlum E, Mu G, Weinberg V, Roach M III, Verhey LJ, Xia P: An algorithm
for shifting MLC shapes to adjust for daily prostate movement during
concurrent treatment with pelvic lymph nodes. Med Phys 2007,
34:4750-4756.
11. Rossi PJ, Schreibmann E, Jani AB, Master VA, Johnstone PA: Boost first,
eliminate systematic error, and individualize CTV to PTV margin when
treating lymph nodes in high-risk prostate cancer. Radiother Oncol
2009, 90:353-358.
12. Pos F, Bex A, Dees-Ribbers HM, Betgen A, van Herk M, Remeijer P: Lipiodol
injection for target volume delineation and image guidance during
radiotherapy for bladder cancer. Radiother Oncol 2009, 93:364-367.
13. Pos FJ, Hulshof MC, Lebesque JV, Lotz HT, van Tienhoven G, Moonen L,
Remeijer P: Adaptive radiotherapy for invasive bladder cancer: a
feasibility study. Int J Radiat Oncol Biol Phys 2006, 64:862-868.
14. van Rooijen DC, van de Kamer JB, Pool R, Hulshof MC, Koning CC, Bel A:
The effect of on-line position correction on the dose distribution in
focal radiotherapy for bladder cancer. Radiation Oncology 2009, 4:38.
15. Chai X, van Herk M, van de Kamer JB, Remeijer P, Bex A, Betgen A, de
Reijke TM, Hulshof MC, Pos FJ, Bel A: Behavior of lipiodol markers during
image guided radiotherapy of bladder cancer. Int J Radiat Oncol Biol
Phys 2010, 77:309-314.
16. Bel A, van Rooijen DC, Kamphuis M, Pool R: APlan: A 4D treatment
planning evaluation program. Radiother Oncol 2008, 88:S365.
17. de Greef M, Crezee J, van Eijk JC, Pool R, Bel A: Accelerated ray-tracing for
radiotherapy dose calculations on a GPU. Med Phys 2009, 36:4095-4102.
doi: 10.1186/1748-717X-5-53
Cite this article as: van Rooijen et al., Independent position correction on
tumor and lymph nodes; consequences for bladder cancer irradiation with
two combined IMRT plans Radiation Oncology 2010, 5:53