Báo cáo khoa học: "Treatment planning using MRI data: an analysis of the dose calculation accuracy for different treatment regions" ppt
Bạn đang xem bản rút gọn của tài liệu. Xem và tải ngay bản đầy đủ của tài liệu tại đây (1.5 MB, 8 trang )
RESEARC H Open Access
Treatment planning using MRI data: an analysis
of the dose calculation accuracy for different
treatment regions
Joakim H Jonsson
2*
, Magnus G Karlsson
1
, Mikael Karlsson
2
, Tufve Nyholm
3
Abstract
Background: Because of superior soft tissue contrast, the use of magnetic resonance imaging (MRI) as a
complement to computed tomography (CT) in the target definition procedure for radiotherapy is increasing. To
keep the workflow simple and cost effective and to reduce patient dose, it is natural to strive for a treatment
planning procedure based entirely on MRI. In the present study, we investigate the dose calculation accuracy for
different treatment regions when using bulk density assignments on MRI data and compare it to treatment
planning that uses CT data.
Methods: MR and CT data were collected retrospectively for 40 patients with prostate, lung, head and neck, or
brain cancers. Comparisons were made between calculations on CT data with and without inhomogeneity
corrections and on MRI or CT data with bulk density assignments. The bulk densities were assigned using manual
segmentation of tissue, bone, lung, and air cavities.
Results: The deviations between calculations on CT data with inhomogeneity correction and on bulk density
assigned MR data were small. The maximum difference in the number of monitor units required to reach the
prescribed dose was 1.6%. This result also includes effects of possible geometrical distortions.
Conclusions: The dose calculation accuracy at the investigated treatment sites is not significantly compromised
when using MRI data when adequate bulk density assignments are made. With respect to treatment planning, MRI
can replace CT in all steps of the treatment workflow, reducing the radiation exposure to the patient, removing
any systematic registration errors that may occur when combining MR and CT, and decreasing time and cost for
the extra CT investigation.
Background
Computed tomography (CT) has been the basis for
treatment planning since the introduction of 3D confor-
mal radiotherapy because of its availability, high geome-
trical accuracy, and direct connection to electron
density used in dose calculations. From the beginning,
however, it has been clear that CT alone does not
always provide enough information for an accurate deli-
neation of the target vo lume. Magnetic resonance (MR)
imaging adds significant value in delineations of prostate
targets [1-3], brain lesions [4,5], and head and neck
tumors[6]. In additio n, a recent report notes that MR
may help distinguish lung tumors from surrounding
atelectasis[7]. Although clinics now use multimodality
imaging as a basis for target delineation, CT is still the
preferred choice for treatment planning. The use of CT
for treatment planning, however, is not unproblematic.
The extra costs associated with multiple imaging modal-
ities have motivated several groups to study the possibi-
lity of developing treatment plans using only MR images
[8-10]. Other groups refer to the additional uncertainty
introduced with the registrations between CT and MR
as a motivation for treatment planning that directly uses
MR images [10-13]. Errors introduced in the registration
will affect the treatment systematically throughout the
entire treatment period. Prostate and gynecological
patients are especially problematic as the patients can
have different rectal and bladder filling during the
* Correspondence:
2
Radiation Physics Section, Department of Radiation Sciences, Umeå
University, 90187 Umeå, Sweden
Jonsson et al . Radiation Oncology 2010, 5:62
/>© 2010 Jonsson et al; licensee BioMed Central Ltd. This is an Open Access article distributed under the terms of the Creative Commons
Attribu tion License ( .0), which permits unrestricted use, distribution, and repro duction in
any medium, provided the original work is properly cite d.
different imaging sessions. This implies that the registra-
tion result can signif icantly depend on the surrounding
tissues and in itself introduce significant uncertainty
[14,15]. The geometrical distortions and the lack of
electron density information are the main obstacles
associated with using MR images when developing treat-
ment plans.
Geometrical distortions are caused by nonlinearities in
the magnetic gradients, inhomogeneities in the static
magnetic field, and chemical shift or magnetic suscept-
ibility artifacts. In modern M R scanners, the problems
with field inhomogeneities are limited and the strong
gradients have increased the problems with gradient
nonlinearities[16]. Nonlinearities can be characterized
and corrected using spherical harmonics expansions of
the fields generated by the gradient coils[17]. These
algorithms have proved successful[18] and provide ade-
quate geometrical accuracy for radiotherapy purposes
and are now implemented as a standard clinical tool in
the Siemens MR software (ver. B15). Chemical shift arti-
facts and distortions induced by magnetic susceptibility
variations have been investigated with a focus on pros-
tate treatments and the effect is shown to be small for
internal structures relevant for prostate treatments[10].
In general, modern sequences such as 3D turbo spin
echo sequences using relatively high bandwidth reduce
distortions caused by susceptibility differe nces in tissue/
bone and air/tissue interfaces to an ac ceptable level for
radiotherapy.
Modern treatment planning systems often use a con-
version of the Hounsfield nu mbers to relative electron
density to calculate doses. This can be done through use
ofgenericformulas[19]orviaatissuelookuptable.A
look up table can help account for the effects o f varia-
tions in atomic number Z between different tissues, a
technique that can provide more detailed information
about t he cross sections for different interactions. This
can make a significant difference for calculations on
proton or ion beams[20], whereas photon beam calcula-
tions are rather insensitive to uncertainties in the elec-
tron density[21]. There is no relation between MR
image values and electron density as is the case for CT.
One possible way to overcome this is to ignore the var-
iations i n electron density in the patient, i.e., turn off
the inhomogeneity correction. Using this approach to
calculate doses, several groups have noted dose differ-
ences ranging from 0.9% to 2.5% [10,22,23]. For brain
treatments, the difference in dose with and without
inhomogeneity correction has been reported to be in
the range 1-1.5% [13,24]. Segmentation and bulk densit y
assignment of relevant tissues can improve accuracy.
For prostate patients, the average difference in mean
dose to target compared to CT calc ulations has been
reported to be lower than 0.5% with the bulk density
approach [10,23]. For bra in tumors, Kristensen et al.
report mean deviations of the same magnitude[24].
In this study, we verify results from previous work in
thepelvicareaandbrainandfurtherinvestigatethe
dose calculation accur acy for bulk density assigned geo-
metries (synthetic CT) in both the thoracic and the
head and neck regions. We also aim to find the most
suitable bulk densities for pelvic bone, skull bone, and
pulmonary tissue. Finally, we aim to decide whether or
not the dose calculation accuracy for bulk density
assigned MR is sufficient for clinical radiotherapy treat-
ment planning in all investigated areas.
Methods
Subjects
In this retrospective study, we analyzed imaging data
from patients in four different anatomical regions: pros-
tate (n = 10), thorax (n = 10), brain (n = 10), and head
and neck (n = 10). The patients included in each sub-
group were randomly selected. Table 1 lists patients and
data.
Imaging
No images were acquired solely for this study because
imaging with both CT and MR are part of the standard
clinical routine in our department. Prostate and thoracic
patients were imaged in treatment position with the MR
scanner (Espree 1.5 T, Siemens, Erlangen, Germany)
using standard fixation equipment. This was not possi-
ble for the head and neck and brain patients as the fix a-
tion devices were not compatible with the head and
neck coils. A T2 weighted turbo spin echo 3D sequence
(matrix size - 384 × 384, slice thickness - 1. 7 mm, TR -
1500 ms, TE - 209 ms, bandwidth - 592 Hz per pixel)
covering the patient outline in the treatment area was
used for the prostate patients. The thorax patients were
imaged with a half Fourier turbo spin echo-sequence
(matrix size - 320 × 320, slice thickness - 5 mm, TR -
579 ms, TE - 53 ms). A pace navigator was used to
reduce the motion artifacts from breathing. The images
were corrected for geometrical distortions introduced by
nonlinearities in the gradients using the standard Sie-
mens 3D distortion correction algorithm. A flat bed
insert and a standard radiotherapy mattress were placed
Table 1 Patient population
Anatomic
region
Female Male Mean age
(range)
Mean number of
fields
Prostate - 10 67.0 (62-74) 4.3
Brain 1 9 69.1 (42-80) 4.2
Thorax 4 6 64.6 (46-85) 3.3
Head & Neck 3 7 66.5 (41-81) 4.0
Jonsson et al . Radiation Oncology 2010, 5:62
/>Page 2 of 8
on the spine coil to create similar bed stiffness and
shape as the radiotherapy couch.
For all examinations, the CT imaging was performed
with a GE Lightspeed scanner (GE Medical Systems,
Milwaukee, Il, USA) equipped with a carbon fiber radio-
therapy couch (Siemens, Erlangen, Germany) with slice
thickness 2.5 mm and 130 kV. The CT scanner HU-
scale is calibrated regularly using a standard phantom
provided by the vendor for each available CT tube vol-
tage. The HU homogeneity was verified us ing a CAT-
PHAN 600 phantom (The Phantom Laboratory, Salem,
NY, USA), and the peripheral HU value varied less than
4 HU (0.4% of the attenuation coefficient of water) com-
pared to the HU value in the center of the phantom.
Structure definition and treatment plans
The patients selected for th is retrospective study had all
bee n previously treated and had complet e clinical treat-
ment plans with targets defined by experienced physi-
cians and treatment plans constructed by radiotherapy
assistants based on the CT study. The MR and CT stu-
dies had all been previously registered; at our depart-
ment, the target volume is defined on MR images
registered to the CT study. All plans were three-dimen-
sional conformal treatments. Oncentra Masterplan
(Nucletron B.V., Veenendaal, Holland) was used for all
delineations, registrations, and dose calculations.
For both the CT and MR studies, we manually deli-
neated the additional structures needed for comparison
of bulk density treatment plans and the clinical CT-
based treatment plans. For prostate patients, this
included the patient outl ine, femur, femoral head, and
hipbone; for thorax patients, this included the lung.
Since the head and neck and brain patients were not
imaged in treatment positio n in the MR scanner, the
bulk density structures were delineated only on the CT
images for those patients, i.e., the patient outline, skull
bone, and air cavities. Bone was considered as one tissue
type: the cortical and the trabecular parts were deli-
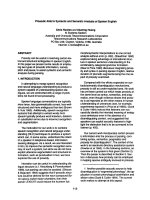
neated together. The different structures were assigned
mass densities to form a synthetic CT image (Figure 1).
The treatment planning system uses a look up table to
map the mass densities to electron densities used for
dose calculations. The target volumes that were used in
the clinical treatments were used for all dose
calculations.
Dose calculations
The dose calculation s were performed using the same
field setup in four geometries: 1.) the CT geometry with
heterogeneity correction (the normal clinical geometry);
2.) no heterogeneity correction on CT data (the patient
external contour delineated on CT and the entire
patient anatomy set to water); and 3.) bulk density
geometry based on CT data for all treatment regions
and 4.) bulk density geometry based on MR data for the
prostate and tho rax regions. T he tumor volum es were
all delineated on MR. The mass densities, as recom-
mended in ICRU 46[25], are cranium (whole) - 1.61 g/
cm
3
, femoral bone (whole) - 1.33 g/cm
3
,lung-0.26g/
cm
3
, and average soft tissue 1.025 g/cm
3
. Air was set to
0.001 g/cm
3
. In all cases, mass density values correspond
to healthy adults. For soft tissue, the mean value for
female and male is given. The collapsed cone calculation
algorithm was used for the lung patients, while the pen-
cil beam a lgorithm was used for all other calculations
(following the normal clinical procedures at our
department).
Evaluation
The study was divided into two steps: (i) evaluation of
the shape differences of the dose volume histograms
(DVHs) for the different calculation geometries using
the clinical treatment plan and (ii) comparison of the
number of monitor units (MUs) required t o reach the
prescribed dose with the different calculation geom etries
using the clinical beam setup.
The DVH for the target from the CT calculation was
compared with the DVH for the bulk densities recom-
mended by the ICRU for bone and lung and with t he
exact same treatment plan, i.e., the same beam setup
and number of MU per beam. In this part of the study,
we investigated what impact the bulk density approach
had on the DVH shape and assessed the sensitivity of
the DVH to the bulk density assignment. Bulk densities
for DVH assessment were defined on CT geometry.
In the second part, the total number of MUs required
to reach the prescribed dose w as used to quantify the
impact of the different calculation geometries. This
approach is almost equivalent with the method of com-
paring the dose for a fixed number of MUs [11,23,24],
but we see it as more intuitive since it is the number of
MUs rather than the prescribed dose that will be
affected by the change in calculation geometry. All treat-
ment plans were normalized with respect to the mean
dose in the primary target volume (PTV). Because the
different beams for each plan were energy fluence
weighted, the MU relation between the beams were
independent of the calculation geometry.
Results
Evaluation of DVH
The shapes of the target volume DVHs were fairly
insensitive to the bulk density assignment Figure 2,
figure 3, figure 4, figure 5 and table 2 also show that the
density values recommended in ICRU 46[25] provide a
clinically acceptable agreement between bulk density
DVHandDVHbasedontheCTstudy.Therefore,we
Jonsson et al . Radiation Oncology 2010, 5:62
/>Page 3 of 8
used these relative mass den sities in the second part of
the study where the number of MUs required to reach
the prescribed dose was evaluated.
Evaluation of dose calculations
Table 3 lists the mean values and standard deviations o f
the relative differences in MUs between the different
calculation geometries and the standard CT geometry.
The mean MU values of the bulk density assigned plans
were within 1% of the CT plans for all patient groups.
There was a consistent improvement of the calculation
accuracy with bulk density assignment compared to cal-
culations performed without inhomogeneity corrections,
except in the head and neck plans where bulk density
assignment gave the same result.
Discussion
In general, the shape differences, D95 and D50
betweenPTVDVHsbasedonfullCTdatacompared
to bulk density data were small; however, in the pros-
tate patients there is a clear underdosage when the
bone bulk density recommended for healthy adults
(1.330 g/cm
3
according to the ICRU) was used. Figure
6-asingleprostatepatientDVHplottedformultiple
bone bulk densities - shows that there is evidence that
a lower bulk density value closer to 1.2 g/cm
3
would
give results closer to the CT calculation. The value
recommended by the ICRU for 90 year-old adults is
1.220 g/cm
3
.Italsoappearsthatratherdrasticvaria-
tions in the assigned relative density give only a mod-
est change of the calculated dose. The geometry that
was most sensitive to the choice of bulk density value
inthepresentstudyistheprostatecasewherethe
femoral head and the pel vic bone effects the radiation
field, but even in this case a variation in relative mass
density from 1.2 g/cm
3
to 1.4 g/cm
3
, an increase of
15%,changesthedosebyonly1-2%.
The differences in dose calculation results when based
on CT and bulk densities are small (Table 3). The lar-
gest observed deviation in MUs for an individual patient
after bulk density assignment s was 1.6%. This should be
seen in the light of t he uncertaint y of the total standard
calculation, which has been estimated to 3.2% in ICRP
publication 86[26]. Adding these values in quadrature
yields a total cumulative error of 3.6%, which is a
noticeable increase. However, the benefit of increased
geometrical accuracy by eliminating the image registra-
tion step between the MR and CT dataset in the treat-
ment planning[14] should be weighed against the small
increase in dose calculation uncertainty.
The thorax patients that were investiga ted in this
study showed very good agreement between CT and the
bulk density approach, considering the difficult geome-
tries at these sites. The ribcage was not segmented
because of the very troublesome and tim e-consuming
task of manual segmentation and because the effect on
the radiation beam caused by the bone should be minor
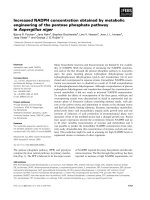
compared to the impact of lung tissue. As seen in figure
7,thedistortionsinthedosedistributionsarerelatively
small even in this inhomogeneous PTV that includes
pulmonary tissue and air gaps.
The head and neck cases that were investigated were
uncomplicated from a radiotherapy point of view since
IMRT treatments were excluded from the study. How-
ever, the treatment plans that were investigated yielded
good results and suggest that the use of MR-based syn-
thetic CT may be used to decrease the impact of dental
filling artifacts in head and neck cases. The bulk density
approach on head and neck cases has been successfully
used[27] when applied to CT images.
Figure 1 Synthetic CT and MR image. The synthetic CT with assigned mass densities (left) and the MR image on which it was based (right).
Jonsson et al . Radiation Oncology 2010, 5:62
/>Page 4 of 8
Even though differences in imaging setup prohibited
study of bulk density images based on MRI in head and
neck and brain, the validity of the bulk density approach
is established by assigning bulk densities to the CT
images. There is no reason to suspect that the accuracy
would be significantly altered by delineating the bulk
density geometries on MR images.
Except for the prostate cancer cases where there is a
systematic difference between synthetic CT and normal
CT calculations, patient number 034 had the worst corr-
sepondence between the DVH based on CT and the
DVH based on bulk density assingments (figure 5). For
this patient, the PTV was very small and inhomo-
geneous, located in the hypothalamus area of the brain
(figure 8), which makes the case challangeing from a
dose calcualtion perspective. Despite the difficult geome-
try, the difference in MUs was only 1.5%.
Geometrical distortion is a known problem connected
to MR in radiotherapy [16,17]. In modern scanners,
patient-independent distortions are mainly due to
nonlinearities in the gradien ts and to minor part due to
inhomogeneities in the static magnetic field B
0
. Gradient
nonlinearities are a direct consequence of the gradient
coil design and can be described and corrected using
generic methods. In the present study, a 3D correction
algorithm based on a spherical harmonic expansion of
the fields generated by the gradient co ils was use d[17].
Siemens guaranties a B
0
homogeneity of < 4 ppm within
an elliptical field of view with axis 45 × 45 × 30 cm
3
.
For a sequence with bandwidth 592 Hz/pixel (as used in
the current study and with a 1.5 T scanner), this corre-
sponds to a distortion of less than 0.5 pixels. Magnetic
susceptibility induced distortions as well as B
0
inhomo-
geneity-related distortions can be minimized using a
high bandwidth sequence. In extreme situations, the
susceptibility effects close to air/water interfaces can
reach 10 ppm[28]. This corresponds to a distortion of
around 1 pixel for the sequence used in the present
study. Generally, dose calculations for photons are
insensitive to small geometrical errors. Quality control
Figure 2 DVH comparisons for all geometries.Thefigureshows
PTV DVH comparisons between bulk density assigned data and CT
data for the prostate patients. The exact same treatment setup was
used for the two geometries, including number of MUs given. The
DVHs have been normalized to the maximum dose from the CT
DVH.
Figure 3 DVH comparisons for all geometries. The figure shows
PTV DVH comparisons between bulk density assigned data and CT
data for the lung patients. The exact same treatment setup was
used for the two geometries, including number of MUs given. The
DVHs have been normalized to the maximum dose from the CT
DVH.
Jonsson et al . Radiation Oncology 2010, 5:62
/>Page 5 of 8
of the geometrical distortions is important, however,
when it comes to target definit ion and patient position-
ing.Thepresentstudyshowsthatfromadosecalcula-
tion perspective MR planning is feasible. Detailed
broader analyses are needed before clinical
implementation.
Inthepresentwork,wehaveonlydealtwithconfor-
mal 3D treatments. Fo r this purpose, we deem ed that a
comparison of the calculated number of MUs needed to
reach the prescrib ed dose was an adequate quality mea-
sure. However, if the same study should be performed
for patients treated with IM RT, a different methodology
should be used so that the dose distributions can be
compared in voxel-w ise fashion. With IMRT , the calcu-
lated dose distribution is used as feedback in an iterative
optimization process. This means that there is a risk for
increased sensitivity to small errors in the anatomy seg-
mentation used for the bulk density assignment.
A large-scale implementation of treatment planning
on MR data relies on effective methods for delineation
of structures and bulk d ensity assignments. Automatic
segmentation of bone-e.g., by using deformable atlas-to-
patient image registration[ 29]-eliminates the need for
manual segmentation and improves the efficiency of the
workflow. In addition, the MR coils for the head and
neck area must be revised to accommodate the fixation
devices that keep the patient immobilized during treat-
ment so that the plan can be constructed in the correct
Figure 4 DVH comparisons for all geometries. The figure shows
PTV DVH comparisons between bulk density assigned data and CT
data for the head and neck patients. The exact same treatment
setup was used for the two geometries, including number of MUs
given. The DVHs have been normalized to the maximum dose from
the CT DVH.
Figure 5 DVH comparisons for all geometries. The figure shows
PTV DVH comparisons between bulk density assigned data and CT
data for the brain patients. The exact same treatment setup was
used for the two geometries, including number of MUs given. The
DVHs have been normalized to the maximum dose from the CT
DVH.
Table 2 Quantitative DVH information
Mean difference CT
bulk
-CT
Treatment D95 [range] % D50 [range] %
Prostate -0.96 [-1.44; -0.21] -0.82 [-1.44; -0.08]
Thorax -0.56 [-2.47; 0.46] -0.36 [-0.93; 0.15]
Brain 0.07 [-1.14; 0.60] -0.01 [-1.51; 0.42]
Head & Neck 0.68 [-0.50; 2.17] 0.27 [-0.21; 0.80]
D95 and D50 (dose covering 95% and 50% of the ROI respectively)
differences in mean value between the CT based calculations and bulk
density calculations based on CT geometry, given in percent of maximum
dose in the CT calculations.
Jonsson et al . Radiation Oncology 2010, 5:62
/>Page 6 of 8
geometry. MR coils that are compatible with these fixa-
tion devices are being constructed at our department in
collaboration with Umeå Institute of Design.
Conclusions
We conclude that the dose calculation accuracy is not a
limiting factor for radiotherapy treatment planning
solely using MR images when using a bulk density
approach, even in the case of tissues that differ large ly
from water such as pulmonary tissue. The density values
that are recommended by the ICRU yield accurate
results. In the prostate patients, the femoral bone den-
sity should be 1.220 g/cm
3
as recommended by the
ICRU for 90 year-old patients. Treatment planning
Table 3 Calculation geometry comparisons
MR
bulk
/CT CT
bulk
/CT CT
hom
/CT
Treatment area Mean [range] % St.d. % Mean [range] % St.d. % Mean [range] % St.d. %
Prostate 0.2 [-0.8; 0.9] 0.5 0.8 [0.1; 1.1] 0.3 -1.6 [-2.3; -1.6] 0.2
Thorax 0.2 [-0.6; 0.9] 0.4 0.5 [0.0; 1.0] 0.3 1.4 [-0.8; -6.5] 2.1
Head&Neck - - -0.3 [-0.8; 0.1] 0.3 -0.3 [-1.1; 0.6] 0.5
Brain - - 0.0 [-0.7; 1.5] 0.6 -1.5 [-2.4; -0.7] 0.5
The table shows comparisons between the different calculation geometries and normal CT geometry in percent. MR
bulk
designates bulk density assigned MR
data. CT
bulk
designates bulk density assigned CT data. CThom designates calculations performed without inhomogeneity corrections on CT data.
Figure 6 DVH for prostate PTV for several bone bulk dens ities.
PTV DVH comparison for several bulk density assignments of
femoral bone to CT geometry. The treatment setup and MUs given
are the same in all cases. The DVHs are normalized to the CT
maximum dose.
Figure 7 Dose distribution in lung for synthetic and normal CT. The dose distribution in the thoracic area in a bulk density based-treatment
plan (left) and in a CT-based treatment plan (right). The PTV is light blue, the 70% isodose is blue, 95% is yellow, and 105% is red.
Figure 8 An inhomogeneous PTV. A part icularly difficult case
where the PTV is very small and inhomogenous, leading to a larger
than normal deviation of bulk density dose calculation compared to
CT calculation.
Jonsson et al . Radiation Oncology 2010, 5:62
/>Page 7 of 8
using MR images make s the CT unnecessary in the
radiotherapy workflow. Using only MR images reduces
the radiation exposure to the patient, removes any sys-
tematic registration errors that may occur when com-
bining MR and CT, and eliminates the time and cost
associated with the extra CT investigation.
Author details
1
Department of Radiation Physics, Umeå University Hospital, 90185 Umeå,
Sweden.
2
Radiation Physics Section, Department of Radiation Sciences, Umeå
University, 90187 Umeå, Sweden.
3
Section of Oncology, Department of
Radiation Sciences, Umeå University, 90187 Umeå, Sweden.
Authors’ contributions
JJ performed the dose calculations and drafted the manuscript. TN
conceived the study and participated in its design and helped draft the
manuscript. MGK participated in the design of the study and gathered all
data. MK participated in the design and coordination of the study. All
authors read and approved the final manuscript.
Competing interests
The authors declare that they have no competing interests.
Received: 31 March 2010 Accepted: 30 June 2010
Published: 30 June 2010
References
1. Debois M, Oyen R, Maes F, Verswijvel G, Gatti G, Bosmans H, Feron M,
Bellon E, Kutcher G, Van Poppel H, Vanuytsel L: The contribution of
magnetic resonance imaging to the three-dimensional treatment
planning of localized prostate cancer. Int J Radiat Oncol Biol Phys 1999,
45:857-865.
2. Hricak H: MR imaging and MR spectroscopic imaging in the pre-
treatment evaluation of prostate cancer. Br J Radiol 2005, 78(Spec No 2):
S103-111.
3. Rasch C, Barillot I, Remeijer P, Touw A, van Herk M, Lebesque JV: Definition
of the prostate in CT and MRI: a multi-observer study. Int J Radiat Oncol
Biol Phys 1999, 43:57-66.
4. Datta NR, David R, Gupta RK, Lal P: Implications of contrast-enhanced
CT-based and MRI-based target volume delineations in radiotherapy
treatment planning for brain tumors. J Cancer Res Ther 2008, 4:9-13.
5. Prabhakar R, Haresh KP, Ganesh T, Joshi RC, Julka PK, Rath GK: Comparison
of computed tomography and magnetic resonance based target volume
in brain tumors. J Cancer Res Ther 2007, 3:121-123.
6. Lemort M, Canizares AC, Kampouridis S: Advances in imaging head and
neck tumours. Curr Opin Oncol 2006, 18:234-239.
7. Arnold JF, Kotas M, Pyzalski RW, Pracht ED, Flentje M, Jakob PM: Potential
of magnetization transfer MRI for target volume definition in patients
with non-small-cell lung cancer. J Magn Reson Imaging 2008,
28:1417-1424.
8. Beavis AW, Gibbs P, Dealey RA, Whitton VJ: Radiotherapy treatment
planning of brain tumours using MRI alone. Br J Radiol 1998, 71:544-548.
9. Lee YK, Bollet M, Charles-Edwards G, Flower MA, Leach MO, McNair H,
Moore E, Rowbottom C, Webb S: Radiotherapy treatment planning of
prostate cancer using magnetic resonance imaging alone. Radiother
Oncol 2003, 66:203-216.
10. Pasquier D, Betrouni N, Vermandel M, Lacornerie T, Lartigau E, Rousseau J:
MRI alone simulation for conformal radiation therapy of prostate cancer:
technical aspects. Conf Proc IEEE Eng Med Biol Soc 2006, 1:160-163.
11. Chen L, Price RA Jr, Wang L, Li J, Qin L, McNeeley S, Ma CM, Freedman GM,
Pollack A: MRI-based treatment planning for radiotherapy: dosimetric
verification for prostate IMRT. Int J Radiat Oncol Biol Phys 2004, 60:636-647.
12. Karlsson M, Karlsson MG, Nyholm T, Amies C, Zackrisson B: Dedicated
magnetic resonance imaging in the radiotherapy clinic. Int J Radiat Oncol
Biol Phys 2009, 74:644-651.
13. Prabhakar R, Julka PK, Ganesh T, Munshi A, Joshi RC, Rath GK: Feasibility of
using MRI alone for 3D radiation treatment planning in brain tumors.
Jpn J Clin Oncol 2007, 37:405-411.
14. Nyholm T, Nyberg M, Karlsson MG, Karlsson M: Systematisation of spatial
uncertainties for comparison between a MR and a CT-based
radiotherapy workflow for prostate treatments. Radiat Oncol
2009, 4:54.
15. Roberson PL, McLaughlin PW, Narayana V, Troyer S, Hixson GV, Kessler ML:
Use and uncertainties of mutual information for computed tomography/
magnetic resonance (CT/MR) registration post permanent implant of the
prostate. Med Phys 2005, 32:473-482.
16. Wang D, Strugnell W, Cowin G, Doddrell DM, Slaughter R: Geometric
distortion in clinical MRI systems Part I: evaluation using a 3D phantom.
Magn Reson Imaging 2004, 22:1211-1221.
17. Janke A, Zhao H, Cowin GJ, Galloway GJ, Doddrell DM: Use of spherical
harmonic deconvolution methods to compensate for nonlinear gradient
effects on MRI images. Magn Reson Med 2004, 52:115-122.
18. Karger CP, Hoss A, Bendl R, Canda V, Schad L: Accuracy of device-specific
2D and 3D image distortion correction algorithms for magnetic
resonance imaging of the head provided by a manufacturer. Phys Med
Biol 2006, 51:N253-261.
19. Knoos T, Nilsson M, Ahlgren L: A method for conversion of Hounsfield
number to electron density and prediction of macroscopic pair
production cross-sections. Radiother Oncol 1986, 5:337-345.
20. Jiang H, Seco J, Paganetti H: Effects of Hounsfield number conversion on
CT based proton Monte Carlo dose calculations. Med Phys 2007,
34:1439-1449.
21. Thomas SJ: Relative electron density calibration of CT scanners for
radiotherapy treatment planning. Br J Radiol 1999, 72:781-786.
22. Chen L, Price RA Jr, Nguyen TB, Wang L, Li JS, Qin L, Ding M, Palacio E,
Ma CM, Pollack A: Dosimetric evaluation of MRI-based treatment
planning for prostate cancer. Phys Med Biol 2004, 49:5157-5170.
23. Eilertsen K, Vestad LN, Geier O, Skretting A: A simulation of MRI based
dose calculations on the basis of radiotherapy planning CT images. Acta
Oncol 2008, 47:1294-1302.
24. Kristensen BH, Laursen FJ, Logager V, Geertsen PF, Krarup-Hansen A:
Dosimetric and geometric evaluation of an open low-field magnetic
resonance simulator for radiotherapy treatment planning of brain
tumours. Radiother Oncol 2008, 87:100-109.
25. White GRDR, Wilson IJ: Photon, Electron, Proton and Neutron Interaction
Data for Body Tissues. ICRU Report 46 Bethesda, Maryland 1992.
26. Clarke RHHL-E, Valentin J: Prevention of Accidental Exposures to Patients
Undergoing Radiation Therapy. Annals of the ICRP, Publication 86,
Stockholm 2000.
27. Webster GJ, Rowbottom CG, Mackay RI: Evaluation of the impact of dental
artefacts on intensity-modulated radiotherapy planning for the head
and neck. Radiother Oncol 2009, 93:553-558.
28. Schenck JF: The role of magnetic susceptibility in magnetic resonance
imaging: MRI magnetic compatibility of the first and second kinds. Med
Phys 1996, 23
:815-850.
29. Ellingsen LM, Chintalapani G, Taylor RH, Prince JL: Robust deformable
image registration using prior shape information for atlas to patient
registration. Comput Med Imaging Graph 34:79-90.
doi:10.1186/1748-717X-5-62
Cite this article as: Jonsson et al.: Treatment planning using MRI data:
an analysis of the dose calculation accuracy for different treatment
regions. Radiation Oncology 2010 5:62.
Submit your next manuscript to BioMed Central
and take full advantage of:
• Convenient online submission
• Thorough peer review
• No space constraints or color figure charges
• Immediate publication on acceptance
• Inclusion in PubMed, CAS, Scopus and Google Scholar
• Research which is freely available for redistribution
Submit your manuscript at
www.biomedcentral.com/submit
Jonsson et al . Radiation Oncology 2010, 5:62
/>Page 8 of 8