Báo cáo khoa học: "Tumor response to radiotherapy is dependent on genotype-associated mechanisms in vitro and in vivo" ppsx
Bạn đang xem bản rút gọn của tài liệu. Xem và tải ngay bản đầy đủ của tài liệu tại đây (1.51 MB, 14 trang )
RESEARC H Open Access
Tumor response to radiotherapy is dependent on
genotype-associated mechanisms in vitro and
in vivo
Jerry R Williams
1*
, Yonggang Zhang
2
, Haoming Zhou
2
, Daila S Gridley
1
, Cameron J Koch
3
, John F Dicello
1
,
James M Slater
1
, John B Little
4
Abstract
Background: We have previously shown that in vitro radiosensitivity of human tumor cells segregate non-
randomly into a limited number of groups. Each group associates with a specific genotype. However we have also
shown that abrogation of a single gene (p21) in a human tumor cell unexpectedly sensitized xenograft tumors
comprised of these cells to radiotherapy while not affecting in vitro cellular radiosensitivity. Therefore in vitro
assays alone cannot predict tumor response to radiotherapy.
In the current work, we measure in vitro ra diosensitivity and in vivo response of their xenograft tumors in a series
of human tumor lines that represent the range of radiosensitivity observed in human tumor cells. We also measure
response of their xenograft tumors to different radiotherapy protocols. We reduce these data into a simple analyti-
cal structure that defines the relationship between tumor response and total dose based on two coefficients that
are specific to tumor cell genotype, fraction size and total dose.
Methods: We assayed in vitro survival patterns in eight tumor cell lines that vary in cellular radiosensitivity and
genotype. We also measured response of their xenograft tumors to four ra diotherapy protocols: 8 × 2 Gy; 2 × 5Gy,
1 × 7.5 Gy and 1 × 15 Gy. We analyze these data to derive coefficients that describe both in vitro and in vivo
responses.
Results: Response of xenografts comprised of human tumor cells to different radiotherapy protocols can be
reduced to only two coefficients that represent 1) total cells killed as measured in vitro 2) additional response in
vivo not predicted by cell killing. These coefficients segregate with specific genotypes including those most
frequently observed in human tumors in the clinic. Coefficients that describe in vitro and in vivo mechanisms can
predict tumor response to any radiation protocol based on tumor cell genotype, fraction-size and total dose.
Conclusions: We establish an analytical structure that predicts tumor response to radiotherapy based on
coefficients that represent in vitro and in vivo responses. Both coefficients are dependent on tumor cell genotype
and fraction-size. We identify a novel previously unreported mechanism that sensitizes tumors in vivo; this
sensitization varies with tumor cell genotype and fraction size.
Introduction
Much research in clinically-relevant radiobiology is based
on the pre mise that there i s a triangular relation ship
between radiocurability of tumors in the clinic, radiosen-
sitivity of xenograft tumors in vivo and radiosensitivity of
human tumor cells in vitro. We have previously reported,
in collaboration with Vogelstein’s laboratory, that abroga-
tionofasinglegene(p21)increasessusceptibilityof
xenograft tumors to radiotherapy but compared to its
parent line, does not effect in vitro radiosensitivity [1].
This was the first report showing modulation of a single
gene could uncouple in vitro versus in vivo radiosensitiv-
ity. It also implies that in vitro radiosensi tivity alone can-
not predict tumor response.
* Correspondence:
1
Radiation Research Laboratories, Department of Radiation Medicine, Loma
Linda University Medical Center, Loma Linda CA, USA
Full list of author information is available at the end of the article
Williams et al. Radiation Oncology 2010, 5:71
/>© 2010 Williams et al; licensee BioMed Central Ltd. This i s an Open Access article distributed under the terms of the Creative Commons
Attribution License ( which permits unrestricted use, distribution, and reproduction in
any medium, provided the original work is properly cited.
We now compare in vitro and in vivo responses of
multiple human tumor cells that vary in radiosensitivity
and genotype. We selected a set of human tumor cells
from a large study that d efined radiosensitivity as mea-
sured in vitro. These cell lines segregat ed into radiosen-
sitivity groups and each group associated with genotype,
not histological type [2,3]. When these data are placed
in an appropriate structure, tumor cell radiosensitivity
segregates into distinct groups that each associate with a
specific genotype. Four genotypes were identified that
were markers for these radiosensitivity groups: mutant
ATM, wildtype TP53, mutant TP53 and an unidentified
gene or factor (glio) that renders a subset of glioblas-
toma cells very radioresistant [2,3]. These cell lines
representthemostsensitivecelllinewehaveexamined
(SW1222), the most resistant cell lines we have exam-
ined (U251) and six cell lines that represent the most
common genotypes expressed in human tumor cells,
wtTP53 and mutTP53. We now define in vivo radiosen-
sitivity of xenograft tumors comprised of these cell lines
that represent these four cellular radiosensitivity groups.
We stress that while we selected cell lines from each
radiosensitivity group, we did not select specific geno-
types. Oncogenesis selected the four genotypes that seg-
regate with tumor radiosensitivity.
Critical to interpreting our data is confidence that
xenograft tumors reflect relevant properties of cellular
radiosensitivity. Xenograft tumors have been demon-
stratedtobeausefulgeneraltoolforstudyinginvivo
radiosensitivity compared to in vitro characteristics of
their constituent cells [4-6]. Xenograft studies have been
particularly useful in studying the d ose-rate effect [7],
the effect of dose-fractionation [8,9] identification of the
a/b ratio [10] and the role of TP53 in tumor response
[11]. Xenograft studies have been used to seek c orrela-
tions between in vitro and in vivo response for tumors
of different histological types, including melanoma [12],
breast [ 13], lung [14], colon [15], g lioblastoma [16] and
squamous cell carcinoma [17]. We have previously used
xenograft studies to show abrogation of a single gene,
CDKN1A (p21), increases xenograft tumor radiosensitiv-
ity to large fractions (15 Gy) in vivo but does not alter
cellular radiosensitivity in vitro [1]. Similarly some geno-
mic manipulations increase sensitivity to other anti-
cancer agents but not ionizing radiation [18].
Multiple methods have been used to describe quanti-
tativ e response o f xenograft tumors to radiotherapy. For
instance the use of TCD
50
(mean dose required to inhi-
bit regrowth in 50% of tumors) is a powerful yet
resource-intensive method [19]. We and others have
used direct comparison of kinetics of regrowth delay
between pairs of tumor types or between pairs of radio-
therapy protocols [1,18] and while this method has sig-
nificant statistical power in such a pair-wise comparison,
it is limited in comparing response of multiple tumors
that vary widely when irradiated with different radio-
therapy protocols. We now study the response of multi-
ple cell lines that vary extensively in genotype and
susceptibility to cell killing in vitro, for the relative sen-
sitivity of their x enograft tumors in vivo. It was impor-
tant to measure tumor response over a w ide range of
cell and tumor sensitivities so we selected a modification
of the method of Schwachofer et al [20] to describe
tumor response to radiotherapy based on modal volume
of regrowing tumors even when some tumors do not
regrow. These methods are described below.
Materials and methods
Cell and culture techniques
Human colorect al tumor cell lines (HCT116, 80S4, 14-3-
3s-/-, 379.2, DL D1 and 19S186) were obtained from Dr.
B. Vogelstein of the Oncology Center of Johns Hopkins,
School of Medicine), SW1222 was from Dr. James Russell
(Memorial Sloan-Kettering Cancer Center, NY), and U251
was purchased from ATCC. The basic media for all colon
tumor cell lines was McCoy 5A, supplemented with 10%
FBS, 1% penicillin and streptomycin, 1% L-glutamine; 14-
3-3s-/- required addition of G418 (0.5 mg/ml); SW1222
was grown in RPMI 1640. Human glioma cell line U251
was cultured in DMEM/F12 with 10% FBS, 1% L-gluta-
mine and 1% Penicillin and streptomycin. All cells were
sub-cultured twice a week to maintain exponential growth.
Cell survival assay
Cells were plated ~18 hours before irradiation. Surviving
colonies were determined 10-14 days after irradiation
depending on the cell line. Cells were stained with crys-
tal violet and colonies counted (>50 cells/colony). Addi-
tional plates for each experiment were used as
microcolony controls.
Radiation treatment
Cells were irradiated using a
137
Cs AECL Gammacell40
gamma irradiator at 0.7 Gy/min. For irradiation of xeno-
graft tumors, mice were confined in 50 ml plastic centri-
fuge tube with holes through wh ich the tail and the
tumor-bearing leg could be extended. Tumors were irra-
diated at dose rate of 7.5 Gy/min with a collimated
beam in a J.L. Shepard Mark I
137
Cs irradiator (Pasadena
CA USA).
Tumor growth delay assay
Tumors were established by subcutaneous injection of
5 million cells suspended in PBS into the upper thigh of
nude mice. Each cohor t incl uded 6 to 13 tumors.
Tumor growth rate was determined by measuring three
orthogonal diameters of each tumor twice a week and
the tumor volume estimated as π/6[D1 × D2 × D3],
Williams et al. Radiation Oncology 2010, 5:71
/>Page 2 of 14
when individual tumor volumes reached ~0.1-0.3 cm
3
,
radiation treatment was initiated. Modal s pecific growth
delay (mSGD) was measured for all cohorts in which a
majority of tumors reached a volume four times the
initial volume. Response was normalized to growth of
unirradiated cells. We chose not to use the mean of spe-
cific regrowth delay patterns since a significant propor-
tion of our cohorts included one or more tumors that
did not regrow. Thus the mean became limited as a
regrowth parameter. In our forty xeno graft experiments,
only cohorts of the very sensitive (VS) cells, SW1222,
less than half the tumors regrew when treated with 7.5
and 15.0 Gy and thus the modal values for SGD are no
longer meaningful. For these two cohorts we estimated
mSGD based on the regrowth pattern for the minority
of tumors that did regrow. When we tested the sensitiv-
ity of mo dal to mean growth delay in sel ected cohorts
in which all tumors regrew, the modal value always fell
within one standard deviation of the mean. These meth-
ods share some charact eristics of the methods described
by Schwatchofer [20]. To provide an overview of the
dichotomous response when some tumors regrow but
some do not, we indicated such cohorts with an arrow
showing this value, in t erms of overall tumor response,
was the common minimum response.
Statistical analysis
Comparison of data clusters were evaluated using Stu-
dent’s t test with p < 0.05 as the level for significance.
Results
Our data are presented as three major observations: 1)
In vitro radiosensitivity of tumor cells and in vivo
radiosensitivity of their xenograft tumors show specific
relationships that vary with genotype; 2) this large data
matrix can be structured into an analytical system based
on two coefficients that describe in vitro and in vivo
radiosensitivity in parametric terms; and 3) these com-
parisons demonstrate a new heretofor e unrecognized
mechanism that influences in vivo radiosensitivity.
We selected eight cells from the four in vitro radio-
sensitivity groups and these cell lines are shown in table
1. In this table we list these lines by radiosensitivity
groups, by histological type, co mments on their molecu-
lar characteristics, and comments on their radiosensitiv-
ity. This table also sho ws thei r expression of DNA
mismatch repair enzymes, homozygous deficiency in
such genes suggest the tumor developed in individuals
that express the genetic syndrome HNPCC (Human
Non-Polyposis Colorectal Cancer).
In vitro radiosensitivity
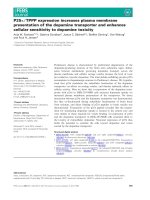
We irradiated each of the eight cell lines in table 1 with
graded doses of ionizing radiati on and measured colony
formation. These data are shown in figure 1.
These data represent the range of human tumor cell
radiosensitivity as observed across a large cohort of
human tumor cells. Each radiosensitivity group
expresses a common g enotype and each clonogenic
inactivation in each group is statistically distinct at circa
2 Gy. However the distribution of tumor cell radiosensi-
tivity with genotype is better seen when radiosensitivity
of tumor cells is expressed as the ratio of radiosensitivity
at circa 2 Gy and radiosensitivity at higher doses. In
references [2,3] we have designated the four cellular
radiosensitivity groups as VS (very sensitive), S
Table 1 Genetic variation and in vitro radiosensitivity of eight human tumor cell lines
Radio-Sensitivity
Group*
Cell
Line
Genetic Characteristics In Vitro Radiosensitivity
TP53 p21
induced
MMR
VR U251 mt
(273arg-his)
- + Most resistant cell line, other radioresistant glioblastomas segregate into
this group.
R DLD1 mt
(241ser-phe)
- hMSH6- Other epithelial tumors that express mutTP53 segregate into this group.
19S186 p21 double knockout from DLD1
S HCT116 wt + hMLH1- Other epithelial tumors that express wtTP53 segregate
into this group.
379.2 p53 double knockout from HCT116.
80S4 p21 double knockout from HCT116
14-3-3s-/- 14-3-3s double knockout from HCT116
VS SW1222 null - + Most sensitive cell line, mutant in the ATM gene with an A moiety
inserted in codon 6997 of exon 50.
As defined in Williams et al. [2].
Cell lines fall into four radiosensitivity groups as defined by William s et al. 2007, 2008a. All cell lines were derived from human colorectal tumors except U251
that is derived from a human glioblastoma. Expression of TP53 and radiation induced p21 were assayed by Western blot analysis. Deficiency in MMR (DNA
mismatch repair) is a marker that these tumor developed in individuals expressing HNPCC (human non-polyposis colorectal cancer).
Williams et al. Radiation Oncology 2010, 5:71
/>Page 3 of 14
(sensitive), R (resistant) and VR (very resistant) based on
statistical differences in survival at 2 Gy. The four
groups of tumor c ells are statistically different in survi-
val levels at circa 2 Gy. How ever the overall relationship
between genotype and in vitro r adiosensitivity is better
illustrated when shown as correlation between two
slopes that represent clonal inactivation over two dose
ranges.
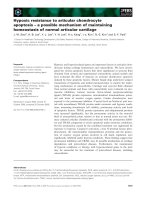
We show these data in figure 2 for survival data in fig-
ure 1 placing radiosensitivity of these ten cell lines in a
structure of coefficients th at describe their radiosensitiv-
ity within a framework of radiosensitivity for 39 cell
lines. Radiosensitivity of each cell line is expressed as
defined by the ratio of cell killing at circa 2 Gy, a (SF2)
to additional cell killin g at doses higher than 4.0 Gy, ω*.
This figure shows the relati ve cellular radiosensitiv ity of
the eight cells used in the experiments present as four
diagonal lines, each line associated with a specific
genotype.
These data are shown in figure 2 as four linear arrays,
each array comprised of a radiosensitivity group that
share genotype. Most human tumor cell lines estab-
lished from clinical specimens fall into two radiosensi-
tivity groups, S and R. Tumor cells that fall into the S
radiosensitivity group express predominantly, but not
exclusively, wtTP53. I ndeed a cell line (379.2) tha t has
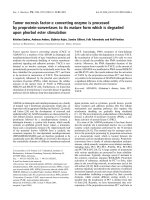
Figure 1 Clonogenic survival for eight human tumor cells lines described in table 1. Data points are the mean and standard deviation for
3 to 5 replicates. Four radiosensitivity groups are designated as VR, R, S and VS as defined in reference 5.
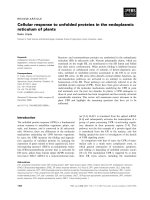
Figure 2 In vitro cellular radiosensitivity of eight cell lines used
in figure 1 presented within a data matrix representing the
spectrum of tumor cell radiosensitivity. Data are expressed as
the ratio of coefficients that describe the slope of clonogenic
inactivation at lower doses a(SF2) and ω*, the rate of additional
clonogenic inactivation at higher doses.
Williams et al. Radiation Oncology 2010, 5:71
/>Page 4 of 14
been abrogated in T P53 as a mature cancer cell, shares
the S response even though null for TP53 expression.
The S cell group also includes sublines of the colorectal
tumor line HCT116 that have been abrogated in
CDKN1A, p21 (80S4 cells) or abrogated in 14-3-3 s
(14-3-3s-/-). 80S4 cells (p21-) are from the cell line that
we showed have increased radiosensitivity as xenograft
tumors [1]. The R radiosensitivity group is comprised
predominantly, but not exclusively, of cells that express
mutTP53. In our studies the R radiosensitivity group is
represented by DLD-1 that expresses mut TP53 and one
subline that has been abrogated in CDKN1A, p21
(19S186). VS cells (SW1222 cells) are mut ant in ATM
(an A moiety inserted in codon 6997, codon 50) and
this is the most sensitive cell line we have identified. A
VR cell line (U251 cells) is representative of the most
radioresistant group of human tumor cells. Importantly,
four cell lines in figures 1 and 2 show diminis hed levels
of p21 expression: 80S4 cells, that represents abrogat ion
of p21 in a wildtype TP53 background; 19S186 cells
represent abrogation of p21 in a mutant TP53 back-
ground; the cell line mutant in ATM and the radioresis-
tant glioblastoma line. The data in figures 1 and 2 sh ow
that abrogation of p21, 14-3-3s and surprisingly TP53
does not modulate in vitro radiosensitivity. The fact that
abrogation of TP53 does not shift radiosensitivity from
the S group demonstrates that the presence of wtp53
protein is not involved in the expression of S radiosensi-
tivity observed in all cells that express wildtype TP53.
In vivo radiosensitivity of xenograft tumors comprised of
cells that vary in their in vitro radiosensitivity and
genotype
For each of the eight cell lines for which we determined in
vitro radiosensitivity in figures 1 and 2, we measured in
vivo radiosensitivity of their xenograft tumors. Five
cohorts of xenograft tumors comprised of 6 to 13 tumors
from each cell line were exposed to five different p roto-
cols. These protocols are: control; two single dose proto-
cols: 1 × 7.5 Gy and 1 × 15.0 Gy; and two fractiona ted
protocols: 8 × 2 Gy, with fractions of 2.0 Gy each delivered
over three days with at least 6 hours between fractions and
2 × 5 Gy, delivered with 24 hours between fractions.
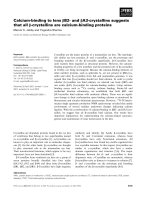
Radiation-induced changes regrowth of human tumors for
these 40 cohorts of tumors are shown in figure 3.
These data, representing over 3000 individual data,
show an extremely wide range of in vivo radiosensitivity
for different genotypes on the basis of protocols. Certain
general observations can be made before detailed analy-
sis. First, response of tumors comprised of SW1222
(mutATM) cells are hypersensitive to all protocols, both
fractionated and acute. Total dose dominates responses
of this cell lines and sparing by fractionation is not as
effective as other cell lines. Surprisingly the most
resistan t cell line U251 is unexpectedly sensitive to larger
fractions. In general cells from the R group are more
resistant over most protocols compared to the S group.
The wide range of data in this figure demonstrates
how the use of modal SGD allows estimation of a single
parameter over all cell type s and protocols. Only for
two cohorts, VS cells treated with 15 Gy acute or 16 Gy
delivered as 8 fractions, did fewer than half the tumors
failed to r egrow shown as terminal values observed at
day 34 for the 8 × 2 Gy cohort and at 40 days for the 1
× 15 Gy treatments. In figure 3, these cohorts we draw
a dotted line representing the response of the tumors
that did regrow but constituted less than half the total
tumors in the cohort.
To indicate the effect of dichotomous response,
wherein all tumors in a cohort did not regrow, we indi-
cate these with a short arrow at the value of mSGD
where measurements are made.
Tumor regrowth delay varies extensively with irradiation
protocols and tumor genotype
Four cell lines in figure 3 show exceptional levels of
regrowth delay after irradiation with single fractions of
15 Gy and these are: SW1222 (mutATM), 80S4 (wtp53,
p21-), 19S186 (mutTP53, p21-) and U251 (radioresistant
glioma “ glio” ). Based on our previous work [1] we
expected this elevated response for tumors comprised of
cells abrogated in p21(80S4 cells, p53+, p21-) and per-
haps for SW1222 (mutATM) cells that have except ional
radiosensitivity in vitro, but the response of 19S186 cells
(mutp53, p21-) and especially the response of U251 cells
(glio) were not expected. On the basis of this clear
dichotomyinresponseto15Gyexpressedbytumors
comprised of four cell lines compared to the other four
lines w e will present and analyze our data on the basis
of two response groups, one designated the “ S-R
response group” and postulate it represents most cell
lines that fall into the S and R radiosensitivit y groups.
The other group will be identified at this point as “p21
-
response group” and in cludes two cell lines abrogated in
p21 (80S4 and 19S186) and two cell lines shown in
table 1 to express diminished p21 (SW1222 cells and
U251 cells).
Development of an analytical structure to compare in
vitro and in vivo radiosensitivity
Inthenextseveralfiguresweproposeasimpleanalyti-
cal structure that can be used to compare in vitro and
in vivo radiosensitivity.
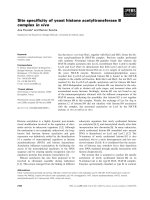
Expressing the overall relationship between total dose
and tumor response
The data in figures 1, 2 and 3 can be used to determine
the relationship between tumor response expressed as
Williams et al. Radiation Oncology 2010, 5:71
/>Page 5 of 14
mSGD and total-cells-killed (TCK) expressed as logs of
tumor cells inactivated. When we perfo rmed this analy-
sis we observed two distinct patterns each observed in
two groups of cell lines. In figure 4 and subsequent fig-
ures we will present a parallel analysis of these two
groups. This dichotomy is based on distinct differences
in tumor response as a function of total dose. These
data are shown in figure 4.
These data show that tumor genotype influences
response of xenograft tumors to radiotherapy. These
data segregate data into two different response patterns.
The correlation between xenograft respo nses for four
genotypes shown in the left hand panel is a relatively
linear relationship between tumor response and log of
total-cells-killed but the xenografts responses for four
other genotypes as shown in the right hand panel, are
dis tinctly elevated . For both panels, the arrows pointi ng
to the right indicate that modal Specific Growth Delay
was determined by t he majority of tumors in the cohort
but that one or more tumors did not regrow. Thus the
data points with arrows are an estimate of minimum
regrowth delay.
The data in the left hand panel show relatively
strong correlation between tumor response and logs of
total-cells-killed with a relatively high correlation coef-
ficient of 0.7271, a surprisingly strong correlation for
data derived from multi-facto r biological experiments.
We will refer to this group for the benefit of discus-
sion as the S-R tumor radiosensitivity group as the
tumors in this panel are comprised of four cell lines
from the S and R cellular radiosensitivity groups. The
four genotypes that fall into the more linearly
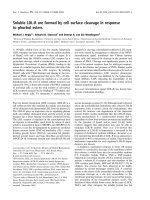
Figure 3 Relative tumor volume as a function of time after irradiat ion for eight tumor cell lines responding to five protocols.Tumor
volume is expressed as the log of the ratio of the volume of irradiated cells compare to unirradiated cells at specific post-irradiation times. Each
panel represents response of one of eight cell lines to five different treatment protocols as shown in the legend. Data points are the modal
values of 6 to 13 tumors. Where all tumors did not regrow there is an arrow above the final point that indicates modal value was measured
using only the tumors that regrew. The two responses for SW1222 cells at 8 × 2 and 1 × 15 show a dotted line where the value for modal
Specific Growth Delay are portrayed using less than a majority of tumor the did regrow.
Williams et al. Radiation Oncology 2010, 5:71
/>Page 6 of 14
responding tumors are comprised of cells that include
3 lines that are in the S radiosensitivity group: HCT-
1116 (wtTP53) and two sublines abrogated in TP53
(379.2) and 14-3-3s (14-3-3s -/-). It also includes one
cell line from the R radiosensitivity group DLD-1
(mutTP53). Even though S cells in general are more
sensitive than R cells in vitro, representatives of both
groups fall into the same, relatively linearly responding
tumor radiosensitivity group. We will examine this
relationship in m ore detail below.
The patterns of tumor radiosensitivity in the right
hand panel of figure 4 are significa ntly different, sh ow-
ing a more sensitive response, especially at higher doses
and larger fraction sizes. While we previously documen-
ted this increased response in 80S4 cells (wtTP53 p21-/-
), increased sensitivity of other three cell lines; 19S1 86
cells (mutTP53 p21-/-); SW1222 cells (mutATM) and
U251 cells (glio) was unexpected, especially U251 which
is a very resistant glioblastoma cell line based on in
vitro radiosensitivity. We interpret the data in the right
hand panel of figure 4 to demonstrate a heretofore
undocumented mechanism that renders some tumors
significantly more sensitive to radiotherapy. For the
purpose of discussion we will designate these as the
p21- tumor radiosensitivity group since all cell show
diminished expression of p21 (table 1). In the p21-
tumor radiosensitivity group there is a strong effect
observed at higher dose-fractions, particularly 15 Gy.
We emphasize that this designation does not imply
necessarily that p21 is directly involved in tumor radio-
sensitivity although this relationship needs further
investigation.
A quantitative model for the relationship between tumor
response and total dose
The data in figure 4 can be expressed as a relationship
between observed tumor response and logs of total-
cells- killed, but this relationship is clearly different
between tumor cells in the left hand panel and right
hand panel. Therefore the overall relationship between
tumor responses described in Modal Specific Growth
Delay to total dose is not a simple linear relationship
but must be expressed in t erms of at least two factors
that influence quantitative variation across genotype,
fraction size and total dose.
After considerable preliminary calculations we propose
to define a direct relationship between t umor response
and total dose related by two coefficients that represent
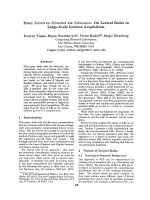
Figure 4 Overal l tumor response , expressed as modal specific growth delay in days, derived from figure 3 plotted against total-cell-
killing derived from figure 1. Each cell line is represented by four responses shown as two responses to fractionated doses (8 × 2 Gy and 2 ×
5Gy) connected by dotted lines and two responses to single acute fractions (1 × 7.5 Gy and 1 × 15.0 Gy) connected by solid lines. Data in the
left hand panel shows responses of the S-R cells fall into a common linear pattern with a correlation coefficient of R
2
= 0.7271. The data in the
right hand show four lines response in a relatively linear pattern (R
2
= 0.7271) but the cell lines in the right hand panel do not The best fit
correlation line for the data in the left hand panel is shown as a solid line on that panel and also redrawn on the right hand panel for
comparison. The trapezoid in the right hand panel includes all data from the left hand panel, emphasizing the differences in scale between the
two panels. Data points are individual measurements.
Williams et al. Radiation Oncology 2010, 5:71
/>Page 7 of 14
separately the effects of in vitro radiosensitivity and in
vivo radiosensitivity. In general terms this would state
that tumor response (TR) would be equal to total dose
modified by two coefficients, τ that is an estimate of
relative sensitivity in vitro and r that is an estimate of
additional radiosensitivity observed in vivo. This equa-
tion is shown below:
TR(G,d,nd) (G,d) G,d D nd=××
()()
(1)
In equation 1, TR (tumor response) is expressed i n
days of modal specific growth delay (mSGD) and is a
function of genotype G,totaldosend delivered in frac-
tions size d. The two modifying coefficients τ and r
vary with genotype and fraction-size. The factor τ repre-
sents in vit ro radiosensitivity expressed as the ratio of
total-cells-killed in vitro per unit dose. The factor r
represen ts a coefficient that expresses addition al in vivo
radiosensitivity that cannot be accounted for by cell kill-
ing. We emphasize that the relationship in equation 1,
is specific to genotype, fraction size and total dose as
indicated by subscripts.
Calculating coefficients that relate tumor response and
total dose on the basis of phenotype
We calculated the coefficient τ in equation 1 as total-
cells-killed per Gy in vitro from the survival data in fig-
ure1intwosteps.Infigure5weshowtherelationship
between total-cells-killed as a function of total dose for
the eight genotypes.
These patterns are a direct portrayal of the changes in
cell killing for the four protocols derived from the survi-
val curves in figure 1.
Thesedatashowageneraloverlappingforthetwo
groups of genotypes. In a similar ma nner, tumor growth
delay can be shown as a function of total dose and we
show this in figure 6, the data derived from figure 4.
These data show significant differences in vivo radio-
sensitivity between the two groups of tumor genotypes.
The major differences are at higher doses and for single
fractions.
From figure 5 we calculated the coefficient τ as the
ratio of modal specific growth delay and total dose.
These data are shown in figure 7.
In this set of cells and protocols, τ varie s between cell
lines up to a factor of ~12 (U-251 versus SW1222) and
between different protocols in a single cell line up to a
difference of up to a factor ~6 (DLD-1 cells, 15 G y
acute versus 8 × 2 fractionated).
In a similar manner we calculated the parameter r
fromthedatainfigure6andthesedataareshownin
figure 8.
Thedatainfigure8representadditionaltumor
response per Gy for observed tumor response for the
eight genotypes and four radiation protocols. The data
in figure 8 show remarkably similar values of r for the
Figure 5 Total-cells killed expressed as logs
10
of surviving fractions for eight cell lines treated with protocols of 1 × 7.5 Gy, 1 × 15 Gy,
2 × 5 Gy and 8 × 2 Gy and plotted as total dose for each protocol. Data in the left panel shows four cell lines hypothesized to express a
common “S-R tumor response phenotype”. Data in the right panel shows the other four cell lines 19S186, SW1222, 80S4 and U251 that are cell
lines that have diminished expression of p21. Error bars are derived directly from survival patterns in figure 1.
Williams et al. Radiation Oncology 2010, 5:71
/>Page 8 of 14
S-R response group over all doses but elevated levels
for the p21- response (80S4 and 19S186) only for sin-
gle doses of 15 Gy. Elevated levels for all responses for
the VS response (SW1222 cells); and surprisingly,
much elevated values for the VR response (U251 cells).
When the 16 values of r for the S-R responses are
compared to the 16 values of cells from the other
response groups there is a highly significant difference
(p < 0.005).
Tumor responses in vivo analyzed as combined effects of
two genotype-dependent coefficients that determine
tumor response
The patterns for variation in τ and r (figure 7 and figure
8) define clustering of tumor response on the basis of
genotype. These variations are more clearly seen when
values of τ and r are plotted against each other for each
genotype and for each protocol. This comparison is
shown in figure 9.
Figure 6 Tumor response compared to total dose for eight cell lines and four radiotherapy protocols. Specific Growth Delay in days is
compared to total dose delivered for the entire protocols. Tumors were irradiated either with two doses delivered as a single fraction (7.5 or
15.0 Gy) or with two fractionated regimens (2 fractions of 5 Gy each or 8 fractions of 2 Gy each). Responses to acutely delivered single fractions
are connected by solid lines; responses to fractionated protocols are connected by dotted lines for each tumor type. The scales are different in
the two panels and all data in the left hand panel falls within the dashed trapezoid shown in the right hand panel.
Figure 7 Values for the parameter τ (logs of total-cells-killed per Gy) for each radiation protocol for each of the eight cell genotypes.
The left panel shows the four cell lines we hypothesize to be the S -R tumor response group and the right panel shows the other four lines.
Williams et al. Radiation Oncology 2010, 5:71
/>Page 9 of 14
Data in this figure resolve tumor response into multi-
ple, distinct clusters of data based on the parameters τ
and r. Heavy arrows identify the pronounced increase
response to 15 Gy for five cell lines. Four tumor
response groups are identifiedandthesecorrespondto
the four in vitro radiosensitivity groups identified in fig-
ure 1. I n figure 9 these groups are further defined on
the values o f the parameters τ and r.TheSandR
response groups share similar values of r but are statis-
tically different based on τ. A VS response group is
defined by significantly increased values for both τ and
r. The VR group is defi ned by significantly lower values
of τ than all other cell lines but highest values of r. Two
data points for 379.2 cells (abrogated TP53) fall between
Figure 8 Values for the parameter r (mSGD/logs of cells killed) for each of the eight cell lines for each of the five protocols. Left panel
shows the four cell lines we hypothesize to be the S-R tumor response group and the right panel shows the other four cell lines that have
significantly elevated response to 15 Gy. Data represent individual estimates.
Figure 9 Comparison of parameters that describe in vitro radiosensitivity (τ) and in vivo radiosensitivity (r) f or each cell line and
irradiation protocol. Lines connect the same pairs of response points for each cell line as shown in figure 3, where for each cell type solid
lines connect the two acute protocols and dashed lines connect the two fractionated protocols. The heavy arrows indicate the increase in
response for 15 Gy compared to response to 7.5 Gy. Error bars represent standard error of the mean for values of τ and r derived from figures 6
and 7.
Williams et al. Radiation Oncology 2010, 5:71
/>Page 10 of 14
the S and R groups. The four groups are statistically dif-
ferent based on t-test analyses with p < 0.05 as the cri-
terion for significance.
Predicting tumor response on the basis of genotype and
fraction size
To illustrate how these parameters can be used to pre-
dict tumor response for specific genotypes and specific
protocols we plot relative sensitivity to radiotherapy as
the product of the two coefficients and this is shown in
figure 10 as a function of fraction size.
These data demonstrate that tumor response varies
strongly based on fraction size and tumor cell genotype.
Predicting genotype-dependent variation in response to
tumor radiotherapy to different protocols
Equation 1, once the coefficients r and τ have been
defined, can also be used to predict the response of
tumor cells to any protocol. In figure 11 we show such
predictions for the eight genotypes studied to four
hypothetical protocols that all deliver 60 Gy: 30 × 2Gy;
12 × 5 Gy; 8 × 7.5 Gy and 4 × 15 Gy. These predicted
responses are shown in figure 11.
These data demonstrate genotype-dependent variation
in predicted tumor response. The extent of this varia-
tion based on genotype and fraction-size has a range of
approximately 14, a remarkable difference for protoco ls
that deliver the same tota l dose. The schema at the
bottom of this figure identifies the relationship between
in v itro cellular radiosensitivity groups and in vivo
tumor radiosensitivity groups.
Discussion
Our studies demonstrate three major observations.
1) We have established a major data base comparing
radiosensitivity in vitro and xenograft tumor
response in vivo for human tumor cells that repre-
sent the range of human tumor cell radiosensitivity.
These data segregate with tumor cell genotypes that
becom e markers for in vivo radiosensitivit y response
groups.
2) We have developed an analytical structure that
predicts response of tumors to different protocols
based on tum or cell genotype and fraction size. This
structure separates the effects of genotype, fraction
size and total dose on tumor radiosensitiv ity. This
structure is based on defining tw o coefficients, each
representing different independent mechanisms. One
coefficient defines TCK (total cell killing (TCK) as
measured in vitro. The second coefficient defines
additional effects in vivo that are not predicted by
TCK. Both coefficients vary with genotype and frac-
tion-size.
3) We have defined a heretofore unreported
mechanism of in vivo radiosensitivity that is
Figure 10 Therelativeeffectoffractionsizeonrelativesensitivitytotumorresponsefortheeightgenotypes. The ordinate is the
product of r × τ and represents the overall relative tumor radiosensitivity.
Williams et al. Radiation Oncology 2010, 5:71
/>Page 11 of 14
dependent on tumor cell genotype and fraction size.
This mechanism can dominate tumor response but
is only observed in some genotypes and for larger
fractions.
The data in figures 1, 2 and 3 define groups of tumor
cells that share in vitro radiosensitivity and share
expression of specific genotypes. We have used this var-
iatio n in tumor cell radiosensitivity to define four radi o-
sensitivity groups. Our analysis of tumor response as it
relates to genotype now allows us to define “ tumor
response groups”. These groups are represented by their
values of τ and r and are listed below.
1) S (wtTP53) tumor response: This tumor response
is represented in this paper by cell lines from the S
radiosensitivity groups that express wtTP53. We
have identified 17 cell lines that share this radiosen-
sitivity group and each expresses wtTP53 [3]. Cells
abrogated in TP53 [2,3] also fall into this radiosensi-
tivity group and hence the radiosensitivity of this
group does not reflect the direct contribution of the
wtp53 protein. In figure 11 we use the response of
one of these cell lines, H CT116 to 60 Gy delivered
as 2 Gy fractions as a basis for compariso n for other
genotypes and other fraction sizes.
2) R (mutTP53) response. This response is repre-
sented by cell lines from the R radiosensitivity group
that express predominantly but not exclusively,
mutTP53. We have identified 14 ce ll lines that share
this cellular radiosensitivity [3] and together with the
S radiosensitivity group these two radiosensitivity
groups represent over 90% of human tumor cell
lines that we have examined. These cell lines share a
common value of r with the S tumor response
group indicating similar in vivo mechanisms of
response but differ i n values of τ directly related to
their decreased radiosensitivity in vitro.
2) VS (mutATM) tumor response: This response is
observed in xenograft tumors comprised of a single
cell line (SW1222) which is mutated in the ATM
gene . We have shown SW1222 cells to be extremely
radiosensitive and show dramatically increased
expression of apoptosis and dysfunctional progres-
sion in the cell cycle [ 21]. The VS response is char-
acterized by the highest values of τ (in vitro
radiosensitivity) of cells but also shows an increase
in response in r compared to S and R responses.
Additionally, this response includes enhanced sensi-
tivity to a single large fractions (15 Gy), a property
shared with other cell lines that expre ss diminished
p21.
3) VR ("glio” ) tumor response. The VR group is
represented by a single cell line in these studies, the
radioresistant glioblastoma cell line U251. We pre-
dict, however, that other radioresistant cell lines that
share extreme in vitro radioresistance may share this
tumor response [2,3]. Tumors comprised of U251
Figure 11 Predicted response of tumors comprised of the eight tumor cell lines to four different radiotherapy protocols th at would
deliver 60 Gy: 30 fractions of 2 Gy; 12 fractions of 5 Gy; 8 fractions of 7.5 Gy; or 4 fractions of 15 Gy. Tumor response was calculated by
multiplying r and τ for each cell line for each protocol by 60 Gy. The legend at the bottom of this figure represents our hypothesis for the
relationships between cell type, cellular radiosensitivity groups and tumor response groups.
Williams et al. Radiation Oncology 2010, 5:71
/>Page 12 of 14
cells are characterized by the most resistant intrinsic
cellular sensitivity in vitro (smallest τ )wehave
observed but are characterized, surprising to us, the
highest values of r for any cell line, particularly for
larger single fractions. If this is a characteristic of all
radioresistant glioblast oma lines, it not only suggests
a rationale for large-fraction therapy of brain tumors
but also offers a more precise clinical strategy for
attacking this class of tumors. We cautio n, however,
that our studies were performed with tumors
implanted in the flanks of n ude mice. We do n ot
know whether glioblastomas within the cranium
would respond in a similar way.
4) p21
-
tumor response to larger fraction-size: This
response is observed in five cell lines and is charac-
terized at the cellular level by diminished expressio n
of p21 (DLD-1, 19S186, 80S4, SW1222 and U251)
and at the tumor level by common enhanced sensi-
tivity only to large fractions (15 Gy). Note that in
our o verall classification, we place both DLD-1 and
its subline 80S4 that is abrogated into R cellular
radiosensitivity group and both exhibit increased
response to 15 Gy, but the relative response of the
line abrogated in p21 results into increased sensitiv-
ity of this sub line similar to the exaggerated
response to 15 Gy by the S cell line abrogated in
p21,ortheotherthreecelllinesinthep21-
response group. While only two of these lines are
abrogated in the CDKN1A (p21) gene, the other
three cell lines show diminished p21 induction as
measured by Western blot analysis. Others have
reported cells with deficient ATM [22] and radiore-
sistant glioblastoma cells [23,24] express diminished
p21 in vivo. We caution that we have certainly not
proved that diminished p21 expression in vivo is the
mechanism that underlies increased radiosensitivity
at higher doses; however it is clearly associated sta-
tistically. To us it is an attractive hypothesis but
proof will require extensive, detailed assay in vivo i n
tumors irradiated with smaller and larger doses in
which p21 expression, VEGF levels, micro vessel den-
sity, apoptosis and cell necrosis are measured in
p21- tumors compared to genotypes that are compe-
tent in the expression of this gene expression.
Our studies define an experimental system that can
identify genes that do or do not influence tumor
response. Genes that influence tumor response can be
described as modifying r or τ or bot h. The ratio τ is
influenced by wt TP53, mutTP53, mutATM and glio but
not by abrogated p21. The ratio r is influenced by
mutATM, abrogated p21, and glio. Abrogated TP53,
abrogated CDKN1A, 14-3-3s , hMLH2 and hMSH6 do
not influence in vitro radiosensitivity as measured in our
studies. 14-3-3s , hMLH2 and hMSH6 do not influence
tumor radiosensitivity in vivo.
We have previo usly hypothesized that differences in τ
may reflect an influence of chromatin structure on
radiosensitivity including access to repair and modula-
tion of apoptosis [1,2] This is supported by several
reports: the protective influence of p53 on chromatin
structure [25] and chromatin structure as a target for
radiation-killing [26]; influence of chromatin structure
onrepair[27].Wehavealsopreviouslyshownthat
depletion of polyamines in chromatin sensitizes cells to
ionizing radiation delivered at higher doses, Williams et
al [28]. Importantly, Hittelman and Pandita [29] have
shown radiosensitivity associated with ATM results
from an essential difference in chromatin structur e that
modulates processing of radiation damage. These several
reports support the hypothesis that variation in radio-
sensitivity betw een the cellular radiosensitivity groups is
attributable to changes in chromatin structure that
develop during oncogenesis.
In vivo radiosensitivity, we hypothesize, reflects
changes in r observed in the several tumor response
groups and may reflect interactions between tumor cell
genotype and the tumor microenvironment. We do not
know what mechanism underlies the relationship
betwee n diminished p21 (p21- response); enhanc ed cel-
lular apoptosis (VS response); and an enhanced, but uni-
dentified, effect observed in radioresistant glioblastoma
cells (VR re sponse). However the differences between in
vivo radiosensitivity and p21 expression can be studied
using the model systems we have developed. Interest-
ingly, Kuljaca et al [30] have shown that p21 promotes
angiogenesis so the interaction of p21 with angiogenesis
at higher doses needs further study. Importantly, the
creation of an appropriate tumor microenvironment
that would enhance tumor response may be achievable
using chemical or biological agents.
We make the following overall hypothesis for the rela-
tionships between tumor cell genotype, intrinsic cellular
radiosensitivity and tumor radiosensitivity:
Tumor cell genotype, used in the broadest sense to
include chromatin co nformation, correlates with: 1)
intrinsic cellular radiosensitivity as defined by clono-
genic survi val in vitro; and 2) enhanced tumor response
in vivo for some genotypes at higher doses reflecti ng an
interaction between tumor cell geno type and the tumor
microenvironment. These two mechanisms act in depen-
dently but together can predict tumor response to dif-
ferent radiotherapy protocols based on tumor cell
genotype, fraction size and total dose.
Abbreviations
Radiosensitivity groups: VS: very sensitive; S: sensitive; R: resistant and VR:
very resistant. Tumor response groups: S +R: cells that express most
Williams et al. Radiation Oncology 2010, 5:71
/>Page 13 of 14
common form of in vivo radiosensitivity. P21- cells exhibit increased in vivo
radiosensitivity and all are deficient or reduced in expression of p21. TCK:
total-cells-killed; mSGD: modal specific growth delay.
Acknowledgements
We acknowledge the contribution of Dr. Bert Vogelstein and Ken Kinsler for
providing human colorectal tumor cell lines. Dr. James Russell provided the
SW1222 cells and Dr. Larry Dillehay collaborated in performing the in vivo
studies.
Supported by PO-CA79862 to JRW and the Department of Radiation
Medicine of Loma Linda Medical Center.
Author details
1
Radiation Research Laboratories, Department of Radiation Medicine, Loma
Linda University Medical Center, Loma Linda CA, USA.
2
Laboratory of
Radiobiology, Johns Hopkins School of Medicine, Baltimore, MD, USA.
3
Department of Radiation Oncology, University of Pennsylvania, Philadelphia,
PA, USA.
4
Center for Radiation Sciences and Environmental Health, Harvard
School of Public Health, Boston, MA, USA.
Authors’ contributions
JW was responsible for overall planning, execution and interpretation of the
studies. HZ and YZ performed all studies, recorded and maintained data
records. CK and JBL were members of the external advisory committed and
worked with JW in planning and interpreting the studies. JFD confirmed
dosimetry and treatment planning and contributed to data analysis. DG and
JS contributed to interpreting the studies with larger fractions that are
achievable with proton therapy. All authors read and approved the
manuscript.
Competing interests
The authors declare that they have no competing interests.
Received: 9 June 2010 Accepted: 12 August 2010
Published: 12 August 2010
References
1. Waldman T, Zhang Y, Dillehay LE, Yu J, Kinzler K, Vogelstein B, Williams J:
Cell cycle arrest vs. cell death in cancer therapy. Nature Medicine 1997,
3:1034-1036.
2. Williams JR, Zhang Y, Russell J, Koch C, Little J: Human Tumor Cells
Segregate into Radiosensitivity Groups that Associate with ATM and
TP53 Status. Acta Oncologica 2007, 46(5):628-38.
3. Williams JR, Zhang Y, Zhou H, Russell J, Gridley D, Koch C, Slater J, Little J: A
quantitative overview of radiosensitivity of human tumor cells across
histological type and TP53 status. Int J Radiat Biol 2008, 84(4):253-64.
4. Rofstad EK: Human tumour xenografts in radiotherapeutic research.
Radiother Oncol 1985, 3(1):35-46.
5. Lehnert S, Guichard M: Radioresistance of human tumor xenografts:
possible mechanisms. NCI Monograph 1988, , 6: 205-9.
6. Rofstad Ek: Radiation biology of human tumour xenografts. Int J Radiat
Biol 1989, 56(5):573-81.
7. Kelland LR, Steel GG: Dose-rate effects in the radiation response of four
human tumour xenografts. Radiother Oncol 1986, 7(3):259-68.
8. Lindenberger J, H Hermeking H, Kummermehr J, Denekamp J: Response of
human tumour xenografts to fractionated X-irradiation. Radiother Oncol
1986, 6(1):15-27.
9. Stuschke M, Bamberg M, Budach V, Gerhard L, Sack H: Dose response
relationships in two xenografted human gliomas after fractionated
radiotherapy. Strahlenther Onkol 1989, 165(7):516-7.
10. Rofstad EK: Fractionation sensitivity (alpha/beta ratio) of human
melanoma xenografts. Radiother Oncol 1994, 33(2):133-8.
11. Rocha S, Resch H, Hegyi I, Oehler C, Glanzmann C, Fabbro D, Bodis S,
Pruschy M: Differential p53-dependent mechanism of radiosensitization
in vitro and in vivo by the protein kinase C-specific inhibitor PKC412.
Cancer Res 2001, 61(2):732-8.
12. Rofstad EK: Local tumor control following single dose irradiation of
human melanoma xenografts: relationship to cellular radiosensitivity
and influence of an immune response by the athymic mouse. Cancer Res
1989, 49(12):3163-7.
13. Winthrop MD, DeNardo SJ, Muenzer JT, Chi SG, Gumerlock PH: p53-
independent response of a human breast carcinoma xenograft to
radioimmunotherapy. Cancer 1997, 80(12 Suppl):2529-37.
14. Duchesne GM, Peacock PH, et al: “The acute in vitro and in vivo
radiosensitivity of human lung tumour lines”. Radiother Oncol 1986,
7(4)
:353-61.
15. West RM, Sutherland RM: The radiation response of a human colon
adenocarcinoma grown in monolayer, as spheroids, and in nude mice.
Radiat Res 1987, 112(1):105-16.
16. Tashian A, DuBois W, Budach W, Baumann M, Freeman J, Suit H: In vivo
radiation sensitivity of glioblastoma multiforme. Int J Radiat Oncol Biol
Phys 1995, 32(1):99-104.
17. Petersen C, Baumann M, Dubben HH, Arps H, Melenkeit A, Helfrich J:
Linear-quadratic analysis of tumour response to fractionated
radiotherapy: a study on human squamous cell carcinoma xenografts.
Int J Radiat Biol 1998, 73(2):197-205.
18. Hwang PM, Torrance C, Waldmann T, Zhang Y, Dillehay L, Williams J,
Lengauer C, Kinzler K, Vogelstein B: Disruption of p53 in human cancer
cells alters the responses to therapeutic agents. J Clin Inv 1999, 104:263-9.
19. Gerweck LE, Zaidi ST, Zeitman A: Multivariate determinates of
radiocurability I: Prediction of single fraction tumor control doses. Int J
Radiat Oncol Biol Phys 1994, 29:57-66.
20. Hoogenhout J, Kal HB, Koedam J, van Wezel HP: Radiosensitivity of
different human tumor lines grown as xenografts determined from
growth delay and survival data. In Vivo 1990, 4(4):253-7.
21. Williams JR, Zhang Y, Zhou H, Russell J, Gridley DS, Koch CJ, Little JB:
Genotype-dependent Radiosensitivity: Clonogenic Survival, Apoptosis
and Cell-Cycle Redistribution. International Journal of Radiation Biology
2008, 84(2):151-164.
22. Delia D, Fontanella E, Ferrario C, Chessa L, Mizutani S: DNA damage-
induced cell-cycle phase regulation of p53 and p21waf1 in normal and
ATM-defective cells. Oncogene 2003, 22(49):7866-9.
23. Shu HK, Kim MM, Chen P, Furman F, Julin CM, Israel MA: The intrinsic
radioresistance of glioblastoma-derived cell lines is associated with a
failure of p53 to induce p21(BAX) expression. Proc Natl Acad Sci USA
1998, 95(24):14453.
24. Kokunai T, Tamaki N: Relationship between expression of p21WAF1/CIP1
and radioresistance in human gliomas. Jpn J Cancer Res 1999,
90(6):638-46.
25. Alison SG, Milner J: Remodelling chromatin on a global scale: a novel
protective effect of p53. Carcinogenesis 2004, 25(9):1551-57.
26. Chapman JD: Single hit mechanisms of tumour cell killing by radiation.
International Journal of Radiation Biology 2003, 71-81.
27. Banath J, MacPhail S, Olive P: Radiation Sensitivity, H2AX Phosphorylation
and Kinetics of Repair of DNA Strand Breaks in Irradiated Cervical
Cancer Cell Lines. Cancer Research 2004, 64:7144-49.
28. Williams JR, Casero RA, Dillehay LE: The effect of polyamine depletion on
the cytotoxic response to PUVA, gamma rays and UVC in V79 cells in
vitro. Biochem Biophys Res Commun 1994, 201(1):1-7.
29. Hittelman WN, Pandita TK: Possible role of chromatin alteration in the
radiosensitivity of ataxia-telangiectasia. Int J Radiat Biol
1994, 66(6 suppl):
S109-13.
30. Kuljaca S, Liu T, Dwarte T, Kavallaris M, Habser M, Norris MD, Martin-
Caballero J, Marshall GM: The cyclin-dependent kinase inhibitor, p21
(WAF-1), promotes angiogenesis by repressing gene transcription of
thioredoxin-binding protein 2 in cancer cells. Carcinogenesis 2009,
30(11):1865-71.
doi:10.1186/1748-717X-5-71
Cite this article as: Williams et al.: Tumor response to radiotherapy is
dependent on genotype-associated mechanisms in vitro and in vivo.
Radiation Oncology 2010 5:71.
Williams et al. Radiation Oncology 2010, 5:71
/>Page 14 of 14